Here you can find the materials for the 3rd and 4th week of the "Data Infrastructure in Production" course, part of the MSc in Business Analytics at CEU.
Table of Contents
- Schedule
- Week 3: Using R in the Cloud
- Welcome to AWS!
- Getting access to EC2 boxes
- Create and connect to an EC2 box
- Install RStudio Server on EC2
- Connect to the RStudio Server
- Set up an easy to remember domain name
- Play with R for a bit
- Schedule R scripts
- ScheduleR improvements
- Job Scheduler exercises
- First steps with interactive R-driven apps: Shiny
- Shiny exercises
- Shiny Server
- Further exercises
- If in doubt
- Week 4: Use Cases on Using R in the Cloud
- Stream processing with R
- Create a central RStudio server
- Create a user for every member of the team
- Storing credentials and other secrets in a secure way in the cloud
- Recap on redis
- Set up a stream
- Read some data from the Kinesis stream
- Write an R function to increment counters on new transactions
- Create consumer processing the records from the stream
- Run a Shiny app showing the progress
- Create local Docker image
- ECR & ECS
- Scheduling Jenkins jobs
- Scaling Shiny with Shinyproxy.io and Docker images
- Stream processing with R
- Feedback
Schedule
- 11:00 - 12:30 Session 1
- 12:30 - 13:30 Lunch
- 13:30 - 15:00 Session 2
- 15:00 - 15:30 Coffee break
- 15:30 - 17:00 Session 3
Week 3: Using R in the Cloud
Goal: learn how to run and schedule R jobs and apps in the cloud.
Welcome to AWS!
-
Use the central CEU AWS account: https://ceu.signin.aws.amazon.com/console
-
Set up 2FA: https://console.aws.amazon.com/iam
-
Secure your access keys:
"When I woke up the next morning, I had four emails and a missed phone call from Amazon AWS - something about 140 servers running on my AWS account, mining Bitcoin" -- Hoffman said
PS probably you do not really need to store any access keys, but you may rely on roles and KMS
-
Let's use the
eu-west-1Ireland region
Getting access to EC2 boxes
Note: we follow the instructions on Windows in the Computer Lab, but please find below how to access the boxes from Mac or Linux as well when working with the instances remotely.
-
Create (or import) an SSH key in AWS: https://eu-west-1.console.aws.amazon.com/ec2/v2/home?region=eu-west-1#KeyPairs:sort=keyName
-
Get an SSH client:
-
Windows -- Download and install PuTTY: https://www.putty.org
-
Mac -- Install PuTTY for Mac using homebrew or macports
sudo brew install putty sudo port install putty -
Linux -- probably the OpenSSH client is already installed, but to use the same tools on all operating systems, please install and use PuTTY on Linux too, eg on Ubuntu:
sudo apt install putty
-
-
Convert the generated pem key to PuTTY format
-
GUI: https://docs.aws.amazon.com/AWSEC2/latest/UserGuide/putty.html#putty-private-key
-
CLI:
puttygen key.pem -O private -o key.ppk
-
-
Make sure the key is readable only by your Windows/Linux/Mac user, eg
chmod 0400 key.ppk
Create and connect to an EC2 box
-
Create a tiny EC2 instance
- Optional: create an Elastic IP for your box
- Go the the Instances overview at https://eu-west-1.console.aws.amazon.com/ec2/v2/home?region=eu-west-1#Instances:sort=instanceId
- Click "Launch Instance"
- Pick the
Ubuntu Server 16.04 LTS (HVM), SSD Volume TypeAMI - Pick
t2.microinstance type (see more instance types) - Click "Review and Launch"
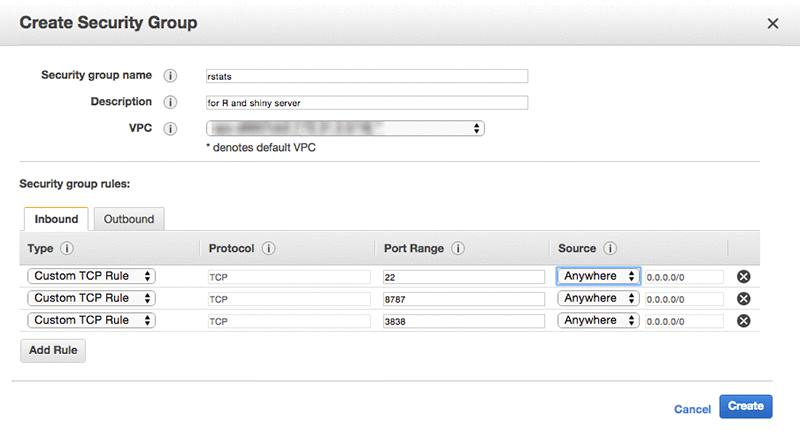
- Pick a unique name for the security group
- Click "Launch"
-
Connect to the box
- Specify the hostname or IP address
- Specify the key for authentication
- Set the username to
ubuntuon the Connection/Data tab - Save the Session profile
- Click the "Open" button


Install RStudio Server on EC2
-
Look at the docs: https://www.rstudio.com/products/rstudio/download-server
-
Download Ubuntu
aptpackage listsudo apt update -
Install dependencies
sudo apt install r-base gdebi-core -
Try R
R -
Install RStudio Server
wget https://download2.rstudio.org/rstudio-server-1.1.423-amd64.deb sudo gdebi rstudio-server-1.1.423-amd64.deb -
Check process and open ports
sudo ps aux| grep rstudio sudo rstudio-server status sudo systemctl status rstudio-server sudo netstat -tapen|grep LIST -
Look at the docs: http://docs.rstudio.com/ide/server-pro/
Connect to the RStudio Server
-
Confirm that the service is up and running and the port is open
ubuntu@ip-172-31-12-150:~$ sudo netstat -tapen|grep LIST tcp 0 0 0.0.0.0:8787 0.0.0.0:* LISTEN 0 49065 23587/rserver tcp 0 0 0.0.0.0:22 0.0.0.0:* LISTEN 0 15671 1305/sshd tcp6 0 0 :::22 :::* LISTEN 0 15673 1305/sshd -
Try to connect to the host from a browser on port 8787, eg http://foobar.eu-west-1.compute.amazonaws.com:8787
-
Realize it's not working
-
Open up port 8787 in the security group
-
Authentication: http://docs.rstudio.com/ide/server-pro/authenticating-users.html
-
Create a new user:
sudo adduser ceu -
Login & quick demo:
1+2 plot(mtcars) install.packages('beanplot') system('whoami') -
Reload webpage (F5)
-
Demo the terminal:
$ sudo whoami ceu is not in the sudoers file. This incident will be reported. -
Grant sudo access to the new user:
 sudo apt install -y mc
 sudo mc
 sudo mcedit /etc/sudoers
 sudo adduser ceu admin
 man adduser
 man deluser
Note 1: might need to relogin
Note 2: you might want to add NOPASSWD to the sudoers file:
ceu ALL=(ALL) NOPASSWD:ALL
Although also note (3) the related security risks.
- Custom login page: http://docs.rstudio.com/ide/server-pro/authenticating-users.html#customizing-the-sign-in-page
- Custom port: http://docs.rstudio.com/ide/server-pro/access-and-security.html#network-port-and-address
Set up an easy to remember domain name
-
Go to Route 53: https://console.aws.amazon.com/route53/home
-
Go to Hosted Zones and click on
ceudata.net -
Create a new Record, where
- fill in the desired
Name(subdomain) - paste the public IP address or hostname of your server in the
Valuefield - click
Create
- fill in the desired
Play with R for a bit
-
Installing packages:
## don't do this at this point! ## install.packages('ggplot2') -
Use binary packages instead via apt & Launchpad PPA:
sudo add-apt-repository ppa:marutter/rrutter sudo add-apt-repository ppa:marutter/c2d4u sudo apt-get update sudo apt-get upgrade sudo apt-get install r-cran-ggplot2 -
Ready to use it from R after restarting the session:
library(ggplot2) ggplot(mtcars, aes(hp)) + geom_histogram() -
Get some real-time data and visualize it:
-
Install devtools in the RStudio/Terminal:
sudo apt-get install r-cran-devtools r-cran-data.table r-cran-httr r-cran-futile.logger r-cran-jsonlite r-cran-data.table r-cran-snakecase -
Install an R package from GitHub to interact with crypto exchanges:
devtools::install_github('daroczig/binancer') -
First steps with live data:
library(binancer) klines <- binance_klines('BTCUSDT', interval = '1m', limit = 60*3) str(klines) summary(klines$close) -
Visualize the data
ggplot(klines, aes(close_time, close)) + geom_line() -
Create a candle chart
library(scales) ggplot(klines, aes(open_time)) + geom_linerange(aes(ymin = open, ymax = close, color = close < open), size = 2) + geom_errorbar(aes(ymin = low, ymax = high), size = 0.25) + theme_bw() + theme('legend.position' = 'none') + xlab('') + ggtitle(paste('Last Updated:', Sys.time())) + scale_y_continuous(labels = dollar) + scale_color_manual(values = c('#1a9850', '#d73027')) # RdYlGn -
Compare prices of 4 currencies in the past 24 hours on 15 mins intervals:
library(data.table) klines <- rbindlist(lapply( c('ETHBTC', 'ARKBTC', 'NEOBTC', 'IOTABTC'), binance_klines, interval = '15m', limit = 4*24)) ggplot(klines, aes(open_time)) + geom_linerange(aes(ymin = open, ymax = close, color = close < open), size = 2) + geom_errorbar(aes(ymin = low, ymax = high), size = 0.25) + theme_bw() + theme('legend.position' = 'none') + xlab('') + ggtitle(paste('Last Updated:', Sys.time())) + scale_color_manual(values = c('#1a9850', '#d73027')) + facet_wrap(~symbol, scales = 'free', nrow = 2) -
Some further useful functions:
binance_ticker_all_prices()binance_coins_prices()binance_credentialsandbinance_balances
-
Create an R script that reports and/or plots on some cryptocurrencies
-
Schedule R scripts

-
Install Jenkins from the RStudio/Terminal: https://pkg.jenkins.io/debian-stable/
wget -q -O - https://pkg.jenkins.io/debian-stable/jenkins.io.key | sudo apt-key add - echo "deb https://pkg.jenkins.io/debian-stable binary/" | sudo tee -a /etc/apt/sources.list sudo apt update sudo apt install jenkins ## installs Java as well sudo netstat -tapen | grep java -
Open up port 8080 in the related security group
-
Access Jenkins from your browser and finish installation
-
Read the initial admin password from RStudio/Terminal via
sudo cat /var/lib/jenkins/secrets/initialAdminPassword -
Proceed with installing the suggested plugins
-
Create your first user (eg
ceu)
-
-
Create a new job:
-
Enter the name of the job:
get current Bitcoin price -
Pick "Freestyle project"
-
Click "OK"
-
Add a new "Execute shell" build step
-
Enter the below command to look up the most recent BTC price
R -e "library(binancer);binance_coins_prices()[symbol == 'BTC', usd]" -
Run the job

-
-
Install R packages system wide from RStudio/Terminal (more on this later):
sudo Rscript -e "library(devtools);with_libpaths(new = '/usr/local/lib/R/site-library', install_github('daroczig/binancer'))" -
Rerun the job

ScheduleR improvements
-
Create an R script and run with
Rscriptinstead ofR-- eg with the below contentlibrary(binancer) prices <- binance_coins_prices() library(futile.logger) flog.info('The current Bitcoin price is: %s', [symbol == 'BTC', usd]) -
Learn about little R: https://github.com/eddelbuettel/littler
-
Set up e-mail notifications via SNS: https://eu-west-1.console.aws.amazon.com/ses/home?region=eu-west-1#
-
Whitelist and confirm your e-mail address at https://eu-west-1.console.aws.amazon.com/ses/home?region=eu-west-1#verified-senders-email:
-
Take a note on the SMTP settings:
- Server: email-smtp.eu-west-1.amazonaws.com
- Port: 587
- TLS: Yes
-
Create SMTP credentials and note the username and password
-
Configure Jenkins at http://SERVERNAME.ceudata.net:8080/configure
-
Set up the default FROM e-mail address: jenkins@ceudata.net
-
Search for "Extended E-mail Notification" and configure
- SMTP Server
- Click "Advanced"
- Check "Use SMTP Authentication"
- Enter User Name from the above steps from SNS
- Enter Password from the above steps from SNS
- Check "Use SSL"
- SMTP port: 587
-
-
Set up "Post-build Actions" in Jenkins: Editable Email Notification - read the manual and info popups, configure to get an e-mail on job failures and fixes
-
Job Scheduler exercises
- Configure your first job to alert if Bitcoin price is below $10K or higher than $12K
- Create a Jenkins job running hourly to generate a candlestick chart on the price of BTC and ETH
- Create an alert if BTC or ETH price changed more than 5% in the past 24 hours
First steps with interactive R-driven apps: Shiny
-
Install Shiny
sudo apt-get install r-cran-shiny r-cran-rmarkdown -
Refresh what we have
learnedbriefly covered in the DA1 class: https://github.com/daroczig/CEU-R-lab#week-6-100-min-introduction-to-r-markdown-and-shiny -
Create a new "Shiny Web Application" file
-
Pick a name for the App and the "Single File" option
-
Copy/paste the content of our demo app from https://github.com/daroczig/CEU-R-lab/blob/2018/6.R
-
Click on the "Run app" button
-
Disable the popup blocker in the right corner of the navigation bar
-
Retry running the app and enjoy :)
Shiny exercises
- Create a minimal dashboard showing the ETH prices in the past 24 hours
- Add a dropdown input field to the sidebar to let users change the interval of the plot (eg 1 min, 15 mins, 1 hour etc) -- read the
binance_klinesdocs - Add a dropdown input field to the sidebar to let users pick the symbol (eg
ETHorBTC) - Make the plot interactive eg with http://jkunst.com/highcharter
See the shiny/highcharter subfolder for a possible solution if you get stuck.
Shiny Server
-
Install the
highcharterpackage as a system user:sudo apt-get install r-cran-dplyr r-cran-quantmod r-cran-xml r-cran-tidyr r-cran-igraph r-cran-lubridate r-cran-psych r-cran-broom r-cran-yaml r-cran-htmlwidgets sudo R -e "devtools::with_libpaths(new = '/usr/local/lib/R/site-library', install.packages('highcharter', repos='https://cran.rstudio.com/'))" -
Install Shiny Server:
wget https://download3.rstudio.org/ubuntu-12.04/x86_64/shiny-server-1.5.6.875-amd64.deb sudo gdebi shiny-server-1.5.6.875-amd64.deb -
Edit
site_dirinshiny-server.conf:sudo mcedit /etc/shiny-server/shiny-server.conf sudo systemctl restart shiny-server -
Visit Shiny Server on port 3838 from your browser

-
Always keep logs -- set this in the Shiny Server config & restart service:
preserve_logs true; -
Debug logs
ls -la /var/log/shiny-server
Further exercises
- Look at the
forecastpackage and make predictions on future Bitcoin prices -- visualize on a dashboard - Look at the
knitrorpanderpackages and schedule an HTML e-mail report including an image on the price changes -- refresh what we havelearnedbriefly covered in the DA1 class: https://github.com/daroczig/CEU-R-lab#week-6-100-min-introduction-to-r-markdown-and-shiny
If in doubt
Kill your current box and start a new one using the data-infra-in-prod-R-image AMI that already bundles all above steps:

Week 4: Use Cases on Using R in the Cloud
Quiz: no quiz today -- but please consider spending the related time later to fill in the QA questionnaire on this class
Reminder: what is
- RStudio Server
- Shiny Server
- Jenkins
Stream processing with R
Background: slides
Create a central RStudio server
We will use one decent sized node today instead of many tiny instances: t2.xlarge with 4 vCPU and 16 gigs of RAM
Use our custom Amazon AMI: data-infra-in-prod-R-image
Already installed software:
- RStudio Server
- Shiny Server
- Jenkins
Configured users: ceu
Notes: the sudo commands are to be run on only one computer as those updates will take effect globally, so
- run all steps if you are configuring the server
- run only the steps in R / you were asked to run if you are a regular user
Create a user for every member of the team
We'll export the list of IAM users from AWS and create a system user for everyone.
-
Attach a newly created IAM EC2 Role (let's call it
ceudataserver) to the EC2 box and assign 'Read-only IAM access':


-
Install AWS CLI tool:
sudo apt install awscli -
List all the IAM users: https://docs.aws.amazon.com/cli/latest/reference/iam/list-users.html
aws iam list-users -
Export the list of users from R:
library(jsonlite) users <- fromJSON(system('aws iam list-users', intern = TRUE)) str(users) users[[1]]$UserName -
Create a new system user on the box (for RStudio Server access) for every IAM user:
library(futile.logger)
for (user in users[[1]]$UserName) {
  flog.info(sprintf('Creating %s', user))
  system(sprintf("sudo adduser --disabled-password --quiet --gecos '' %s", user))
  flog.info(sprintf('Setting password for %s', user))
  system(sprintf("echo '%s:secretpass' | sudo chpasswd", user)) ## note the single quotes + sudo
}
Note, you may have to temporarily enable passwordless sudo for this user :/
ceu ALL=(ALL) NOPASSWD:ALL
Check users:
readLines('/etc/passwd')
Storing credentials and other secrets in a secure way in the cloud
Using Amazon's KMS: https://aws.amazon.com/kms
-
Go to IAM's Encryption Keys: https://console.aws.amazon.com/iam/home?region=eu-west-1#/encryptionKeys/us-east-1
-
Create a new key:
ceudata -
Optionally allow user access to the key
-
Allow the
ceudataserverIAM role to use the key -
Install
rJava:sudo apt install r-cran-rjava -
Install the
AWR.KMSpackage globally:sudo R -e "devtools::with_libpaths(new = '/usr/local/lib/R/site-library', install.packages('AWR.KMS', repos='https://cran.rstudio.com/'))" -
First steps with securing sensitive information
library(AWR.KMS)
secret <- kms_encrypt('foobar', key = 'alias/ceudata')
secret
kms_decrypt(secret)
Recap on redis
-
Install server
sudo apt install redis-server netstat -tapen|grep LIST -
Install client
sudo apt install r-cran-rredis -
Interact from R
library(rredis)
redisConnect()
redisSet('foo', 'bar')
redisGet('foo')
redisIncr('counter')
redisIncr('counter')
redisIncr('counter')
redisGet('counter')
redisDecr('counter')
redisDecr('counter2')
redisMGet(c('counter', 'counter2'))
Set up a stream
- Go to AWS Console: https://eu-west-1.console.aws.amazon.com/kinesis/home?region=eu-west-1#/streams/list
- Start writing data to the stream: http://ceu.datapao.com
Read some data from the Kinesis stream
-
Allow Kinesis read-only access to the
ceudataserverIAM role -
Install the R client
sudo R -e "library(devtools);with_libpaths(new = '/usr/local/lib/R/site-library', install_github('daroczig/AWR.Kinesis'))" -
Get a sample from the stream
library(AWR.Kinesis)
records <- kinesis_get_records('ceudata', 'eu-west-1')

library(jsonlite)
records <- stream_in(textConnection(records))
-
Some quick counts
library(data.table)
records <- data.table(records)
records[, .N, by = country]
Write an R function to increment counters on new transactions
-
Get sample raw data as per above
records <- kinesis_get_records('ceudata', 'eu-west-1')
-
Function to parse and process it
txprocessor <- function(record) {
  country <- fromJSON(record)$country
  flog.debug(paste('Found 1 transaction going to', country))
  redisIncr(sprintf('countrycode:%s', country))
}
-
Iterate on all records
library(futile.logger)
library(rredis)
redisConnect()
for (record in records) {
  txprocessor(record)
}
-
Check counters
countries <- redisMGet(redisKeys('countrycode:*'))
countries <- data.frame(
  country = sub('^countrycode:', '', names(countries)),
  N = as.numeric(countries))
-
Visualize
library(ggplot2)
ggplot(countries, aes(country, N)) + geom_bar(stat = 'identity')
Create consumer processing the records from the stream
-
Create a new folder for the Kinesis consumer files:
streamer -
Create an
app.propertiesfile within that subfolder
executableName = ./app.R
regionName = eu-west-1
streamName = ceudata
applicationName = demo_app
AWSCredentialsProvider = DefaultAWSCredentialsProviderChain
- Create the
app.Rfile:
#!/usr/bin/Rscript
library(futile.logger)
library(AWR.Kinesis)
library(jsonlite)

kinesis_consumer(

    initialize = function() {
        flog.info('Hello')
        library(rredis)
        redisConnect(nodelay = FALSE)
        flog.info('Connected to Redis')
    },

    processRecords = function(records) {
        flog.info(paste('Received', nrow(records), 'records from Kinesis'))
        for (record in records$data) {
            country <- fromJSON(record)$country
            flog.debug(paste('Found 1 transaction going to', country))
            redisIncr(sprintf('countrycode:%s', country))
        }
    },

    updater = list(
        list(1/6, function() {
            flog.info('Checking overall counters')
            countries <- redisMGet(redisKeys('countrycode:*'))
            flog.info(paste(sum(as.numeric(countries)), 'records processed so far'))
    })),

    shutdown = function()
        flog.info('Bye'),

    checkpointing = 1,
logfile = 'app.log')-
Allow writing checkpointing data to DynamoDB and CloudWatch in IAM
-
Convert the above R script into an executable
chmod +x app.R
Run the app:
/usr/bin/java -cp /usr/local/lib/R/site-library/AWR/java/*:/usr/local/lib/R/site-library/AWR.Kinesis/java/*:./ \
    com.amazonaws.services.kinesis.multilang.MultiLangDaemon \
    ./app.properties
Run a Shiny app showing the progress
-
Reset counters
library(rredis)
redisConnect()
keys <- redisKeys('country*')
redisDelete(keys)
-
Install the
treemappackagesudo R -e "devtools::with_libpaths(new = '/usr/local/lib/R/site-library', install.packages('treemap', repos='https://cran.rstudio.com/'))" -
Run the below Shiny app
## packages for plotting
library(treemap)
library(highcharter)

## connect to Redis
library(rredis)
redisConnect()

library(shiny)
library(data.table)
ui     <- shinyUI(highchartOutput('treemap', height = '800px'))
server <- shinyServer(function(input, output, session) {

    countries <- reactive({

        ## auto-update every 2 seconds
        reactiveTimer(2000)()

        ## get frequencies
        countries <- redisMGet(redisKeys('countrycode:*'))
        countries <- data.table(
          country = sub('^countrycode:', '', names(countries)),
          N = as.numeric(countries))

        ## color top 3
        countries[, color := 1]
        countries[country %in% countries[order(-N)][1:3, country],
            color := 2]

        ## return
        countries
    })

    output$treemap <- renderHighchart({
        tm <- treemap(countries(), index = c('country'),
                      vSize = 'N', vColor = 'color',
                      type = 'value', draw = FALSE)
        N <- sum(countries()$N)
        hc_title(hctreemap(tm, animation = FALSE),
                 text = sprintf('Transactions (N=%s)', N))
    })

})
shinyApp(ui = ui, server = server, options = list(port = 8080))
Create local Docker image
- Install Docker
curl -fsSL https://download.docker.com/linux/ubuntu/gpg | sudo apt-key add -
sudo add-apt-repository "deb [arch=amd64] https://download.docker.com/linux/ubuntu $(lsb_release -cs) stable"
sudo apt-get update
sudo apt install docker-ce
- Create a
Dockerfiledescribing your Docker image based on https://github.com/cardcorp/card-rocker/blob/master/r-kinesis/Dockerfile
FROM cardcorp/r-kinesis:latest
MAINTAINER Gergely Daroczi <daroczig@rapporter.net>

## Install R package to interact with Redis
RUN install2.r --error rredis && rm -rf /tmp/downloaded_packages/ /tmp/*.rds

## Add consumer
ADD app.properties /
ADD app.R /
- Build the Docker image via the above
Dockerfile
sudo docker build -t ceudata .
sudo docker images
- Run it
sudo docker run --rm -ti ceudata /app.properties
- Problem: cannot access Redis on
localhost-> remote DB access & using credentials
ECR & ECS
-
Update Redist config to require auth and to become accessible on the network interfaces
sudo mcedit /etc/redis/redis.conf ## bind ## AUTH sudo systemctl restart redis sudo netstat -tapen | grep LIST -
Open up the port in the Security Group (default port on
6379) -
Try connecting from a remote machine, eg
redisConnect('127.0.0.1', password = 'ceudata')
-
Update the above R script to use the IP and password (via KMS) and restart the Docker container for a local test
-
Update IAM role to be able to push to ECR
-
docker push -
Set up ECS task definition and service etc as per slides
Scheduling Jenkins jobs
Configure Jenkins to recognize the newly created Linux system users
-
Go to Manage Jenkins
-
Go to Configure Global Security
-
Enable "Unix user/group database" in the Security Realm
-
Add
jenkinsto theshadowgroup so that it can read the pass hashessudo adduser jenkins shadow -
Restart Jenkins
sudo systemctl jenkins restart
Set up a Slack bot
-
A custom Slack app is already created at https://api.slack.com/apps/A9FBHCLPR, but feel free to create a new one and use the related app in the following steps
-
Look up the app's bots in the sidebar
-
Look up the OAuth Access Token and encrypt via KMS
library(AWR.KMS)
kms_encrypt('token', key = 'alias/ceudata')
-
Install the Slack R client
sudo R -e "devtools::with_libpaths(new = '/usr/local/lib/R/site-library', install.packages('slackr', repos='https://cran.rstudio.com/'))" -
Init and send our first messages with
slackrlibrary(AWR.KMS) token <- kms_decrypt('ciphertext') library(slackr) slackr_setup(username = 'ceudatabot', api_token = token, icon_emoji = ':r:') text_slackr(text = 'Hi there!', channel = '#bots')
-
A more complex message
library(binancer)
prices <- binance_coins_prices()
msg <- sprintf(':money_with_wings: The current Bitcoin price is: $%s', prices[symbol == 'BTC', usd])
text_slackr(text = msg, preformatted = FALSE, channel = '#bots')
-
Or plot
klines <- binance_klines('BTCUSDT', interval = '1m', limit = 60*3)
p <- ggplot(klines, aes(close_time, close)) + geom_line()
ggslackr(plot = p, channels = '#bots', width = 12)
Exercise: Create a Jenkins job
- Pick a coin from
binance_coins_prices() - Write an R script in RStudio looking up the most recent price or prices, do some analysis or simple reporting on it
- Create a Jenkins job to run it every minute -- using your username as a prefix for all newly created jobs so that we can easily identify your jobs
- Let's create a view for every user
- Note that all jobs are running as the
jenkinsuser - If you get stuck, look up notes from last week
- What happens if the job fails? Create an alert with the failure message!
Example code:
library(binancer)
prices <- binance_coins_prices()
msg <- sprintf(':money_with_wings: The current Bitcoin price is: $%s', prices[symbol == 'BTC', usd])

library(AWR.KMS)
token <- kms_decrypt("***")

library(slackr)
slackr_setup(username = 'ceudatabot', api_token = token, icon_emoji = ':r:')
text_slackr(text = msg, preformatted = FALSE, channel = '#bots')
Exercise: Create another Jenkins job
- Get a sample from the Kinesis strem
- Sum up the amounts
- Report in the #bots channel
Exercise: Dockerize the Jenkins job
-
Enable Docker usage for
jenkinssudo adduser jenkins docker sudo systemctl jenkins restart -
Create a Dockerfile including R package installations
-
Build the Docker image
-
Update the Jenkins job to call
docker runinstead of directlyRscript
Scaling Shiny with Shinyproxy.io and Docker images
- Dockerize the Shiny app (including updates to the Redis connection)
- Install ShinyProxy from shinyproxy.io
- Look at the config at https://www.shinyproxy.io/configuration
- Deploy on localhost or ECS
Feedback
As you may know, we are continuously trying to improve the content of this class and looking forward to any feedback and suggestions: https://gdaroczi.typeform.com/to/OXxs1y