This is a dashboard for some statistics on the IPL ( www.iplt20.com ) for seasons 1 through 9. The goal of the project is to demonstrate front-end capabilities while showcasing some interesting statistics about the source data set.
In order to gain insight into the data and provide a consumable version of the data, I used excel Pivot Tables and Formulas to come up with some statistics I thought were interesting
I decided to try a new framework I had not used before that was recommended in the brief – I went with Vue.js. Since the brief mentioned creating a progressive web application, I decided to inline all assets and did a couple of things to achieve this namely–
- Used the pre-built vue-cli PWA template with a lighthouse score of 90+/100
- Pre-formatted the source data to be directly consumable by the charts
- Inlined the SVG icons that were used in the application using vue-svgicon
- Inlined the .json data files using Webpack's built-in json loader
- Made sure there were no external dependencies apart from core application files
- Made sure its usable offline
With the design I aimed to provide an eye-catching, easy-to-digest and platform-agnostic accessible web application. The colors used were specifically chosen from the TOL Rainbow Palette using the google-palette package.
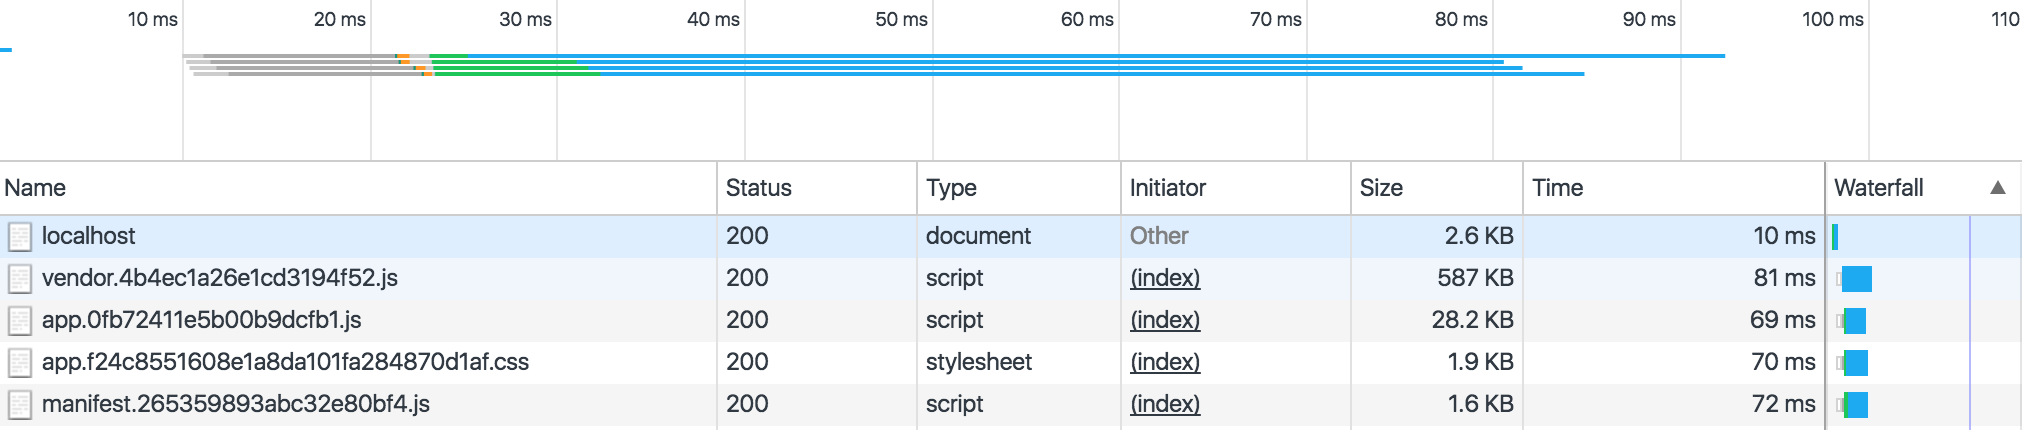
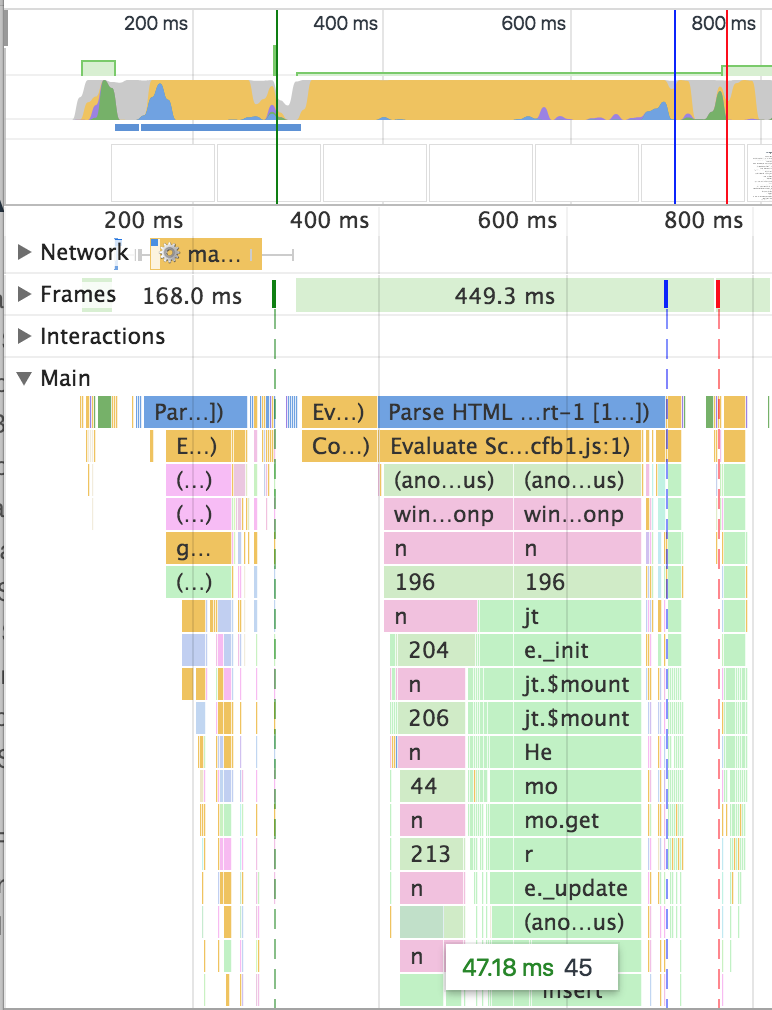
The performance of this application was designed for minimal perceived load time. The charts all load within 800 ms.
For progressive web application features such as asset and request caching and preloading and easier development
Out of the free and open-source charting libraries compatible with Vue.js I found Chart.js to be easy to use and customizable enough for presentable charts. I used the vue-chartjs wrapper for Chart.js that allowed me to embed them directly as components.
Had significant difficulty inlining SVGs into Vue templates. Finally decided to go with this plugin as it worked out of the box for me and allowed me to inline the SVGs
Basic tabbing and scrolling plugin for Vue.js to provide navigation
For accessible and aesthetically pleasing colors.
I used this CSV to JSON online tool for creating JSON files
Singificant learning here. Found excel very powerful for small datasets and quick insights. Found it to be more powerful than Mac Numbers.
Found it fairly easy to use and setup specially with the boilerplate. Some initial inevitable wrestling with Webpack dependencies etc. I feel this is an inferior framework to React.js for very large scale web applications but quite suitable for smaller projects without complicated data-models and state changes.
Very easy to setup and use. Nice looking output charts and animations. Not as powerful as some other options out there but probably one of the best of the free libraries.
# install dependencies
npm install

# serve with hot reload at localhost:8080
npm run dev

# build for production with minification
npm run build

# build for production and view the bundle analyzer report
npm run build --report
For detailed explanation on how things work, checkout the guide and docs for vue-loader.