Simple Unity framework to debug shader code. Supports vertex, fragment, standard, and postprocessing shaders.
Supported versions should be between 2017.x to 2021.3, but it probably works on more recent versions too. Tested mainly with the built-in rendering pipeline, but might now work with the scriptable rendering pipeline as well. This works by displaying extra information in the scene view (not in the game view nor inside VR headsets).
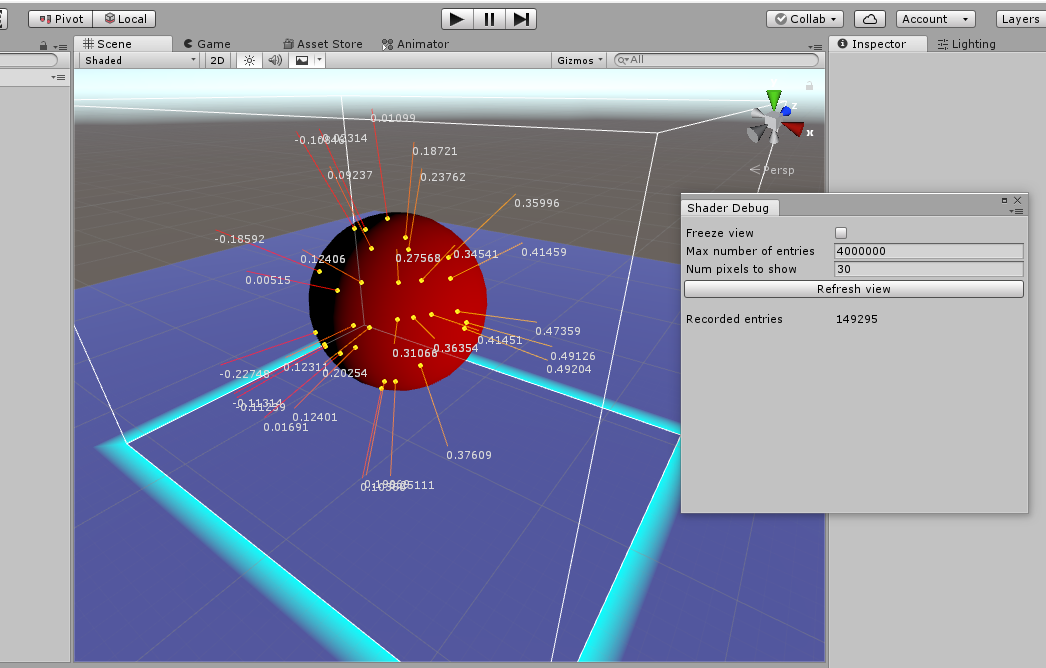
Here's an example:
We have a custom fragment shader rendering the red ball, and the goal is to debug it. We add a few lines to it (see below) and then choose "Window", "Shader Debugger" in the Unity menus. A small number of pixels that use this shader are automatically sampled and displayed as yellow dots. For each yellow dot, the extra information that we chose to record from the pixel shader is displayed.
In this case, this info is (what we think to be) the normal vector, displayed in a color
between red and orange; and add at the end of that vector, a custom label with some
numerical value. This is done by writing the following code in the pixel shader (this
example comes from the Demo directory):
#pragma target 4.5            /* or also "#pragma require compute", from Unity 2019 */
#include "Assets/ShaderDebugger/debugger.cginc"    /* could also be a relative path */

...

fixed4 frag (v2f i) : SV_Target
{
    float red = i.localPosition.x;

    /* Start of debug code */
    uint root = DebugFragment(i.vertex);     /* 'i.vertex' is the SV_POSITION field */
    DbgSetColor(root, float4(1, i.localPosition.x, 0, 1));
    DbgVectorO3(root, i.localPosition.xyz);     /* a 3D vector in object coordinates */

    DbgChangePosByO3(root, i.localPosition.xyz);  /* move to the other end of that 3D vector */
    DbgValue1(root, red);                         /* draw a label with one float value */
    /* End of debug code */

    return fixed4(red, 0, 0, 1);
}

...
Note that this only works in the Scene view, not in the Game view (nor in builds).
NEW (july 2023): fix for the Unity SRP by Aki (with small untested changes). Thanks!
NEW (sept. 2021): it also works with standard shaders. See the demo in the directory
"Demo Standard". You need to call DebugWorldPos() instead of DebugFragment().
NEW (oct. 2019): it also supports vertex shaders. See the demo in the directory "Demo Vertex".
The main difference is that you need to call DebugVertexO4() and not DebugFragment().
NEW (sept. 2019): it also works with post-processing or image effect shaders. See the demos in the directories "Demo" and "Demo PostProcessing".
In general, you must call the initialization function once in the shader pass you want to debug. This means:
-
for vertex shaders:
uint root = DebugVertexO4(i.vertex);. The argument is the field marked asPOSITIONin the input structure. Alternatively, you can useuint root = DebugVertexW4(float4);oruint root = DebugWorldPos(float3);if you have a world position and not really an object position. -
for fragment shaders:
uint root = DebugFragment(i.vertex);. The argument is the field marked asSV_POSITIONin the input structure. As above, you can sometimes useDebugVertexW4(float4)orDebugWorldPos(float3)if it is easier to get the world position. -
for post-processing shaders: same as for fragment shaders, use
DebugFragment(i.position);with the field marked asSV_POSITION. -
for standard surface shaders:
uint root = DebugWorldPos(IN.worldPos);. The argument is the fieldfloat3 worldPos;from thestruct Inputdeclared in your custom standard shader. Make sure this field is declared there.
Then you can call any number of
DbgXxx() functions by passing the root value as first argument. The whole list
of supported functions is in debugger.cginc. (If you need to add more, you need to edit
that place as well as DisplayHandle() in ShaderDebugger.cs. Please issue pull requests
if you add something generally useful!)
Note the naming convention: function names ending in O4 or W4 expect coordinates as float4
in object or world space, respectively. Function names ending in O3 or W3 are the same
but expecting a float3, and interpret it as a vector instead of a position. There is
a "current" position and color which affect what you draw next; you can change it with
DbgChangePosXxx() and DbgSetColor(). In the example above, the final DbgValue1()
writes one float numerically on screen, at the position that was just changed in the previous line.
You should remember to remove or comment out all the code from the shader---including the
#include "debugger.cginc"--- when you are done.
If the shader is more complicated, just make sure you call uint root = DebugFragment/Vertex/WorldPos()
once, typically at the start of the shader function, and then pass around the root variable to all
places where you need to call the other DbgXxx() functions. Or more simply, declare a global
variable uint root;, assign it at the start of the shader function, and read it from anywhere
to call the DbgXxx() functions. Feel free to add branches, like
if (x < 0) DbgSetColor(root, float4(1,0,0,1)); to make the next thing red if x < 0.
You're writing a shader, but in this case you don't have to worry about performance :-)
Have fun!
