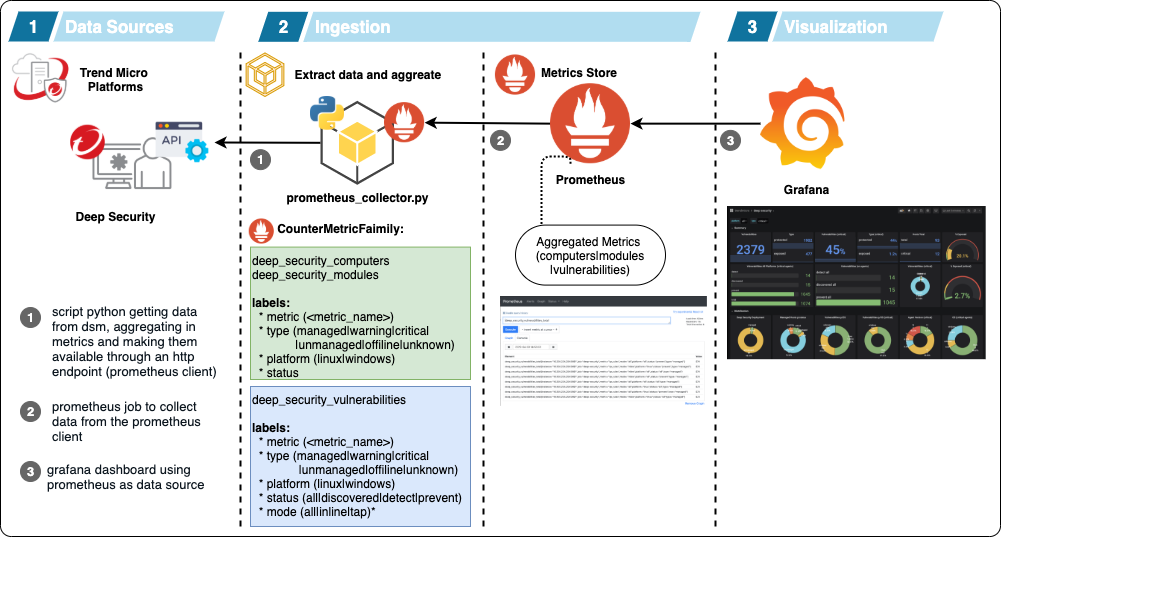
This project creates a prometheus collector getting metrics from Deep Security DSM 11.0.
The data is aggregated in count and segmented in 3 groups:
- deep_security_computers
- deep_security_modules
- deep_security_vulnerabilities
-
deep_security_computers
- labels:
- metric: platform | os_type | agent_version | agent_version_major
- type: managed | warning | critical | unmanaged | offline | unknown
- platform: all | linux | windows
- status: (os version) | (agent version)
- labels:
-
deep_security_modules
- labels:
- metric: am_status | wr_status | fw_status | ip_status | im_status | li_status
- type: managed | warning | critical | unmanaged | offline | unknown
- platform: all | linux | windows
- status: on | off
- labels:
-
deep_security_vulnerabilities
- labels:
- metric: am_status | wr_status | fw_status | ip_status | im_status | li_status
- type: managed | warning | critical | unmanaged | offline | unknown
- platform: linux | windows
- status: all | discovered | detect | prevent
- labels:
About vulnerabilities status:
- discovered: vulnerabilities that are detected but the IPS is not enabled on the host
- detect: vulnerabilities with IPS enabled but configured on detect mode
- prevent: vulnerabilities with IPS enabled and configured on prevent mode
- python: python 2.7 (required)
- prometheus: v2.16 (tested with this version)
- grafana: 6.6.2 (tested with this version)
virtualenv venv
source venv/bin/activate
pip install -r requirements.txt
pipenv --two
pipenv shell
pip install -r requiriments.txtYou should configure a config.py (renaming config_sample.py to config.py with your configuration), or using environment variables, to configure:
| Variable | Description | Value | Value Type |
|---|---|---|---|
| DS_HOST | DSM Hostname | ip | fqdn |
| DS_PORT | DSM TCP Port | port Number | string |
| DS_USER | User Account (read only) | user_name - base64 encoded | string |
| DS_PASS | User Password | user_pass - base64 encoded | string |
| DS_VERIFY_SSL | SSL Verify | True | False |
| DS_API_CHECK | Cache API data | time in minutes | integer |
| SERVER_PORT | Prometheus Collector TCP Port | port number | integer |
| LOG_LEVEL | Log level | INFO | WARN |
To encode your credentials:
echo -ne '<ds_user>'|base64
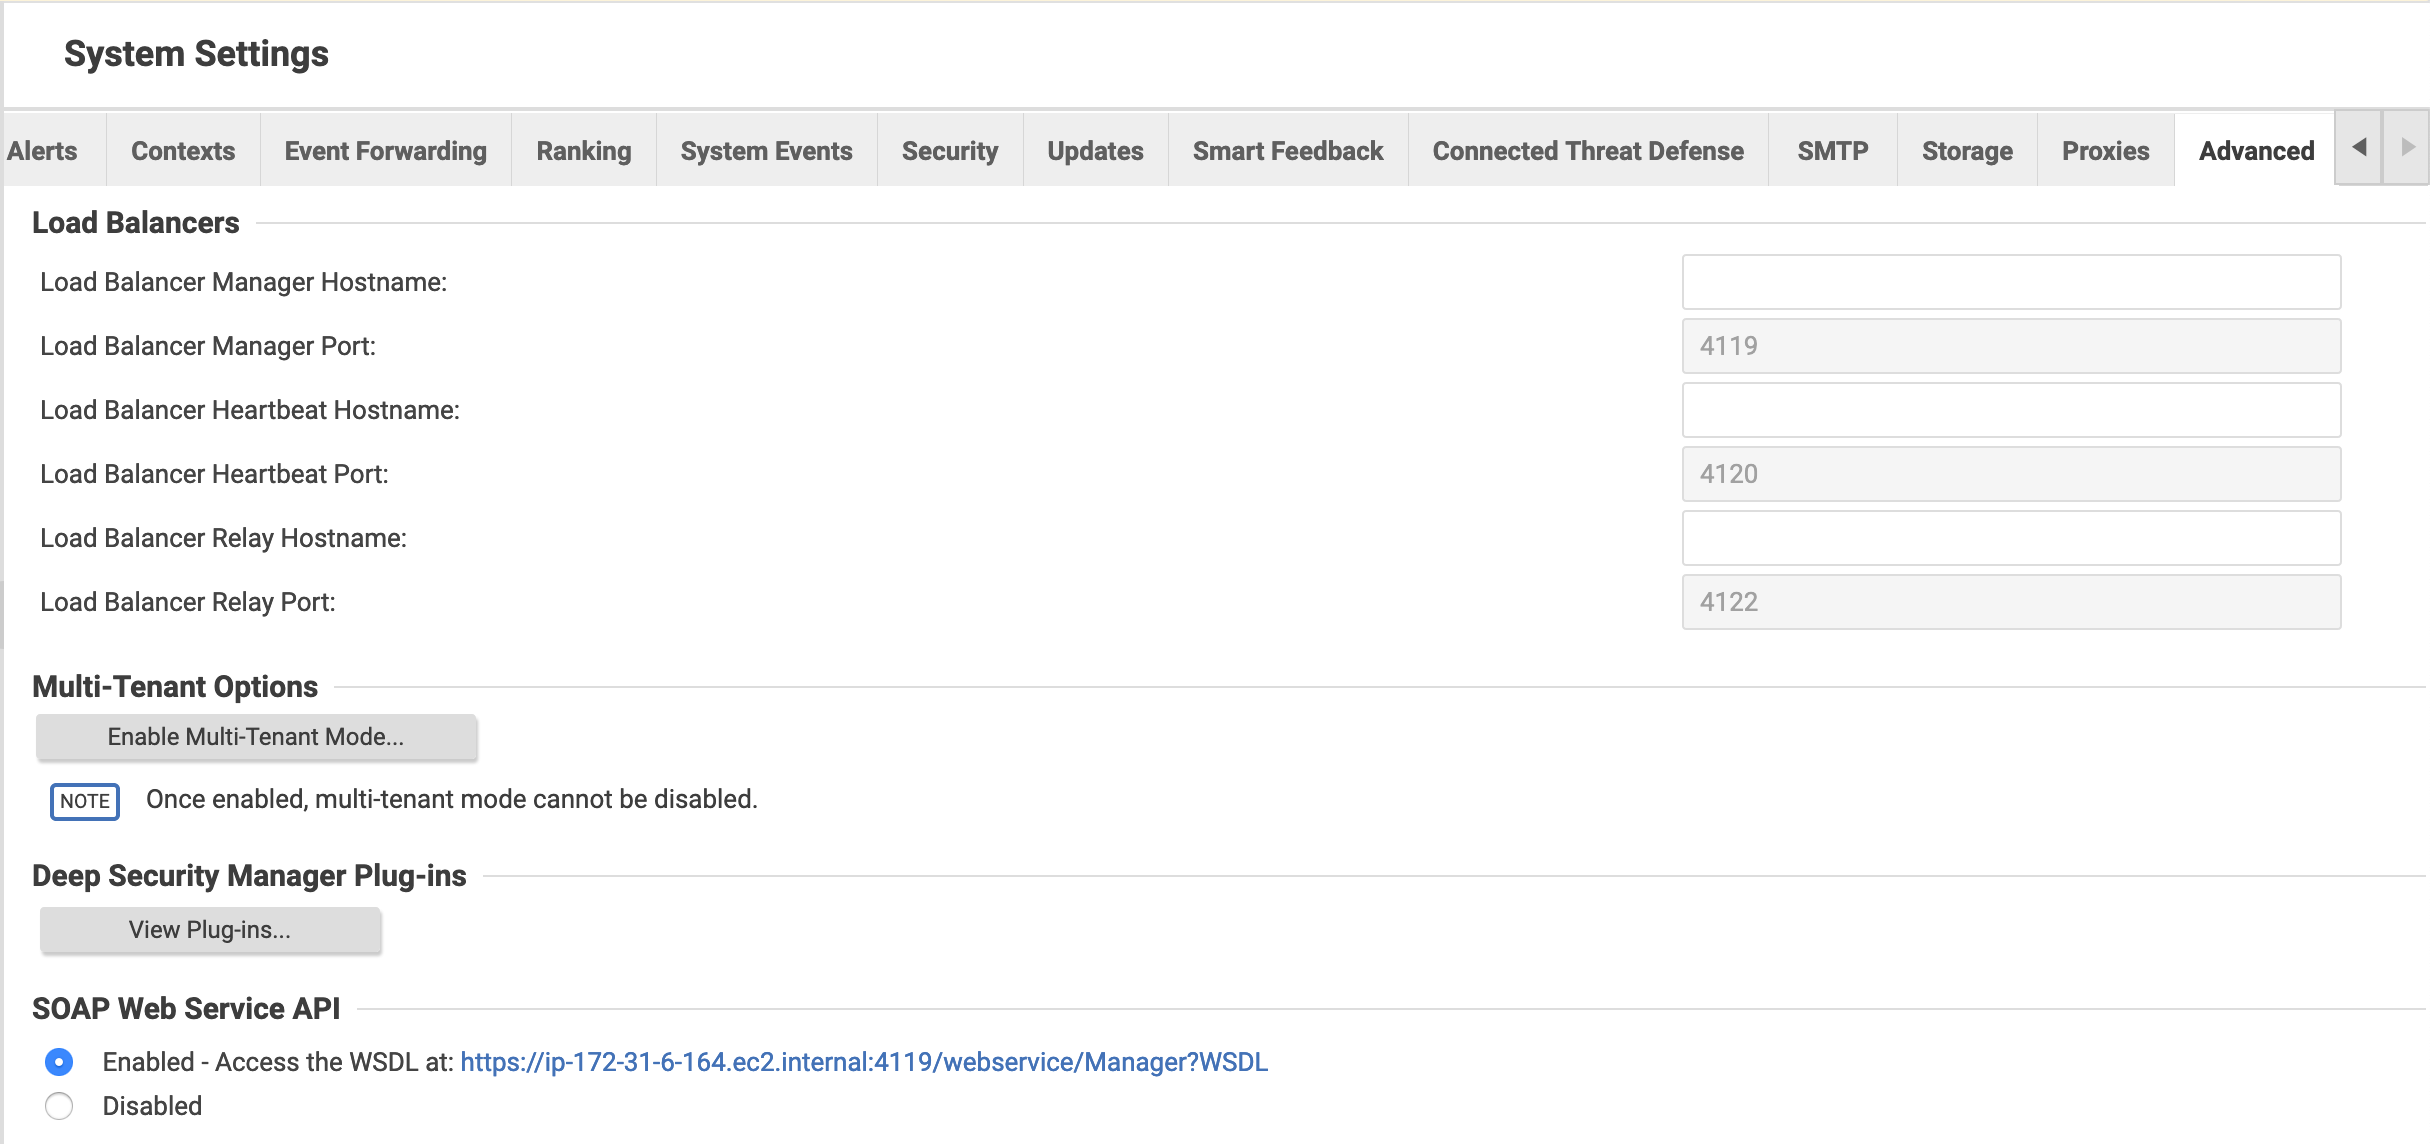
echo -ne '<ds_pass>'|base64We need to enable SOAP Web API on the DSM. To do it, you should to to:
- Administration tab
-
- System settings* pane
- SOAP Web Service API option - check 'enable' radio button
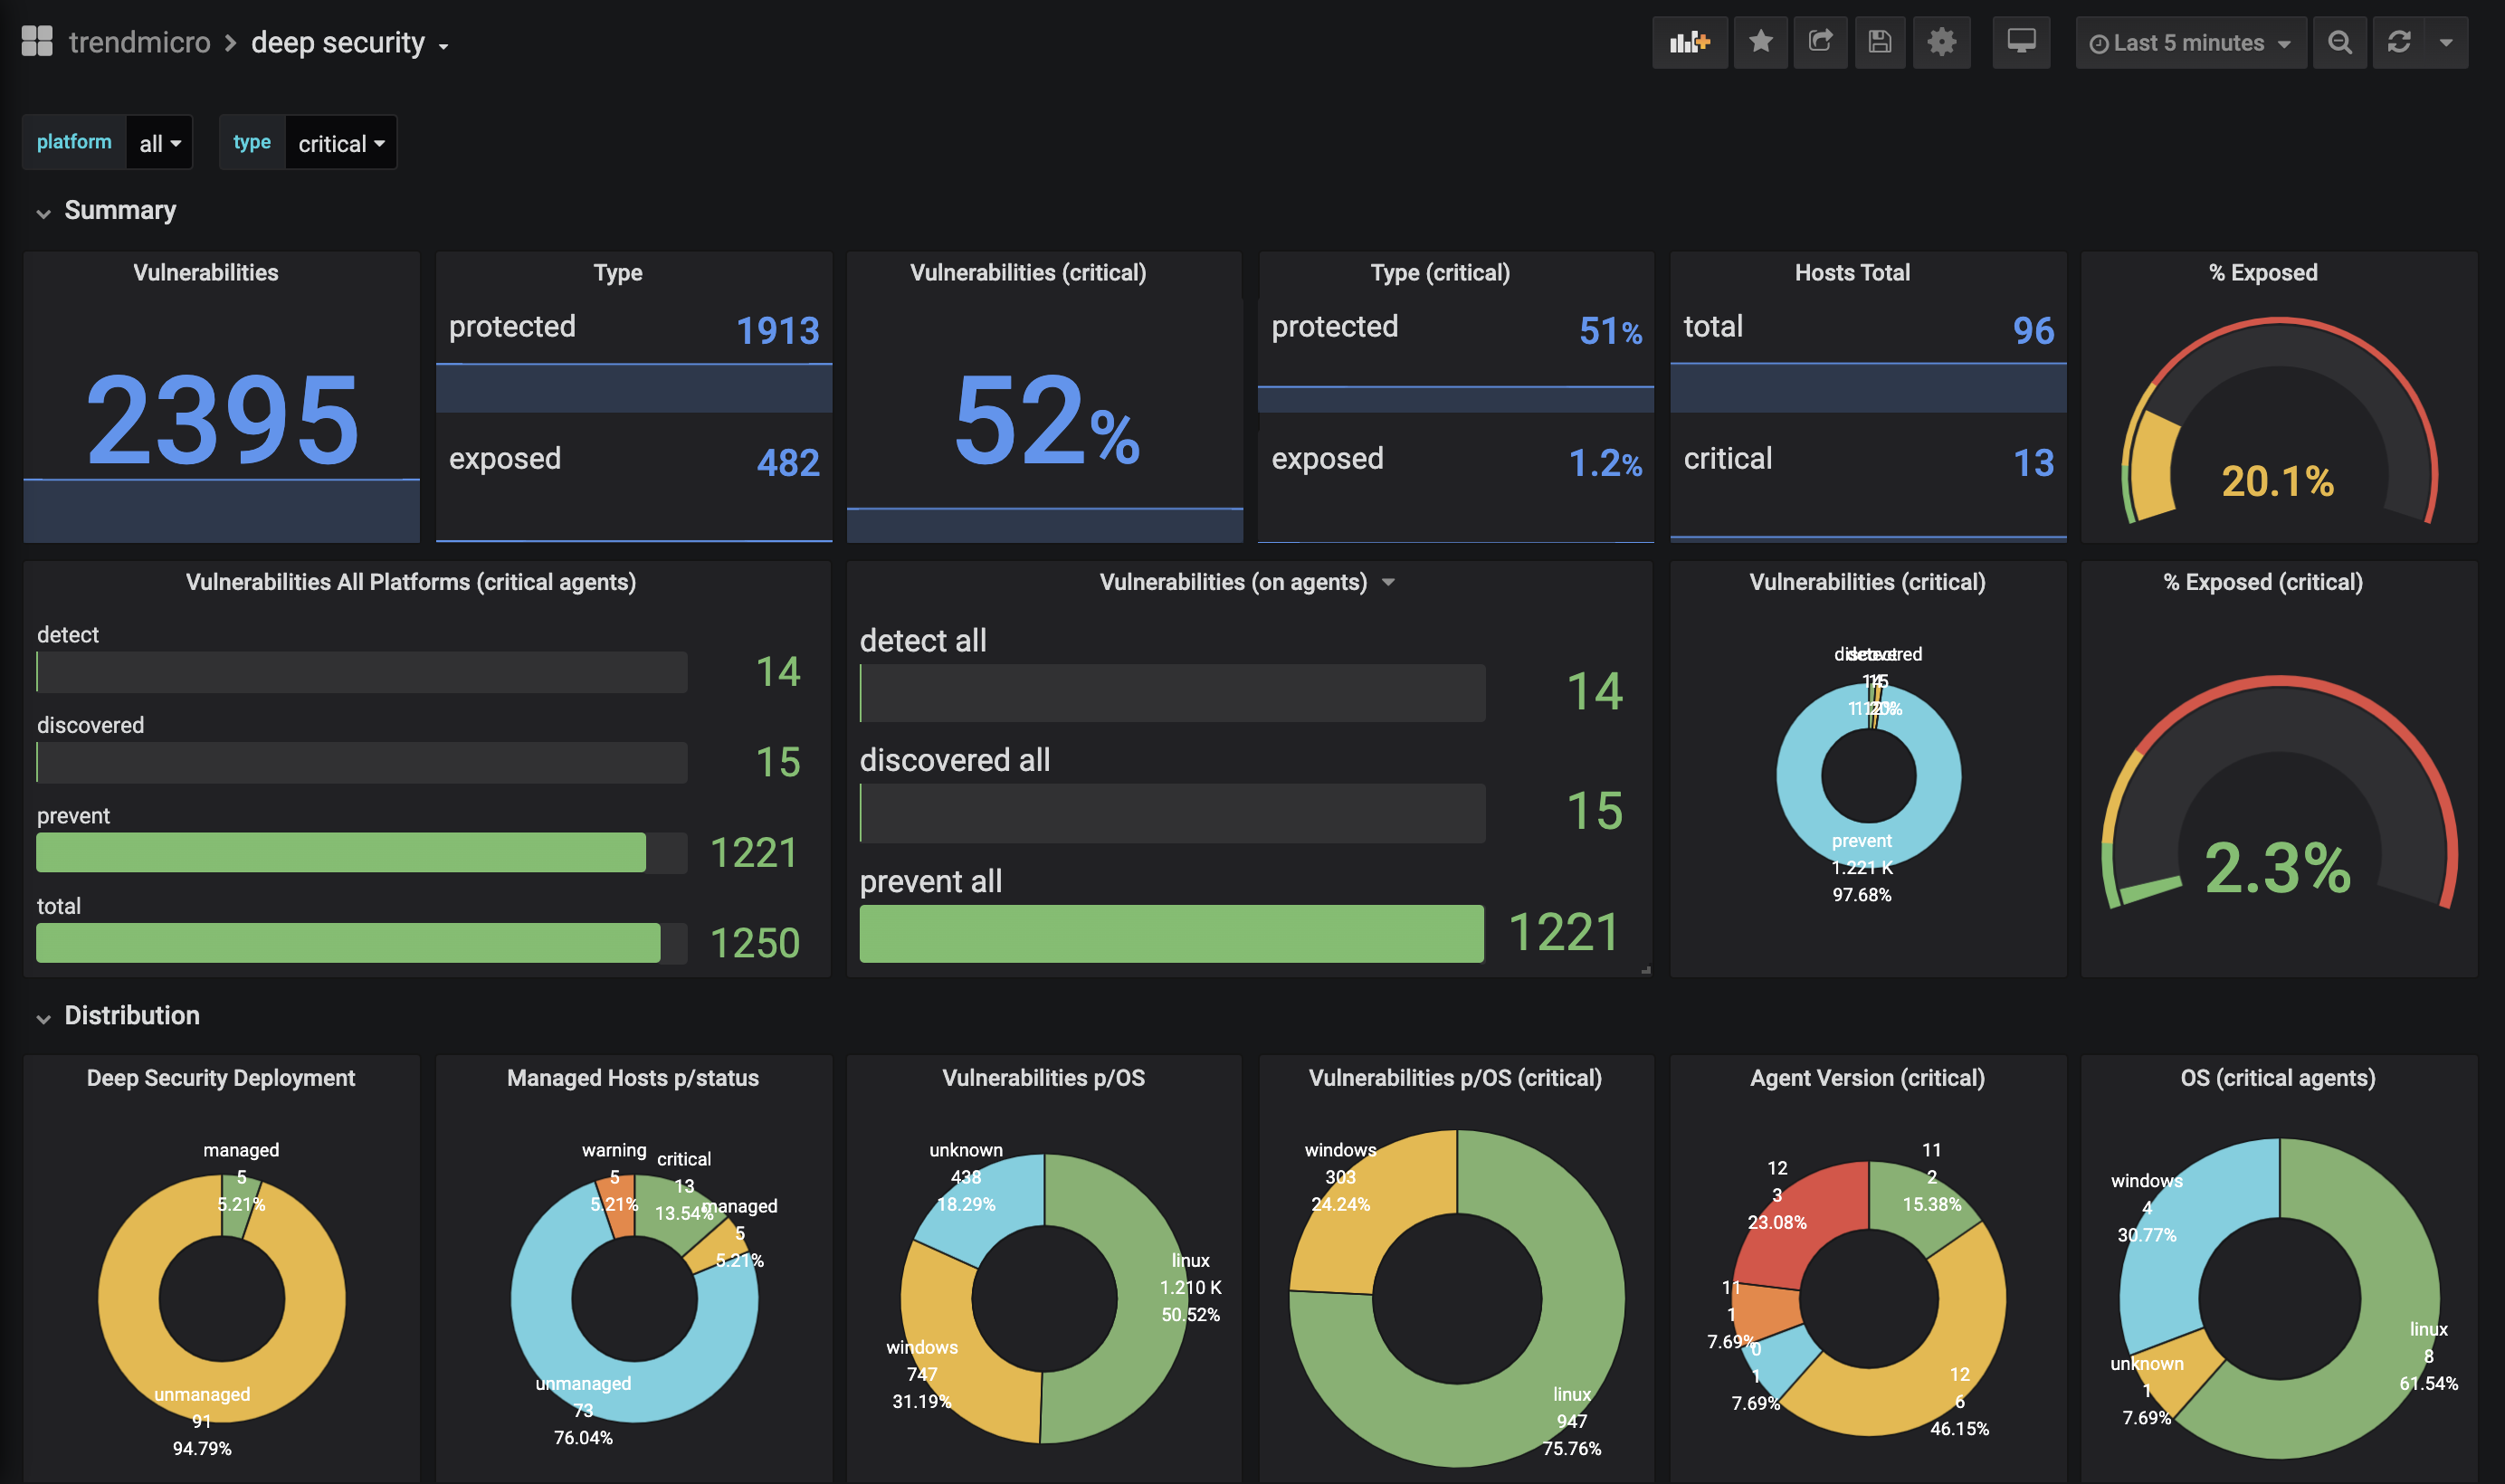
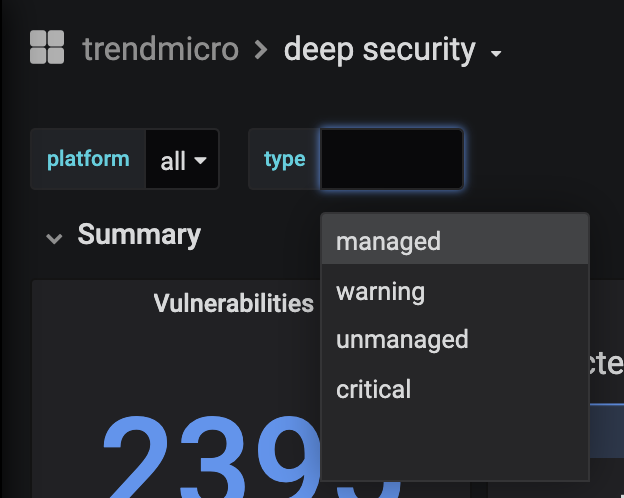
Import the dashboard located on: grafana/dash.json
- dashboard:
- filtering by type:
I've included inside this project the last version of the SDK for DS 9 to 11 versions. The code was developed by @marknca and is available here: https://github.com/deep-security/deep-security-py/.
I've based the collector structure on this example https://github.com/jakirpatel/prometheus-custom-collector/blob/master/code/collector.py developed by @jakirpatel.
This project is not part of any Trend Micro Deep Security project and it is not supported by Trend Micro.
Use and adapt to your needs and PRs are welcomed.


