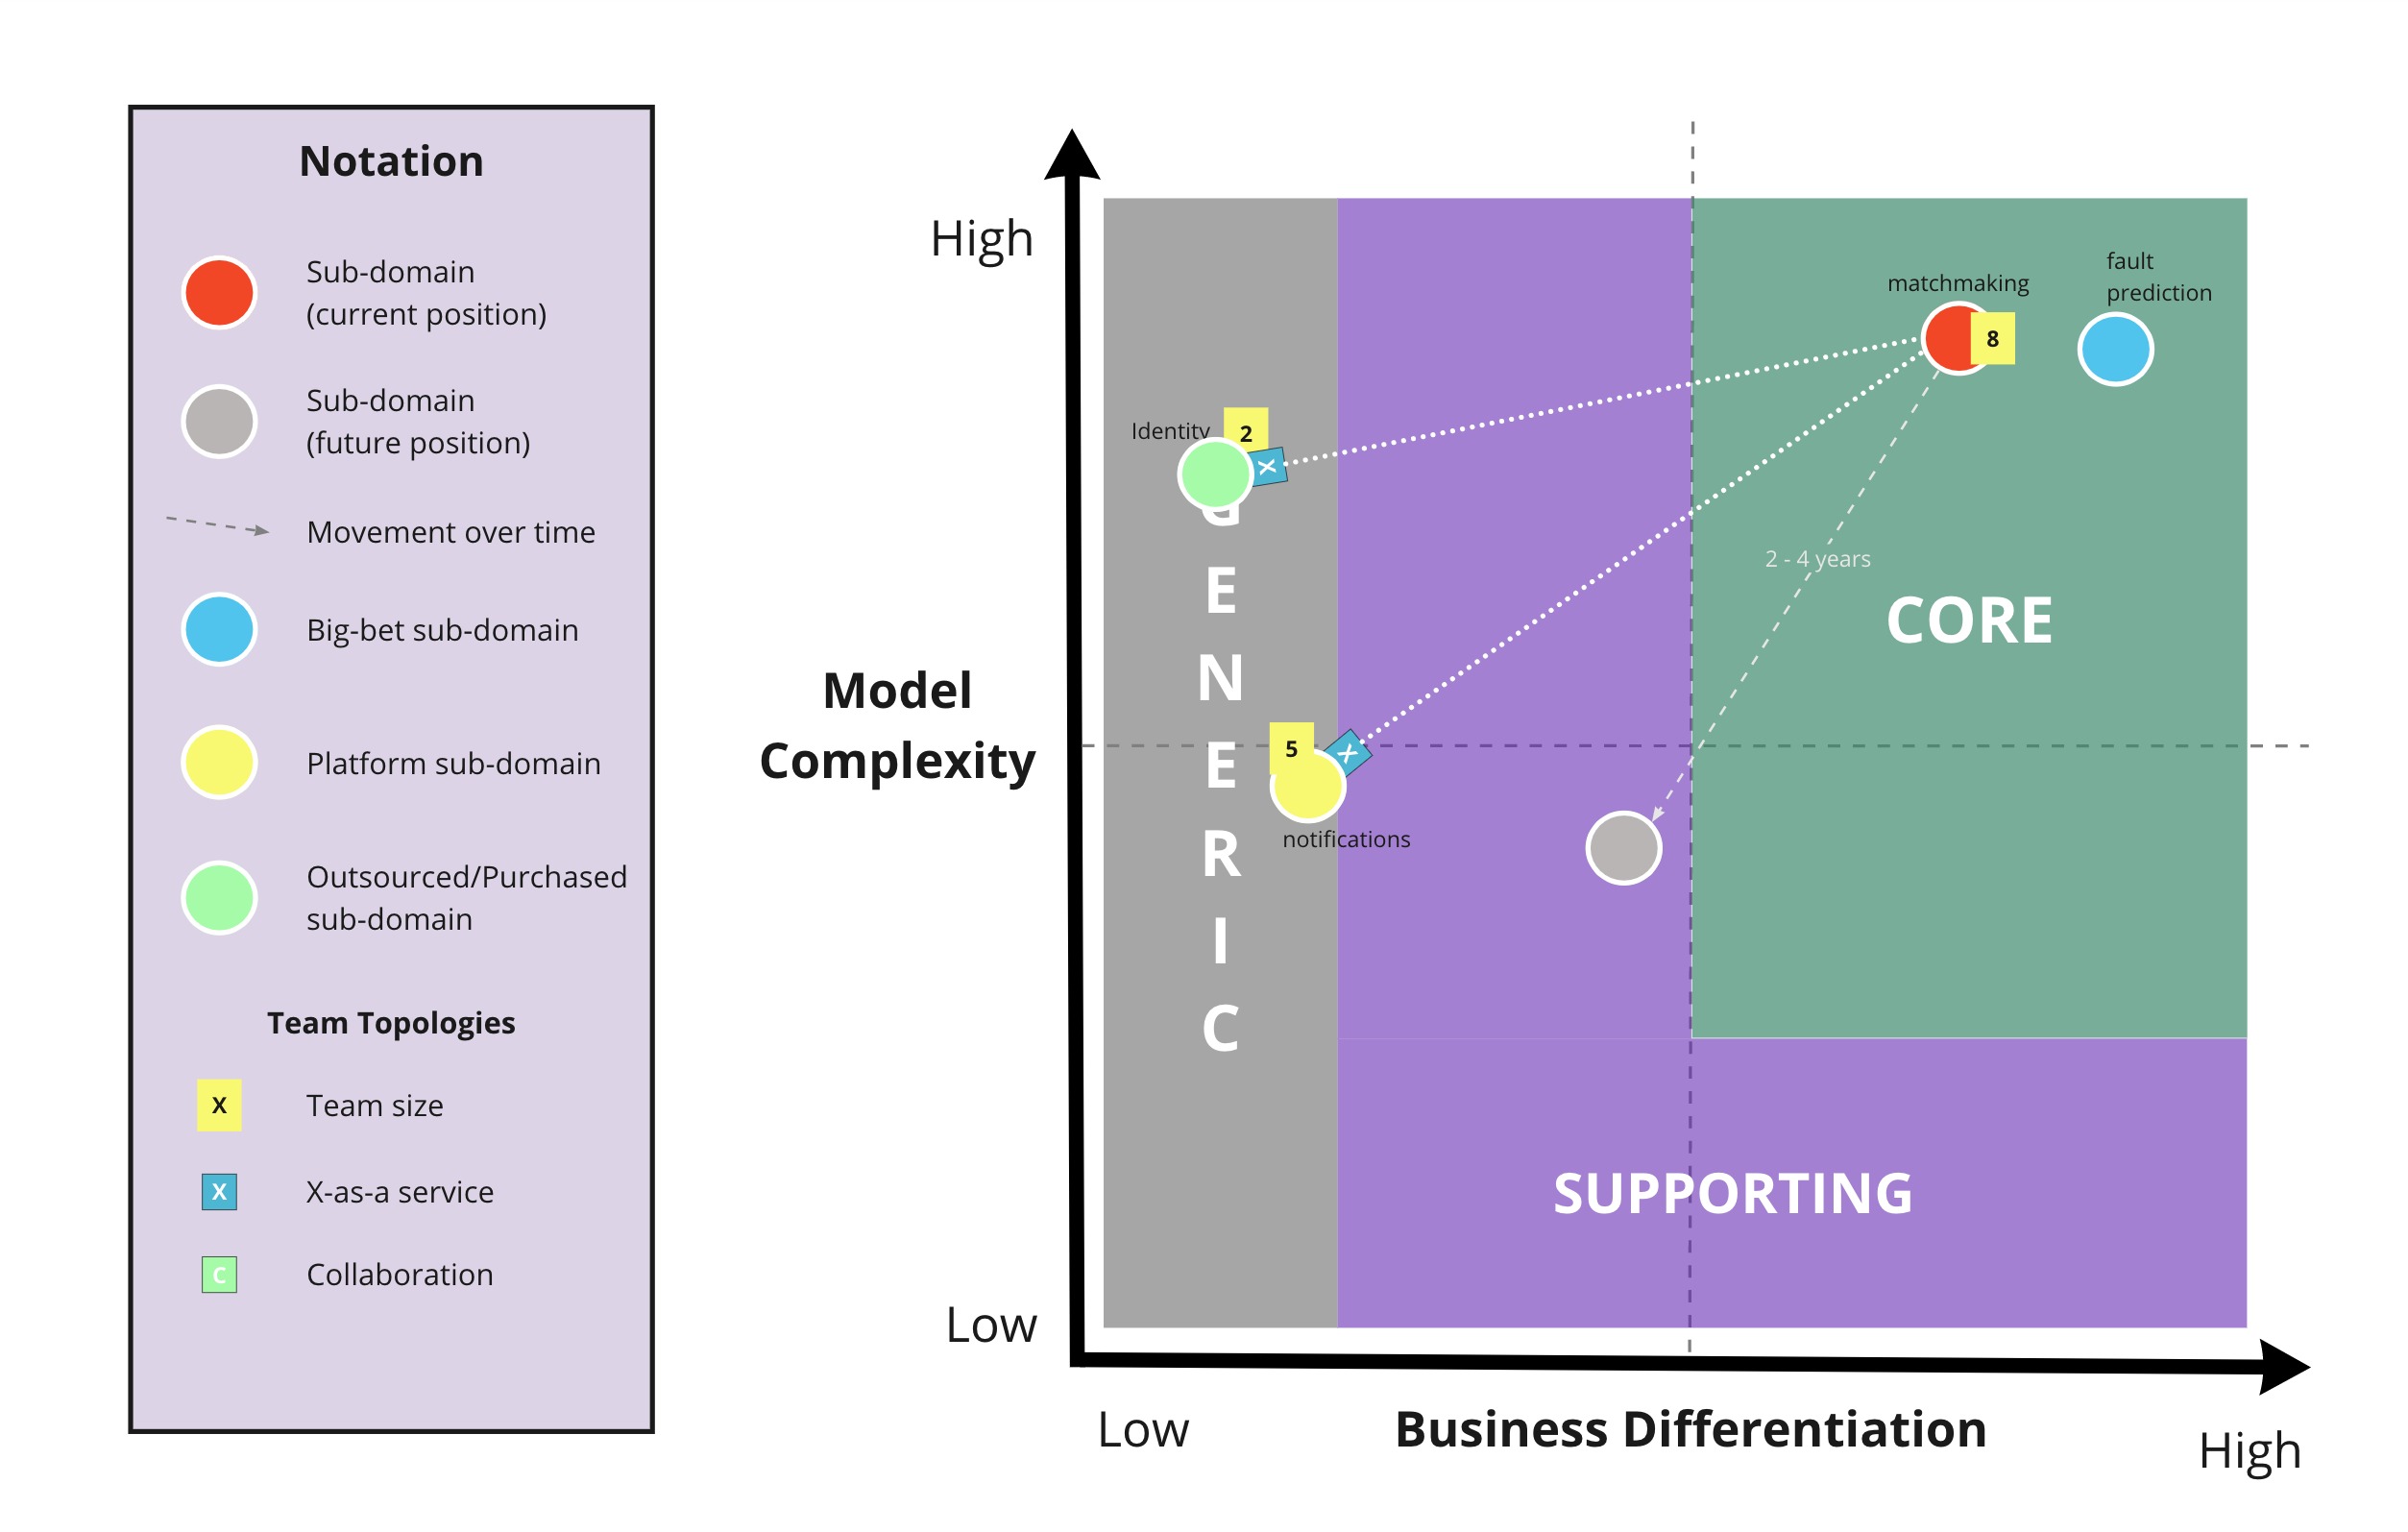
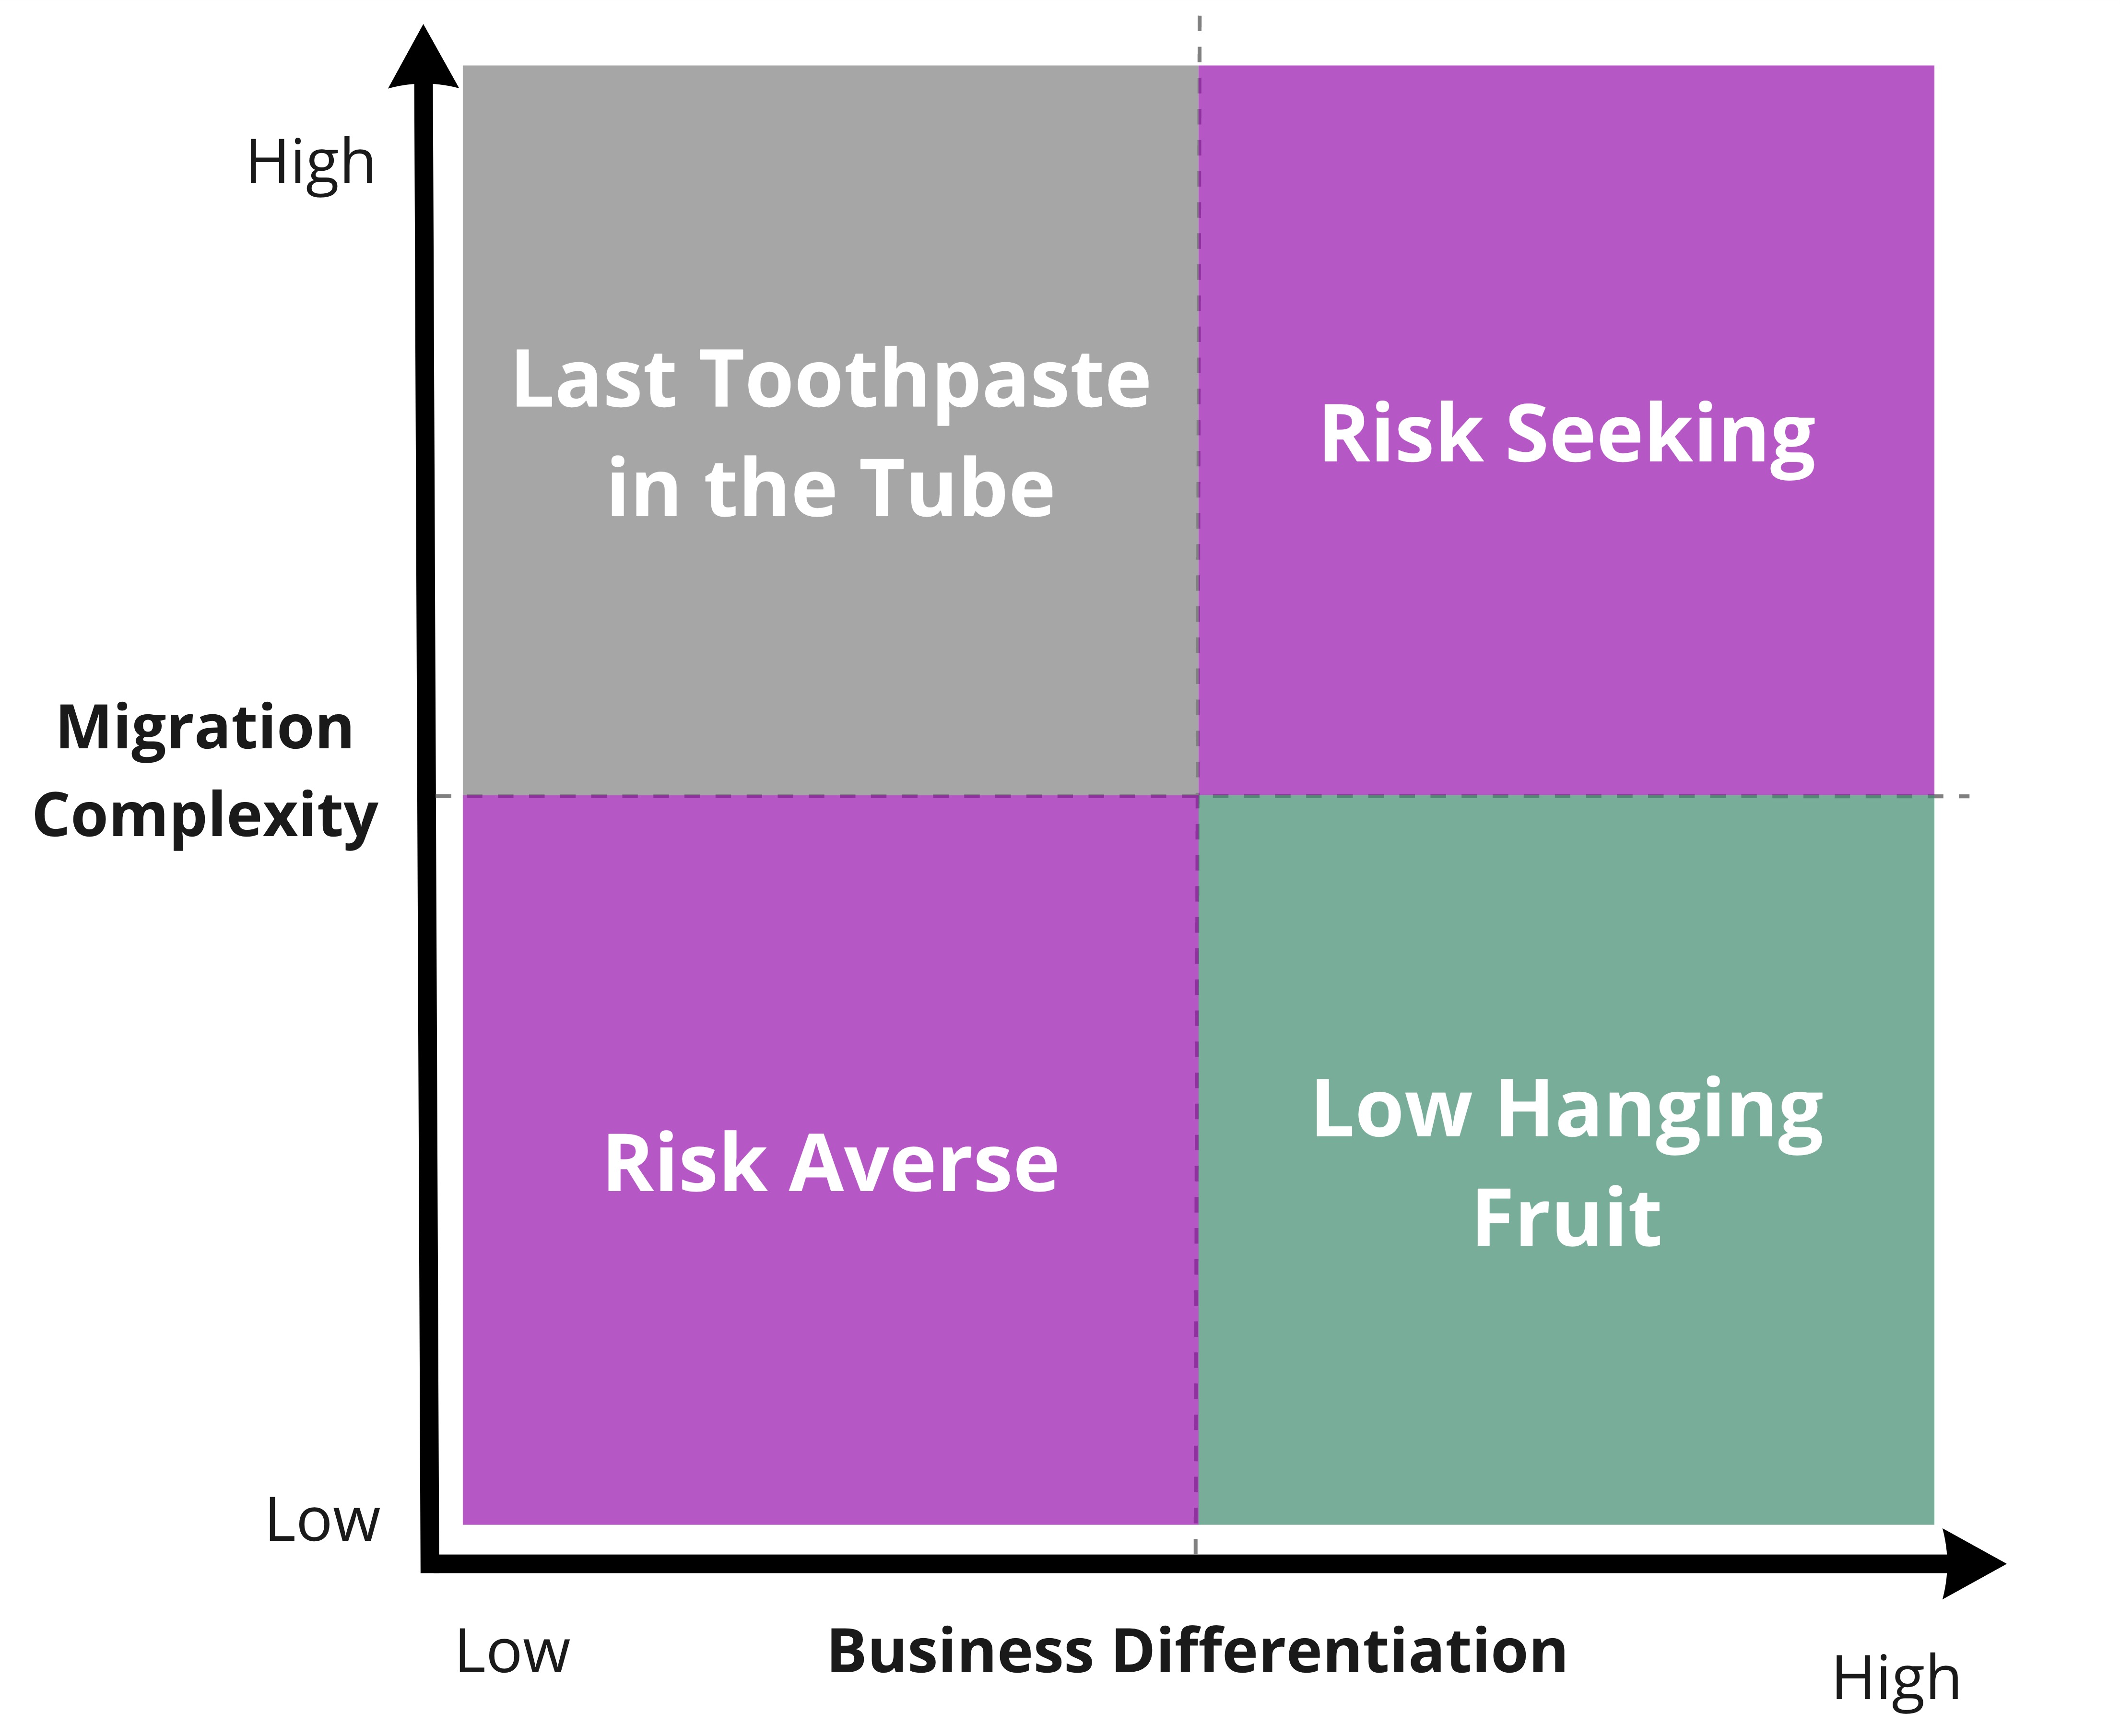
Core Domain Charts help you to visualise the strategic importance of each (sub)domain or business capability in your architecture allowing you to make business model-aligned architectural decisions.
Core Domains are the parts of your domain where the expected ROI is greatest, and deserve the highest focus.
The true power of this technique is the conversations that it triggers, especially cross-discipline. Complexity is something that engineers can gauge whereas business differentiation is provided by product managers or business stakeholders.
There are a variety of ways the Core Domain Chart can be used, but it's important not to try to and visualise all the possible information in a single diagram. Below are multiple versions showing different types of information to choose from.
This is the simplest flavour. Simply plot each of your (sub)domains or bounded contexts on the chart to get a relative sense of ordering between them.
You can augment your Core Domain Charts with the dependencies between your bounded contexts and the type of Team Topologies Interaction Mode in play.
With a slight tweak of the y-axis label, core domain charts can be used to plan the order in which you migrate from your current architecture to your target architecture.
Firstly, measuring complexity and differentiation of your domains is hard and is usually quite subjective. Strategy is a bet on the future, so you can never be sure exactly how complex or differentiating something will turn out to be. But there is still a lot of value in discussing and visualising your beliefs of the complexity and differentiation of each domain.
The following clues can help to assess the complexity and differentiation of each domain.
- How difficult is it to design a conceptual model for the domain and build (and maintain) it as software? (essential domain complexity)
- Is the current technical solution more complex than it needs to be to provide the current functionality? (accidental technical complexity)
- Are there complex processes, calculations, and decisions happening outside the software? (operational complexity)
- How hard would it be for a new entrant to the market to match or exceed the capability?
- How hard would it be for an existing competitor to match or exceed the capability?
- How much of an advantage is currently derived from the (sub)domain (revenue, brand, engagement)?
- How much of an advantage could potentially be derived from the (sub)domain (revenue, brand, engagement)?
- What damage would occur to the brand if major or recurring failures happened in the domain?
- Which cynefin domain does it fall within?
Complexity can manifest in different forms. Here are some clues for uncovering the essential domain complexity, accidental technical complexity, and operational complexity of each (sub)domain:
- How difficult is discovering potential new value?
- How difficult is designing the rules, logic, and workflows that create value?
- What level of scale does the system need to operate at? (even if rules are simpler, scale can add lots of complexity)
- Are very high levels of differentiation/complexity needed to displace existing market leaders or in saturated markets?
- Is specialist expertise/talent required (to discover and/or deliver value) that is difficult and expensive to acquire?
- How long does it take for a newcomer to ramp up and be efficient?
Check out the Examples to get a better understanding of these charts.
Please feel free to create a pull request with your own examples.
-
Visualising Sociotechnical Architecture with DDD and Team Topologies
-
An alternative and complementary tool to assess process complexity is Bernd Rücker's Process Automation Map
Thanks to all existing and future contributors and to Eduardo da Silva who has contributed to the Core Domain Chart:
The Core Domain Chart was inspired heavily by:
The Core Domain Chart is freely available for you to use. In addition, your feedback and ideas are welcome to improve it or to create new versions.
If you have questions you can ping us or open an Issue.
Feel free to also send us a pull request with your examples.
This work is licensed under a Creative Commons Attribution 4.0 International License.


