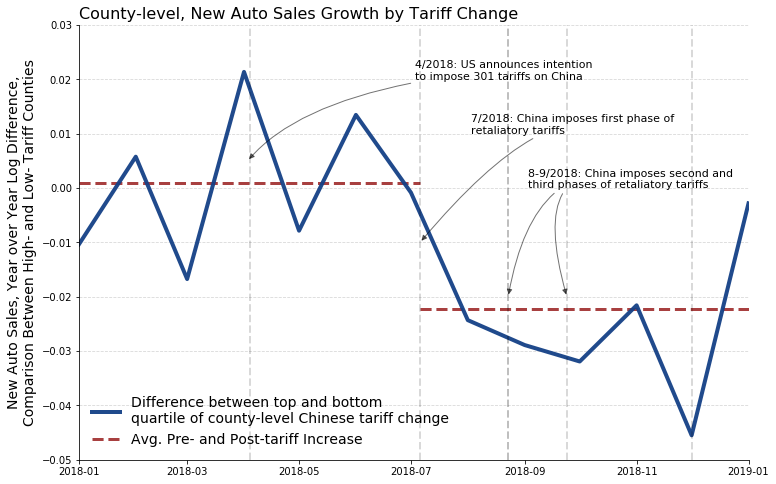
This repository contains code to reproduce aspects of the paper "The Consumption Response to Trade Shocks: Evidence from the US-China Trade War." Only results associated with non-proprietary data are available, i.e. Chinese retaliatory tariffs and it's projection to the county level and then their correlation with trade and employment. The auto analysis notebook is not included here as the data used is proprietary.
There are several files associated with this repository. Almost all of the notebooks directly pull data from the original source (trade data using the Census International Trade API, concordance from the US Census, employment data from the BLS, shapefiles from the US Census). After running the files, most of the output is saved as a .parquet files and stored in the data folder.
Below is a description of each jupyter notebook in the repository. If you don't know what a "jupyter notebook" is or what to do with them, this website is a great place to start: https://datascience.quantecon.org/.
The files below are organized in the sequence for which they must be run if you do not have the intermediate files.
-
updated_tariff_data.ipynbwhich uses and shapes the tariff data from Bown, Jung, and Zhang. I'm hosting their datafile as I had problems with a direct link. -
alt_hs_naics_mapping.ipynbstarts from the Census concordance which provides a mapping from hs10 to naics codes and then creates a mapping from hs6 to naics. In thedatafolder there isalt_concordance.parquetwhich you can download and directly run to proceed to the next step below. -
countylevel_tariffs_and_exports.ipynbtakes the tariff data above and then projects down to the county level, in addition to merging it with US export data and US employment data (just for the year 2017). The projection method simply takes a employment weighted averages of tariffs at the NAICS 3 digit level. Waugh (2019) explains more in detail, in addition to the text in the notebook. -
tariff_map.ipynbusing the tariff data above, it creates a map of tariff exposure. It downloads the required shapefiles and then plots the change in a county's tariff at the county level. It assumes that you have a folder below the repository calledshapefilesand thencountyandstatefor which the code will download and unzip the shapefiles into that folder. -
bls_quarterly_county.ipynbgrabs the Quarterly Census of Employment and Wages files from the BLS and then creates employment measures at the county-level, monthly frequency. It is then merged with the trade data from above. Note there is a place where, depending on if commented, creates a dataset with goods producing employment or total private employment. -
employment_analysis.ipynbperforms the employment analysis in Section 5 and has the unweighted regression results as well. The analysis also mimics most aspects of the auto analysis in the paper (e.g., visualizations, tabular analysis, regression results). -
trade_analysis.ipynbperforms the trade analysis in Section 5 (us exports to china, exports in total) and it contains the unweighted regression results as well.
As of the last push, these notebooks will come very close, but not exactly replicate the values in the NBER working paper version due to my changing of code regarding how the concordance is treated. To reproduce the NBER version results, read the notes around code cell 15 in countylevel_tariffs_and_exports.ipynb and uncomment the appropriate parts.
Finally, I must highlight that there is a license regarding this work, it's use, and so forth.
political_aspects_of_retaliation.ipynbExplores the issue about where the tariffs were directed and how that correlates with the propensity of a county to vote for President Trump. Short answer is yes, but most the variation is about places that export the most to china. The interesting observation is that there is a strong correlation between those that exported a lot to china and the propensity to vote for President Trump.
