This repository contains both the backend ingestion server for Substrate Telemetry as well as the Frontend you typically see running at telemetry.polkadot.io.
The backend is a Rust project and the frontend is React/Typescript project.
To run the backend, you will need cargo to build the binary. We recommend using rustup.
To run the frontend make sure to grab the latest stable version of node and install dependencies before doing anything:
nvm install stable
yarncd backend
cargo build --release
./target/release/telemetry --help
By default, telemetry will listen on the local interface only (127.0.0.1) on port 8000. You may change both those values with the --listen flag as shown below:
telemetry --listen 0.0.0.0:8888
This example listen on all interfaces and on port :8888
cd frontend
yarn install
yarn startFollow up installation instructions from the Polkadot repo
polkadot --dev --telemetry-url ws://localhost:8000/submitObviously, the frontend need to be aware of the backend. In a similar way, your node will need to connect to the backend.
For the sake of brevity below, I will name the containers backend and frontend. In a complex environment, you will want to use names such as telemetry-backend for instance to avoid conflicts with other backend containers.
Let's start the backend first. We will be using the published 'chevdor' images here, feel free to replace with you own image.
docker run --rm -i --name backend -p 8000:8000 chevdor/substrate-telemetry-backend -l 0.0.0.0:8000
Let's now start the frontend:
docker run --rm -i --name frontend --link backend -p 80:80 -e SUBSTRATE_TELEMETRY_URL=ws://localhost:8000/feed chevdor/substrate-telemetry-frontend
WARNING: Do not forget the /feed part of the URL...
NOTE: Here we used SUBSTRATE_TELEMETRY_URL=ws://localhost:8000/feed. This will work if you test on your laptop but NOT if your backend runs on a remote server. Keep in mind that the frontend docker image is serving a static site running your browser. The SUBSTRATE_TELEMETRY_URL is the WebSocket url that your browser will use to reach the backend. Say your backend runs on a remore server at 192.168.0.100, you will need to set the IP/url accordingly.
At that point, you can already open your browser at http://localhost and see that telemetry is waiting for data.
Let's bring some data in with a node:
docker run --rm -i --name substrate --link backend -p 9944:9944 chevdor/substrate substrate --dev --telemetry-url 'ws://backend:8000/submit 0'
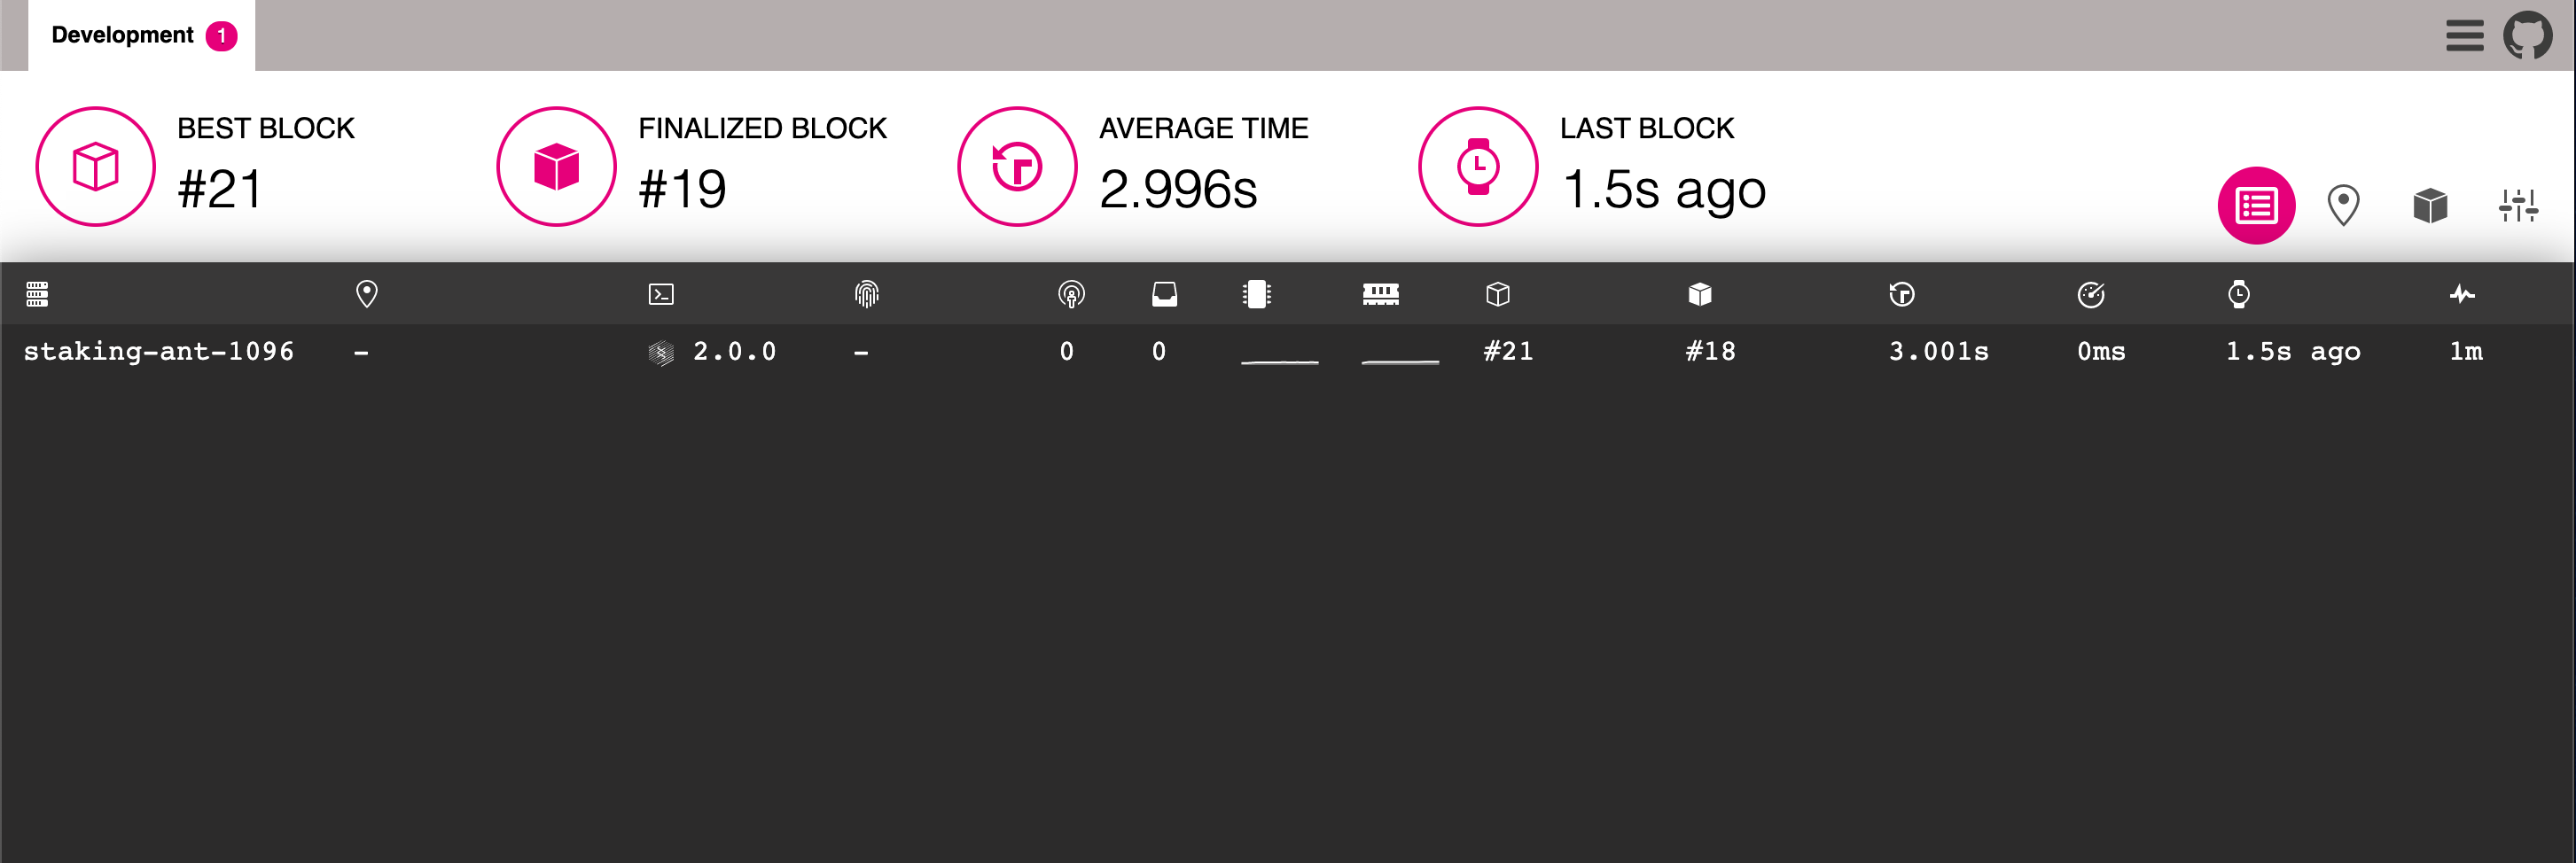
You should now see your noe showing up in the telemetry frontend:

To run via docker make sure that you have Docker Desktop. If you don't you can download for you OS here Docker Desktop
docker-compose up --build -d-dstands for detach, if you would like to see logs I recommend using Kitmatic or don't use the -d--buildwill build the images and rebuild, but this is not required every time- If you want to makes UI changes, there is no need to rebuild the image as the files are being copied in via volumes.
Now navigate to http://localhost:3000 in your browser to view the app.
The building process is standard. You just need to notice that the Dockerfile is in ./packages/frontend/ and tell docker about it. The context must remain the repository's root though.
DOCKER_USER=chevdor ./scripts/build-docker-frontend.sh