andrewmoles2 / DVS_state_of_industry

Data visualisation society challenge visualisations

Geek Repo:Geek Repo

Github PK Tool:Github PK Tool

Data Visualisation Society (DVS) visualisation challenge

Each year the DVS runs a visualisation challenge based on data they collected about what is currently happening in the industry; or at least those that use data visualisation for their work.

2023

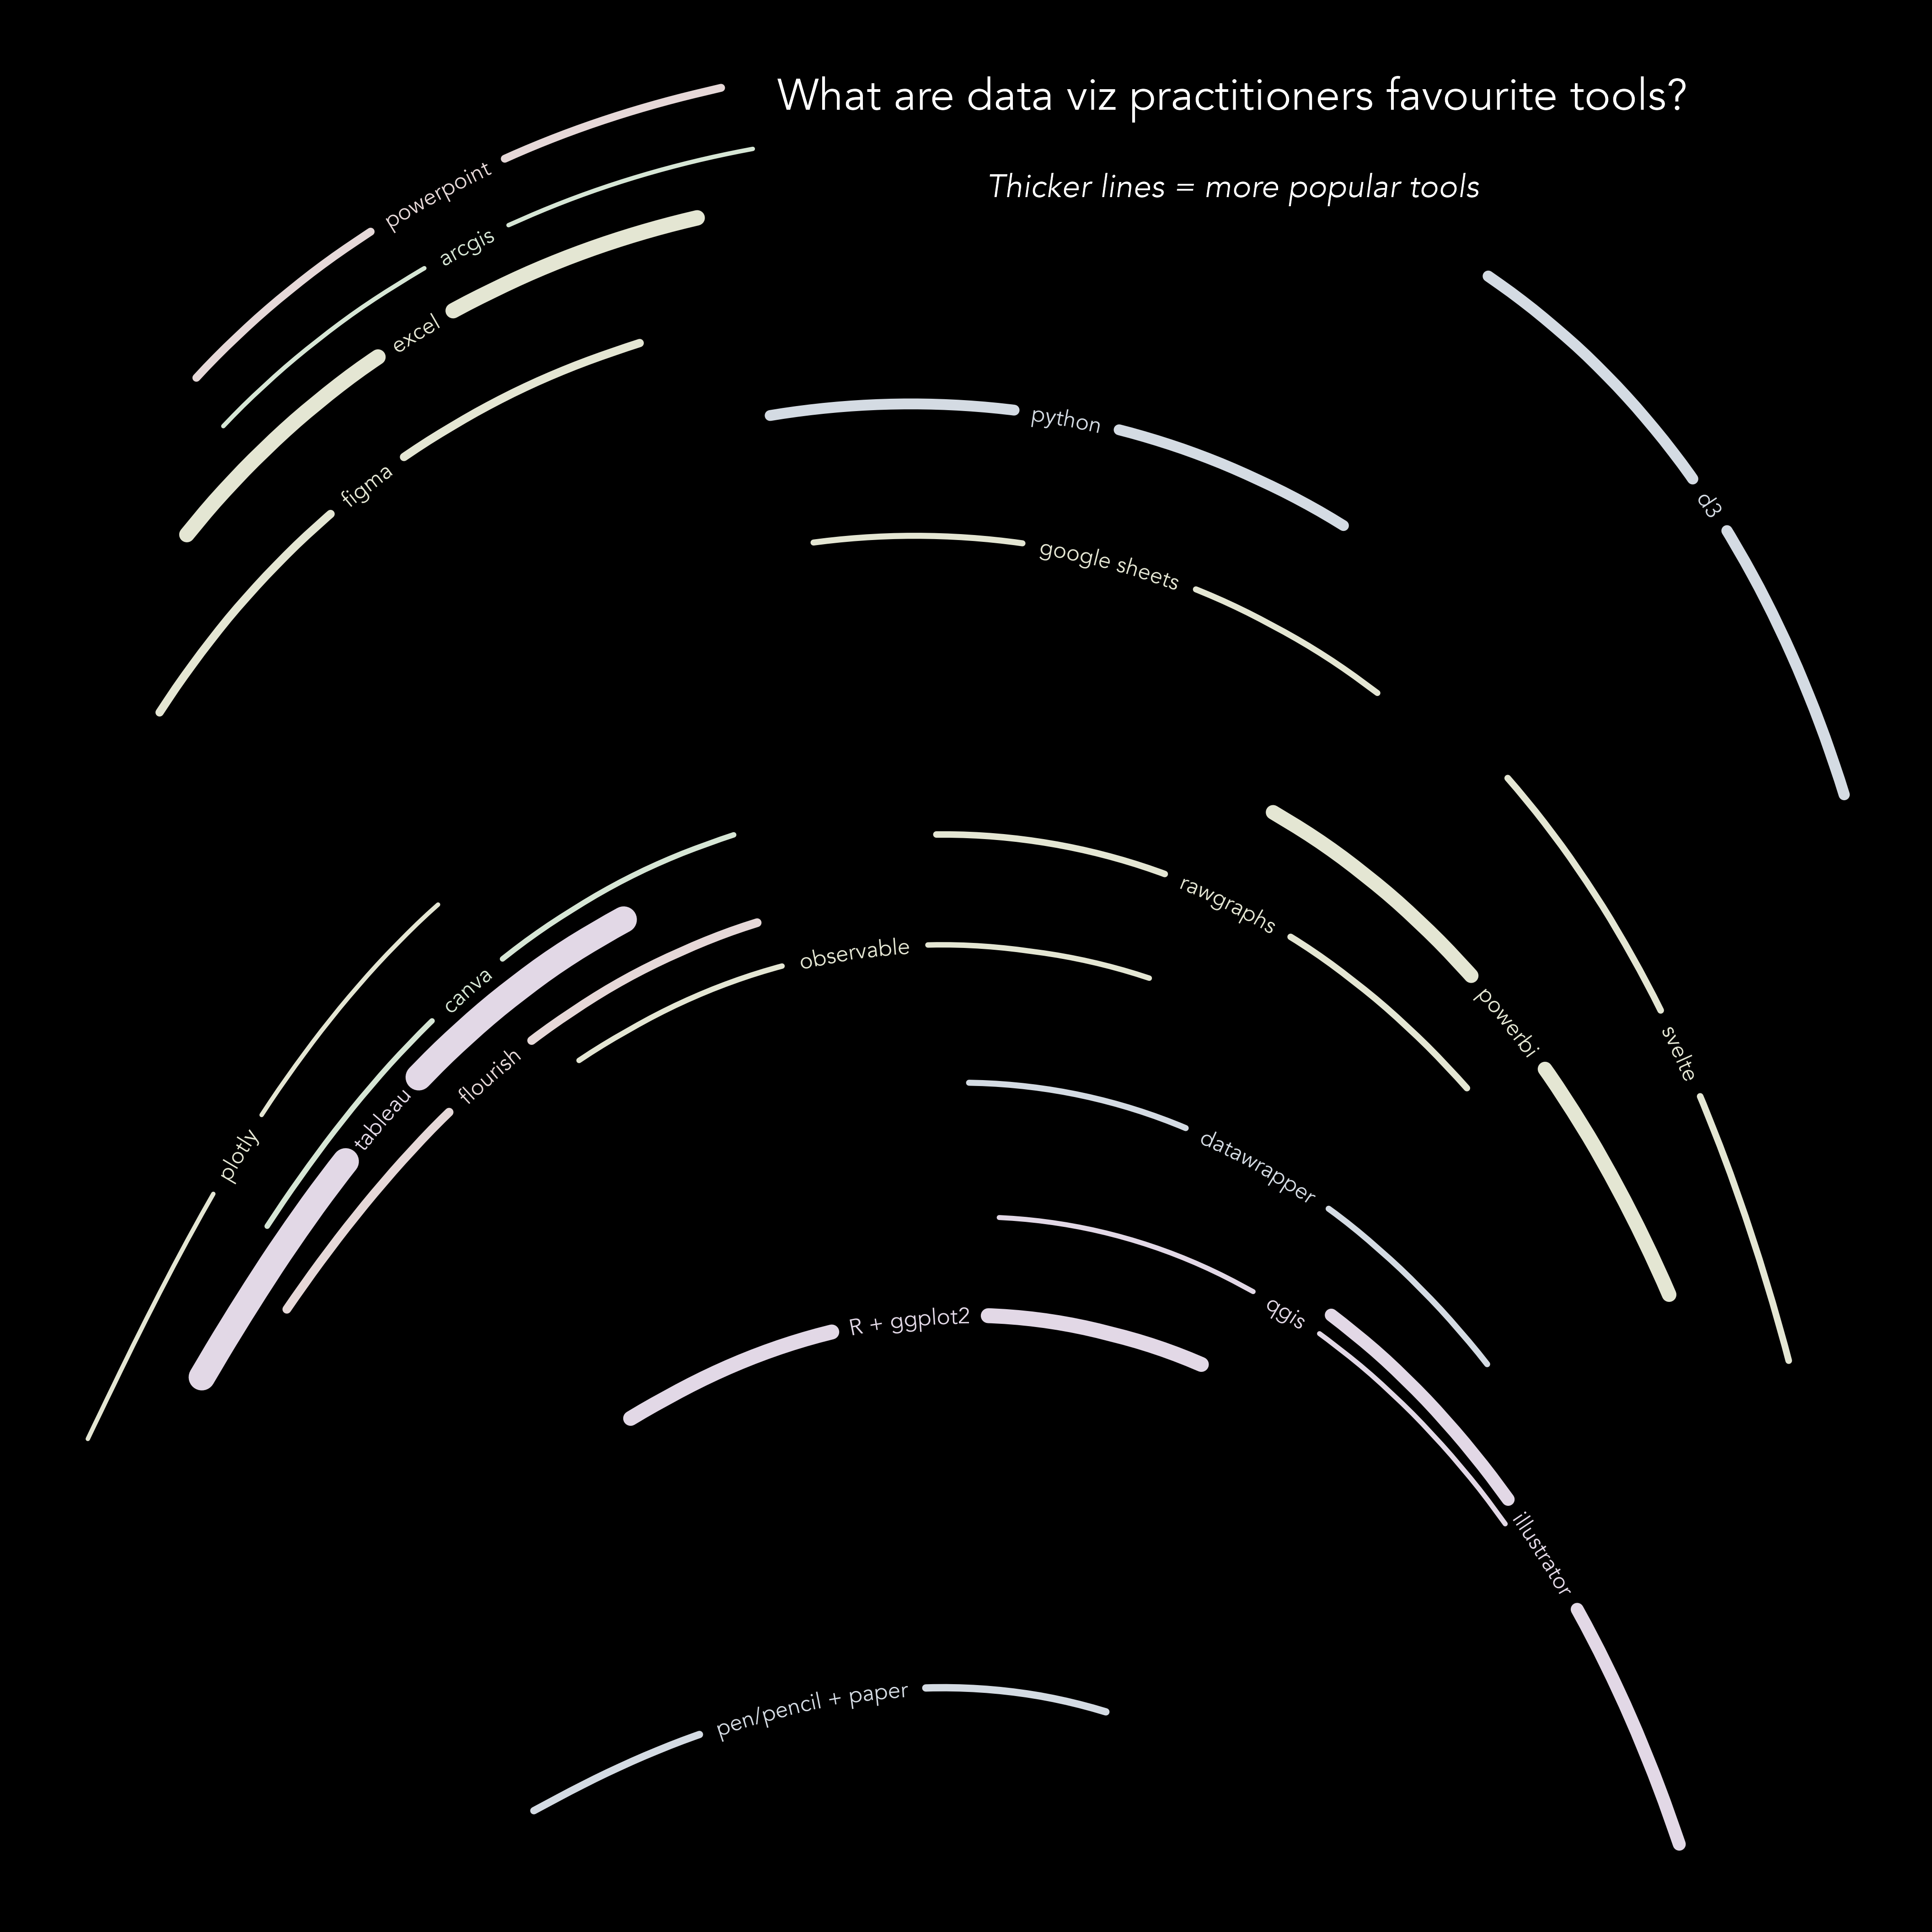
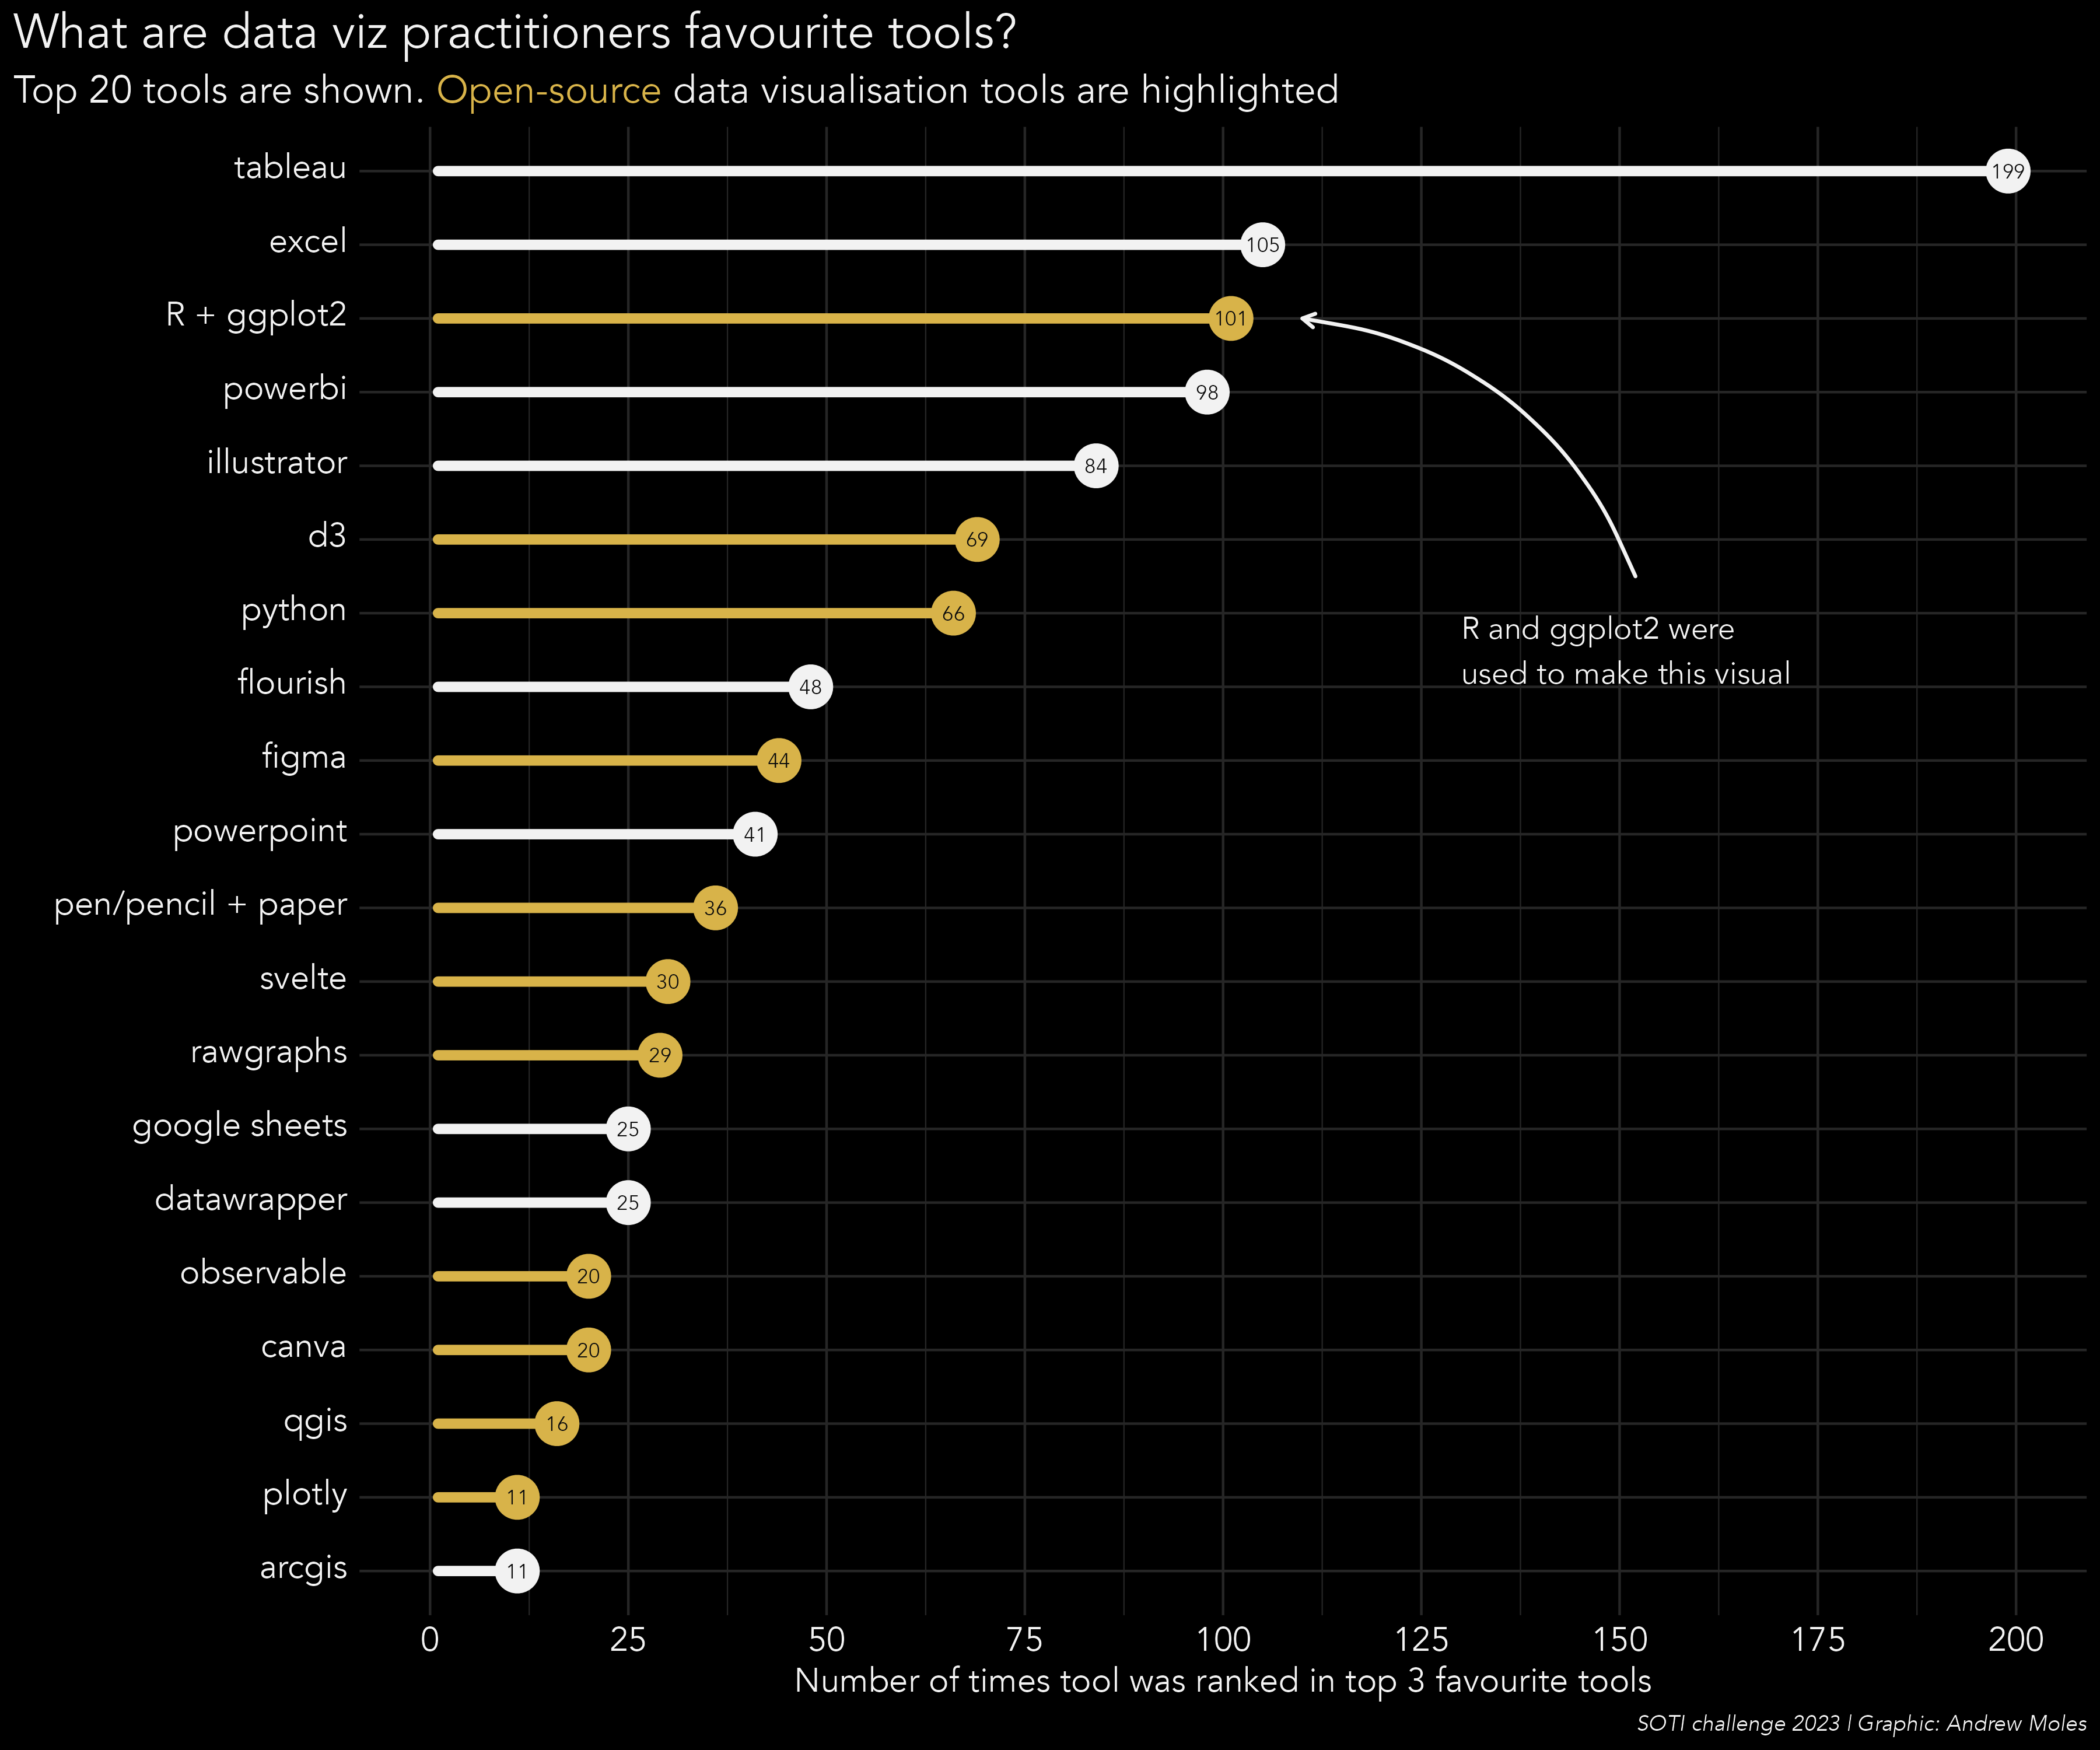
For the 2023 challenge I made an explanatory visual in two ways, functional and arty.

top 20 tools data viz people like best as lollipop chart

flow field visualisation of top 20 tools data viz people like best

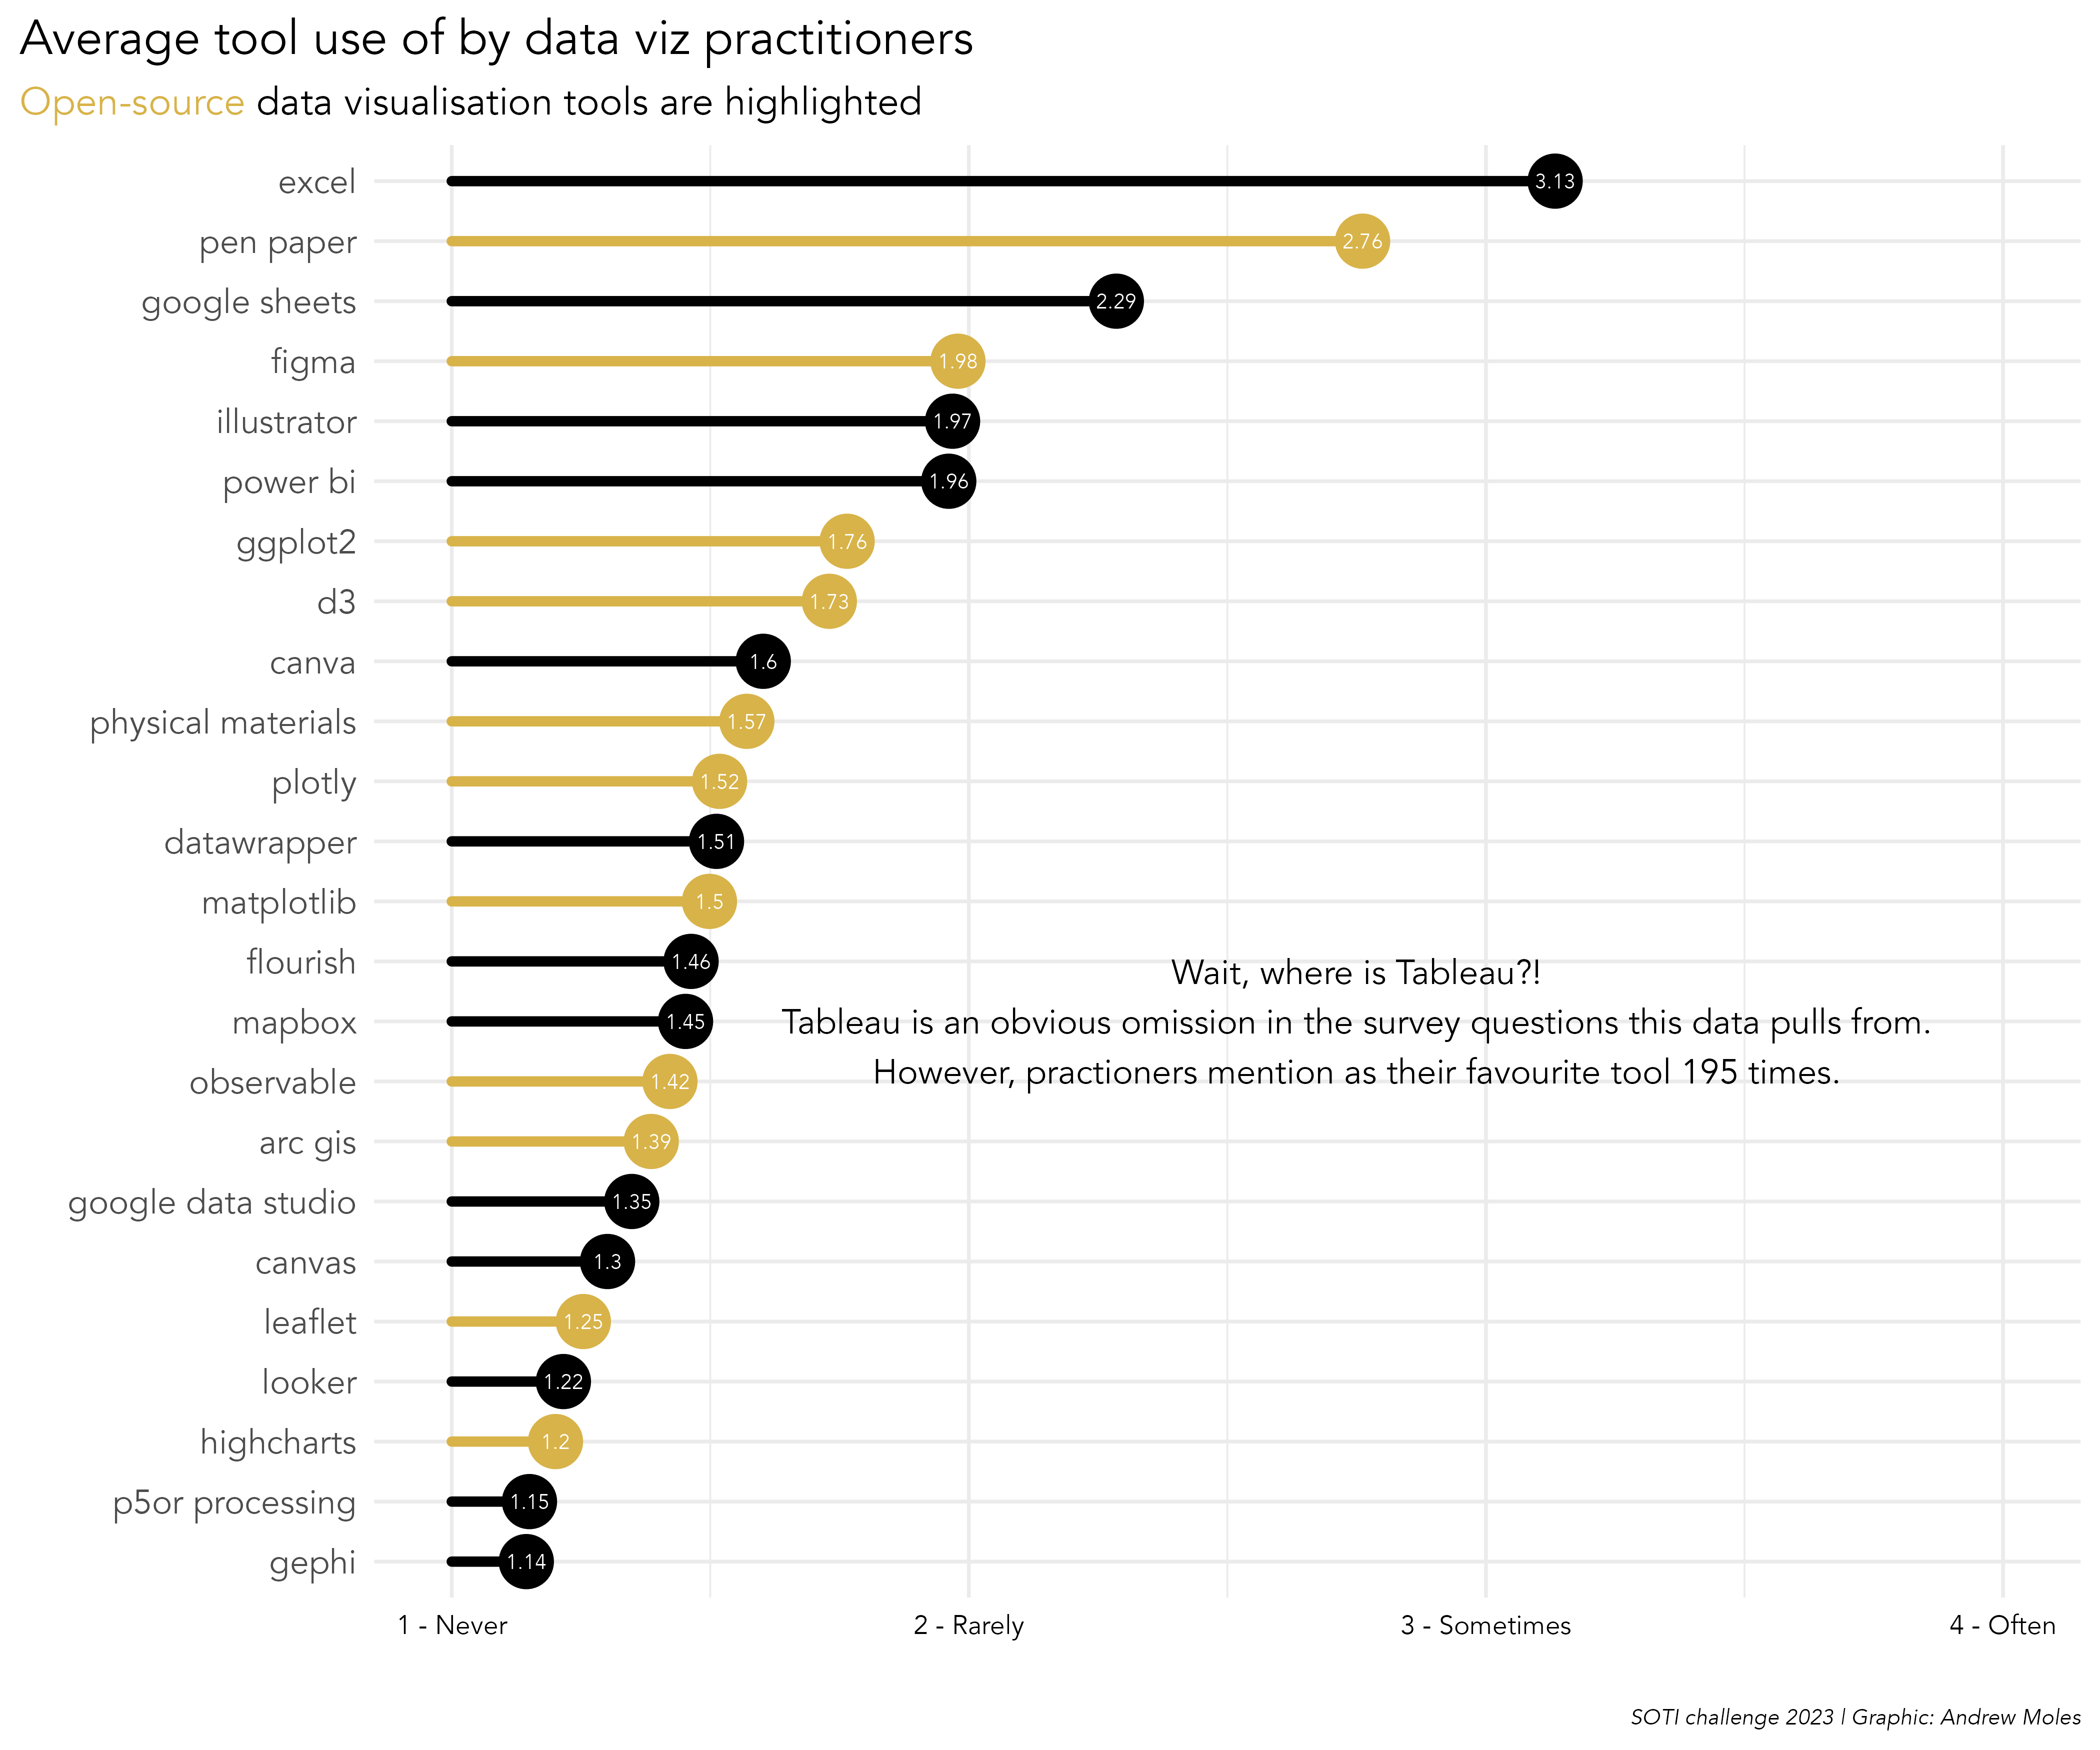
I also made some other visuals which I don't think are quite as interesting or useful.
About

Data visualisation society challenge visualisations


Languages

Language:R 100.0%