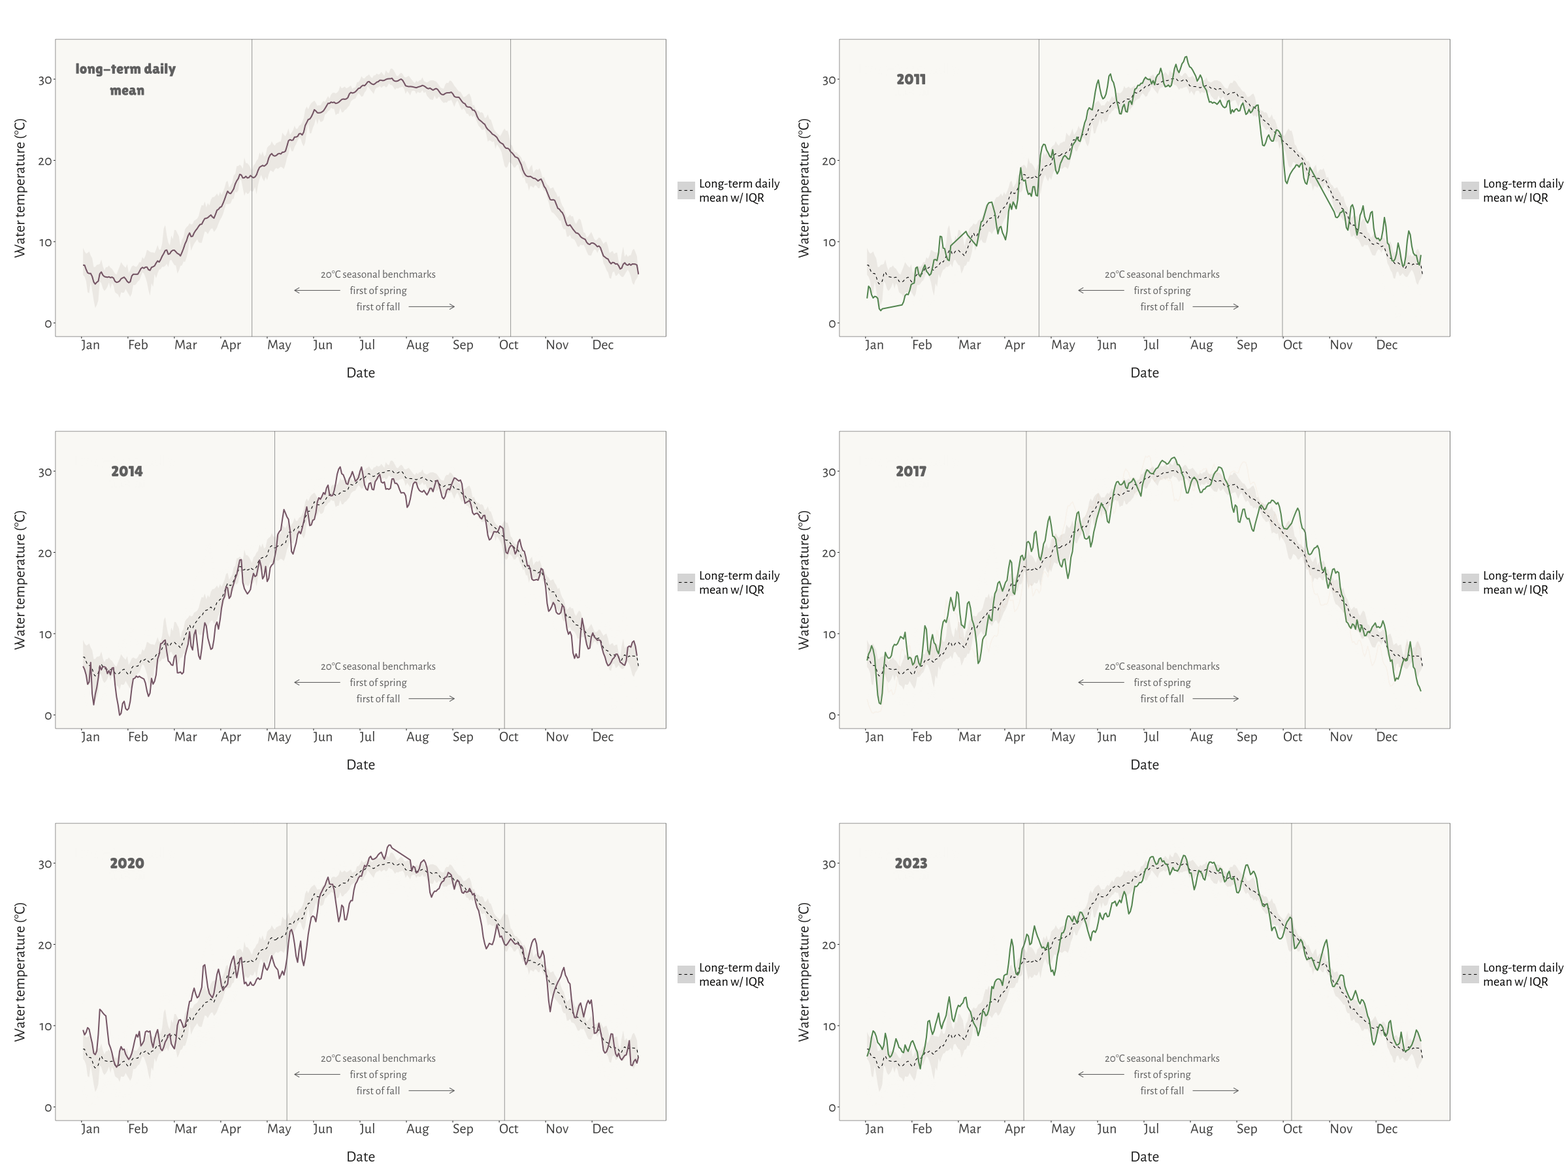
A project in which I combine 15 years of water quality monitoring data and generate daily mean summary statistics for select variables, as well as produce an animated plot depicting seasonal patterns and inter-annual variation in water temperature at VCU's Rice River Center monitoring station, located in the upper estuarine portion of the James River. This work was completed in collaboration with Dr. Paul Bukaveckas of VCU's Center for Environmental Studies.
variables examined
- Temperature (
TempC) - pH (
pH) - Specific Conductance (
SpCond_uScm) - Turbidity (
turb_NTU) - Chlorophyll a (
Chla) - Oxygen Dissolved Saturation (
ODOsat) - Oxygen Dissolved (mg/L) (
ODOmgl)
This repository contains the following files and folders:
| File/Folder Name | Description |
|---|---|
annual summaries/ |
folder with source data in the form of .xlsx files. Each xlsx contains 1 year of data across some number of tabs |
output_data/ |
folder with processed data files generated by RicePier_dailymeans_2009to23.Rmd |
.gitignore |
specifies intentionally untracked files to ignore |
RicePier_dailymeans_2009to23.Rmd |
R Markdown document calculating daily mean values from 2009 to 2023 |
benchmarkDOY_20C.csv |
dataset containing DOY on which estuary first reached 20C seasonal benchmarks |
animated_timeSeries.rmd |
R Markdown document for creating animated time series visualization |
jamesRiver-longterm-waterTemps.Rproj |
R Project file |
waterTemps_benchmarkLines.gif |
final animation file |
The following libraries are required:
tidyverseopenxlsxgganimategifskishowtext
