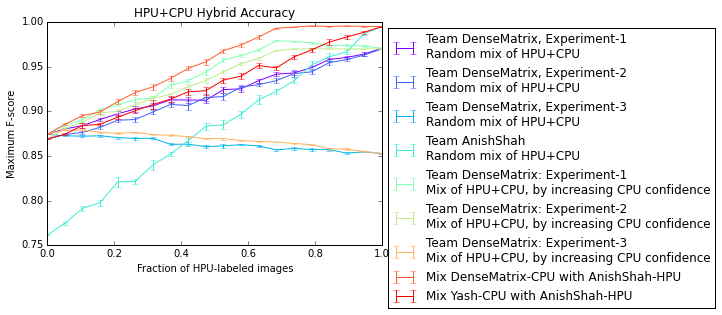
Here is a (preliminary!) evaluation framework for the Aspiring Research Challenge.
Right now, we can parse bounding boxes from the Single-Scale subset of UIUC Cars, using the following teams' data:
- Team DenseMatrix, all three HPU experiments and one CPU;
- Yash's team's CPU (no confidence scores);
- Anish Shah's team's CPU (no confidence scores);
We haven't got this working for Caltech or SVHN yet.
- Install the following Python packages:
- Numpy
- Matplotlib
- Pandas (to parse some data; feel free to comment these out if you don't need all the lines on the plot)
If you need a quick way to install Python along with these related packages, Enthought's Canopy python distribution or Anaconda provide a Python interpreter, an editor, and a bunch of scientific packages that work on Mac OSX and Windows. There are (well-hidden) free versions of both of these systems. The Python Wiki also has some links to these packages.
- Once you have Python working, run
plot_uiuc_cars.py, which will show the figure on your screen.
To add your bounding boxes, we need the following information for each image:
- The image file name
- A list of bounding boxes for each image, with the coordinates of the top left corner, the width, and the height of the box.
- If you are using a CPU algorithm, each bounding box should have a confidence score that indicates your algorithm's confidence in its detection
- If you are using an HPU algorithm, each bounding box should include the time in seconds that it took to label each box. (If you calculated this per image, it's OK to take the image time and divide by the number of bounding boxes, for example)
For good examples of formatting to imitate, see StudentData-UIUC-Cars/Example Bounding Box Format.json.
Another preferred format is CSV format (comma-separated format), with the following fields:
- Image filename
- Top coordinate of the bounding box, in px from the top of the image
- Left coordinate of the bounding box, in px from the left side of the image
- Width of the bounding box (right-left)
- Height of the bounding box (bottom-top)
- For CPU algorithms: Confidence score for this bounding box, as determined by your CPU algorithm
- For HPU algorithms: Time it took the human to label this bounding box, in seconds (if you calculated this per image, it's OK to take the image time and divide by the number of bounding boxes, for example) If your algorithm detects multiple bounding boxes in the image, have multiple rows with the same file name.
Please either confirm to one of these formats, or write code to parse your data, using the plot_uiuc_cars.py file as a reference. This file parses teams' data and adds the line to the plot.
You can send this data to us by submitting a pull request, posting it to the Piazza data thread, or by messaging us on slack with a link to your data files.
One of the advantages of writing code to parse teams data is that we can get that data back out in a format of our choosing if we need it.
If you are building an HPU and want to base your bounding boxes off of a certain team's existing CPU bounding boxes, you can import plot_uiuc_cars as if it were a Python module and extract the data from that.
The parsed format is a mapping from image ID (filename) to a list of bounding boxes:
{"test-0.png": [box1, box2, ...],
 "test-1.png": [boxA, boxB, boxC, ...],
 "test-2.png": [],
 }
where each bounding box is an instance of the BoundingBox class from bb_utils.py. In this example, the detector was run on three images and didn't find any detections in test-2.png.
Here is an example Python session which outputs Team DenseMatrix's CPU bounding boxes in a space-separated format:
Python 2.7.9 (default, Dec 11 2014, 04:42:00)
[GCC 4.9.2] on linux2
Type "help", "copyright", "credits" or "license" for more information.
>>> import plot_uiuc_cars
Loading data...
>>> for image_name, boxes in plot_uiuc_cars.DenseMatrix3_CPU.items():
...     for box in boxes:
...         print image_name, box.left, box.top, box.width, box.height
...

test-138.png 41 38 111 43
test-104.png -1 39 118 46
test-110.png 75 52 123 48
test-51.png 13 31 120 46
test-92.png -7 52 122 47
test-93.png -28 -56 182 70
If you would like to use a team's bounding boxes but can't get the code to work, let us know what team you need and what format you want it in, and we will be happy to send you the file.
