Replication package for the study "Augmented Testing to support Manual GUI-based Regression Testing: An Empirical Study"
Context: Manual graphical user interface (GUI) software testing presents a substantial part of the overall practiced testing efforts, despite various research efforts to further increase test automation. Augmented Testing (AT), a novel approach for GUI testing, aims to aid manual GUI-based testing through a tool-supported approach where an intermediary visual layer is rendered between the system under test (SUT) and the tester, superimposing relevant test information.
Objective: The primary objective of this study is to gather empirical evidence regarding AT's efficiency compared to manual GUI-based regression testing. Existing studies involving testing approaches under the AT definition primarily focus on exploratory GUI testing, leaving a gap in the context of regression testing. As a secondary objective, we investigate AT's benefits, drawbacks, and usability issues when deployed with the demonstrator tool, Scout.
Method: We conducted an experiment involving 13 industry professionals, from six companies, comparing AT to manual GUI-based regression testing. These results were complemented by interviews and Bayesian data analysis (BDA) of the study's quantitative results.
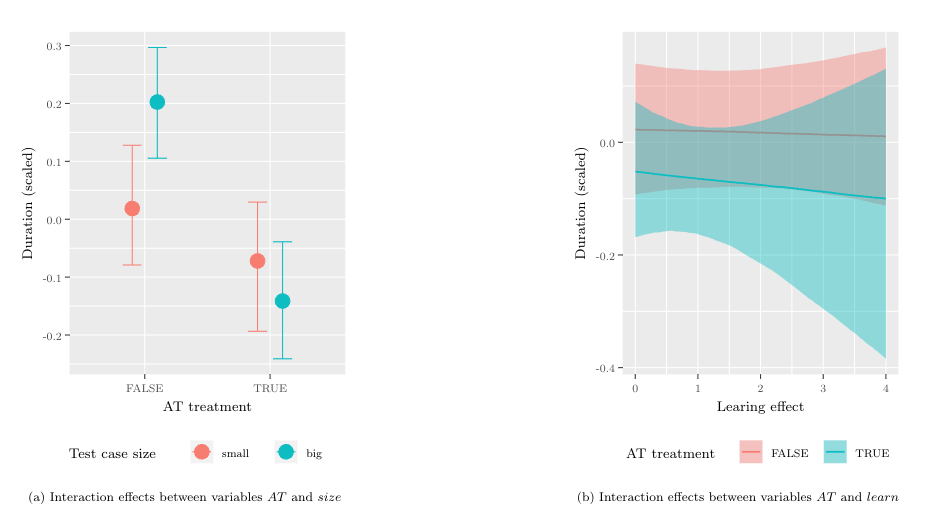
Results: The results of the Bayesian data analysis revealed that the use of AT shortens test durations in 70% of the cases on average, concluding that AT is more efficient. When comparing the means of the total duration to perform all tests, AT reduced the test duration by 36% in total. Participant interviews highlighted nine benefits and eleven drawbacks of AT, while observations revealed four usability issues.
Conclusion: This study makes an empirical contribution to understanding Augmented Testing, a promising approach to improve the efficiency of GUI-based regression testing in practice. Furthermore, it underscores the importance of continual refinements of AT.
The analysis consists of two parts.
In src/main.qmd, we performed descriptive statistics analysis of the data and visualized them using bar and violin plots.
src/BDA.qmd contains the Bayesian Data Analysis of the data.
Use setup.R to install dependencies.
Use makefile to render a new version.
make renderCopyright © 2023 Andreas Bauer, Julian Frattini
This work (source code) is licensed under MIT.

