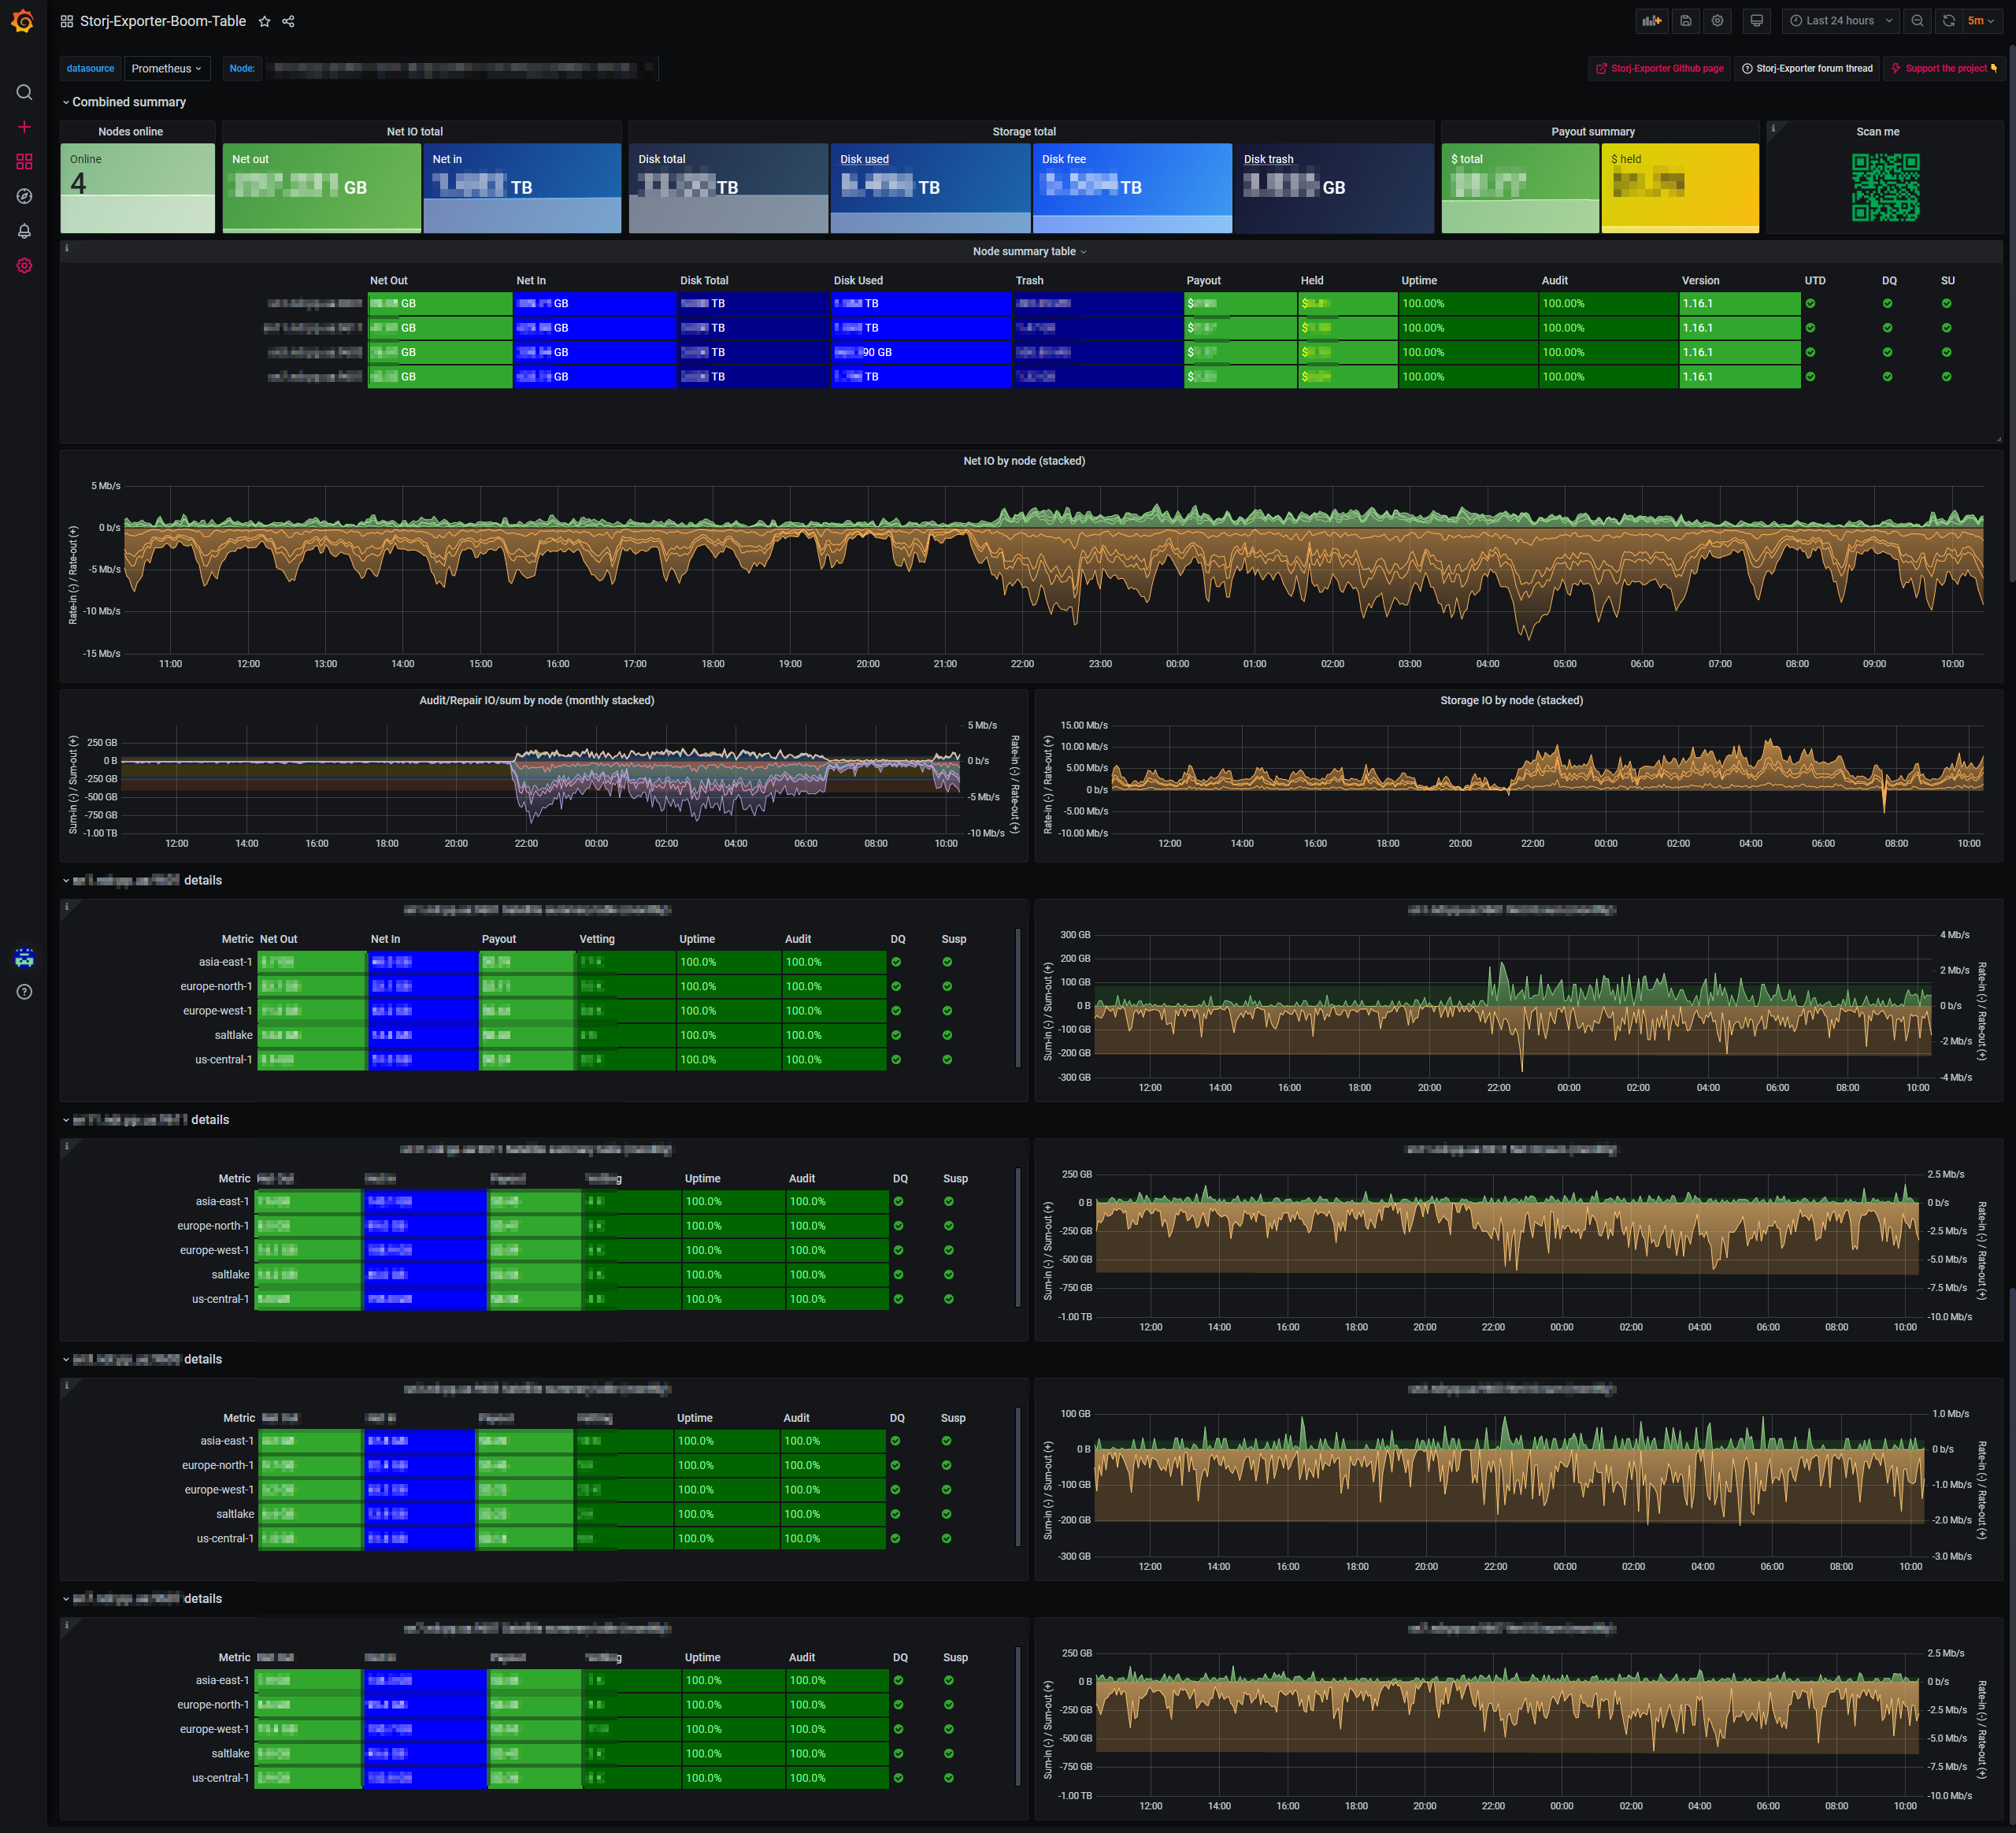
Storj-exporter Grafana dashboard to visualise Storj-Exporter metrics for multiple Storj storage nodes. See my quick-start guide to set up the whole stack using docker-compose.
Import Storj-Exporter-Boom-Table.json via your Grafana UI ("+" -> Import), select your Prometheus datasource at the top-left of the dashboard.
Alternately, import by ID, simply paste in 13810, which is the grafana dashboards entry for this repo.
Monitoring stack required for this dashboard includes the following components:
- Storj-Exporter - collects storagenode metrics
- Prometheus server - scrapes and stores metrics from Storj-Exporter
- Grafana - pulls data from Prometheus and visualises it * Storj-Exporter-dashboard - a template dashboard for Storj-Exporter metrics
Here's how metrics flow through the stack:
Storagenode => Storj-Exporter => Prometheus server => Grafana (Storj-Exporter-dashboard)
See my quick-start guide to set up the whole stack using docker-compose.
Alternatively check out links below for other ways to install/configure these components:
- Storj-Exporter - https://github.com/anclrii/Storj-Exporter#installation
- Prometheus - https://prometheus.io/docs/prometheus/latest/installation/
- Grafana - https://grafana.com/docs/grafana/latest/installation/
There's an ansible role toconspiracy/storj-beastmode for storagenodes that features all above monitoring components.
