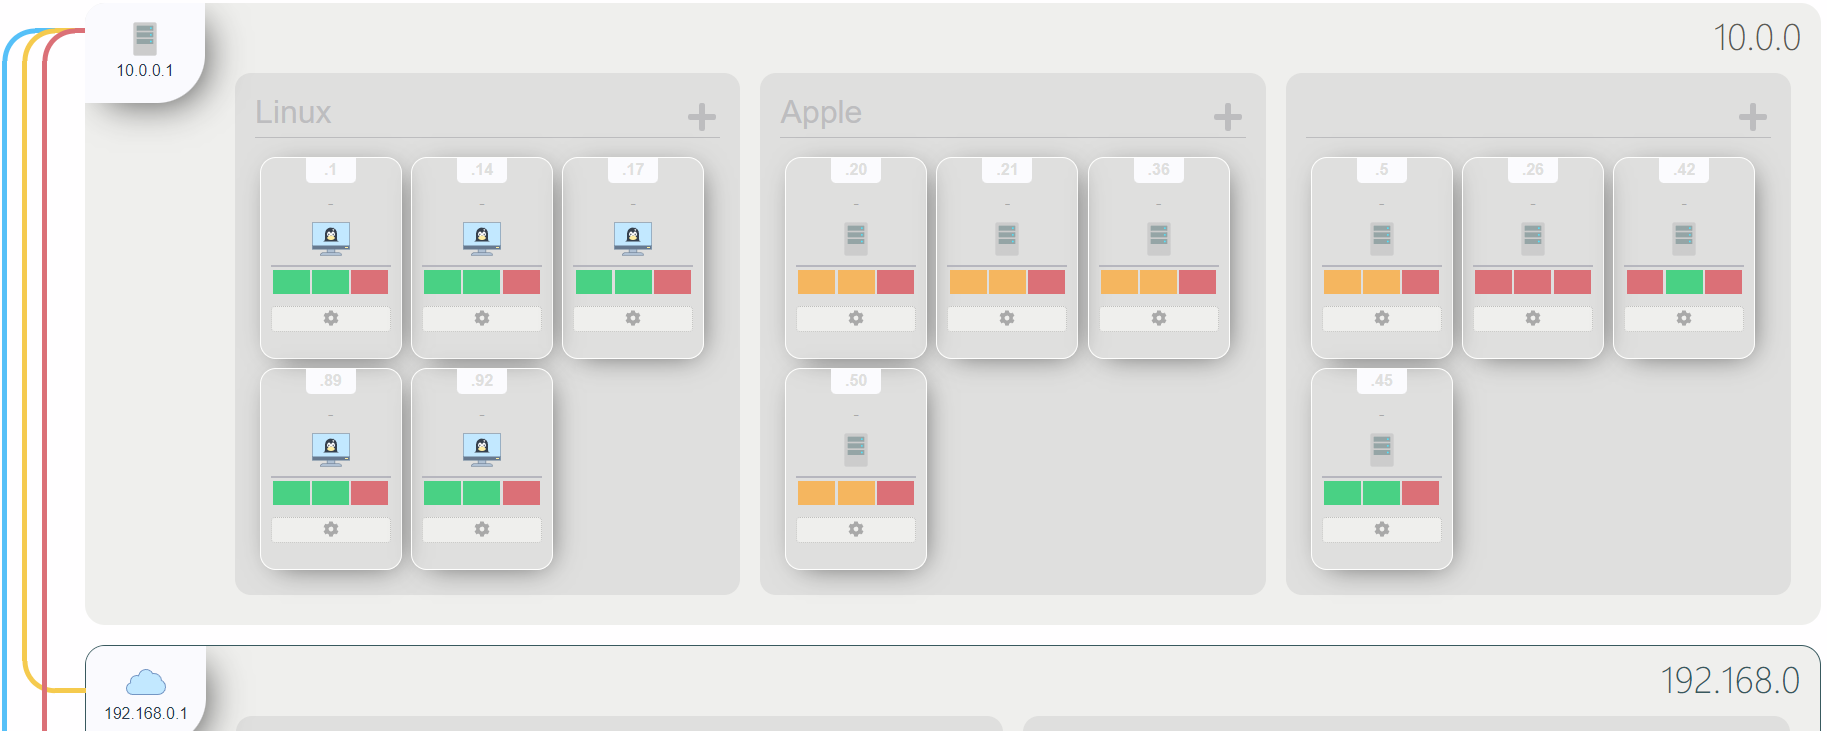
The beautiful network analyzer, mapper, and monitor.
sudo bash install.sh- this will walk you through the setup needed for Auth0 information.- If you are running docker as non-root, then remove the top section from
install.shand re-run.
Redis is also going to be used a write cache for incoming metrics. This way, the load on the metric database server will be greatly reduced. We can tune the time to write the metrics as well.
I'm converting the Mongo databsae to a timeseries. This involved the following Python code:
db.create_collection(collection, timeseries={ 'timeField': 'timestamp', "metaField" : "metadata"})
I will also resume sending metrics directly to the second table. I'll have to set up TTL at a later date (through the Mongo Shell NOT python):
use labyrinth

db.runCommand({
   collMod: "metrics",
   expireAfterSeconds: 2419201
})
I did a compound index of tags.labyrinth_name, tags.host, tags.ip, tags.mac - seemed to work very well.
I also added a timestamp, -1 index to help with the graphs. NOTE: This didn't end up doing anything.
Labyrinth is depending on a Mongo Database trigger to move metrics from metrics-latest to metrics collection.
Here is the trigger's javascript code (I'm personally running it at 15 minute intervals):
exports = async function() {
  /*
    A Scheduled Trigger will always call a function without arguments.
    Documentation on Triggers: https://www.mongodb.com/docs/atlas/app-services/triggers/overview/

    Functions run by Triggers are run as System users and have full access to Services, Functions, and MongoDB Data.

    Access a mongodb service:
    const collection = context.services.get(<SERVICE_NAME>).db("db_name").collection("coll_name");
    const doc = collection.findOne({ name: "mongodb" });

    Note: In Atlas Triggers, the service name is defaulted to the cluster name.

    Call other named functions if they are defined in your application:
    const result = context.functions.execute("function_name", arg1, arg2);

    Access the default http client and execute a GET request:
    const response = context.http.get({ url: <URL> })

    Learn more about http client here: https://www.mongodb.com/docs/atlas/app-services/functions/context/#std-label-context-http
  */
  const mongodb = context.services.get("altamont");
  const metrics_current  = mongodb.db("labyrinth").collection("metrics-latest");


  return await metrics_current.aggregate([{"$project" : { "_id" : 0 }}, {"$merge" : "metrics"}]).toArray()
};
Sure - to some extent. Labyrinth is built upon very solid projects: NMap, Ansible, and Telegraf.
However, Labyrinth does some things better than other popular projects:
-
Labyrinth looks good. Yes, you can use Grafana to make pretty good dashboards, but I want something that's naturally nice looking and simple. Grafana dashboards are endlessly customizable, and by that virtue - never completed. Grafana also struggles a little with multi-host displays - I wasn't able to make it look quite like I wanted.
-
Labyrinth has better autodiscovery: port scanning. Projects like Prometheus have auto discovery, but they are very cloud-centric. Labyrinth fits best in a on-prem or hybrid situation, with many different kinds of clients joining and leaving. TCP/UDP are some of the fundamental protocols: if you can't communicate over them, something's probably wrong. Furthermore, Labyrinth wants to know if something unexpected has happened: a port being openend or closed, a new client that wasn't supposed to be in that subnet, etc.
-
Labyrinth has simple management. By using Ansible and Telegraf, it's very easy to provision from the web interface. Don't want to do that? No problem - the ports based nature of Labyrinth can give a good idea of network status without an agent.
-
Labyrinth is easy. Start it up as a docker, use the web interface, done - up and running in minutes. If you want to get into Telegraf configuration files, you're able to do that.
Labyrinth is meant for hybrid, dynamic, check based network management. For homogenous services or full cloud offerings, there are tons of better projects: Prometheus, ELK stack, Sensu Go, etc.
Labyrinth also isn't built with metric analysis or time-series in mind - you can do them, but there are tons of better tools out there: Graylog, ELK, etc.
Labyrinth is built for smaller to midsize networks - I simply don't know how it works on large networks, since I'm building to solve my problem.
Labyrinth is for whatever poor sysadmin has a small to midsize network they can't keep up with - and they just want something easy and pretty to occasionally look at. Whether that's a homelab admin or a one-man devops band, Labyrinth is here to help.
You probably can use Labyrinth for K8, but there are plenty of better, specialized tools that you should probably use instead.
Start a development docker-compose stack with the following commands:
docker-compose -f docker-compose-development.yml up --build -d- Port
8100will be the Vue frontend server. Go there to start up the development server. - Once the Vue frontend server has been started, navigate to
:8101to see the live frontend. - Certificates: you may need to point your browser to
:7200to accept the self-signed certificate. If you navigate to the frontend without doing that, you will receive "Network Error" messages.
- Documentation on setting up Auth0 for the system. Also notes on how to disable using auth (can just have it as an ENV variable in the docker compose)
- https://github.com/SabyasachiRana/WebMap - although this project is pretty quiet currently, this had lots of good ideas. I just wish it was more of a network management tool than just scanning.
- Prometheus
- Sensu Go
- etc.

