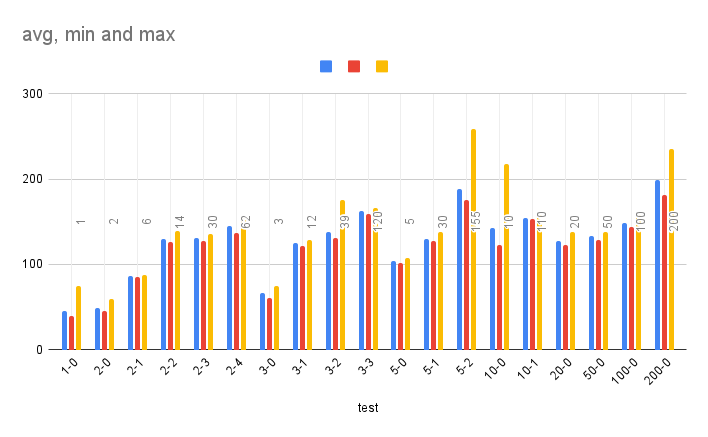
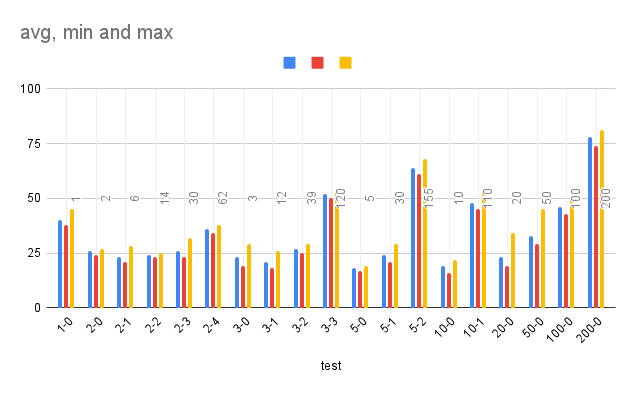
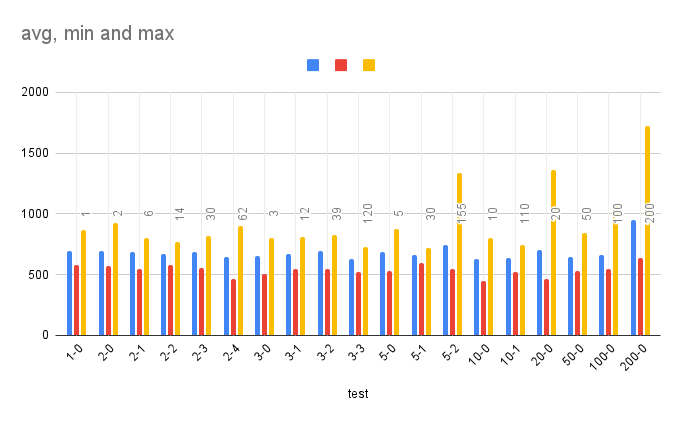
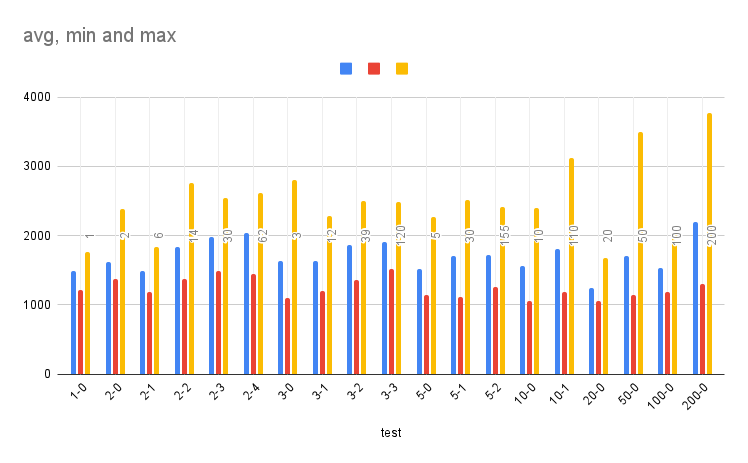
Tests simulate loading of esm in the browser with different dependency tree.
Tests are defined in src/tests.js, each test is defined by:
size- total size of data to load, always 5mb.numberOfDeps- how many dependencies each module has.depth- how many dependency levels to simulate.
For example, test with numberOfDeps: 2, depth: 4, first module loads 2 dependencies, then each of those loads 2 then each of those load 2 until depth of 4. This means we have:
1 module (initial) -> 2 modules -> 4 modules -> 8 modules -> 16 modules -> 32 modules
That means that we are splitting 5MB of data into 62 files ~82KB each.
To simulate module size, random string is generated using function in src/test-utils/generate-random-string.js.
To generate all test data:
$ npm run generateTests are generated in dist folder.
To serve all files from dist folder locally:
$ npm run serve
Server runs both http1 and http2 listeners.
By default when running tests, each test is performed 10 times and min, max and avg values are calculated.
To run http1 tests locally:
$ npm run test:localhost:http
To run http2 tests locally:
$ npm run test:localhost:http2
To run tests on vercel:
$ npm run test:vercel
To run tests on flyio (Chicago):
$ npm run test:flyio
| test | number of modules | avg | min | max | diff to previous | diff to 1 |
|---|---|---|---|---|---|---|
| 1-0 | 1 | 45 | 39 | 75 | 0 | 0 |
| 2-0 | 2 | 49 | 45 | 59 | 8.89% | 8.89% |
| 2-1 | 6 | 86 | 85 | 87 | 75.51% | 91.11% |
| 2-2 | 14 | 130 | 126 | 139 | 51.16% | 188.89% |
| 2-3 | 30 | 131 | 128 | 136 | 0.77% | 191.11% |
| 2-4 | 62 | 145 | 137 | 155 | 10.69% | 222.22% |
| 3-0 | 3 | 66 | 61 | 75 | -54.48% | 46.67% |
| 3-1 | 12 | 125 | 122 | 129 | 89.39% | 177.78% |
| 3-2 | 39 | 138 | 131 | 176 | 10.40% | 206.67% |
| 3-3 | 120 | 163 | 159 | 166 | 18.12% | 262.22% |
| 5-0 | 5 | 104 | 102 | 108 | -36.20% | 131.11% |
| 5-1 | 30 | 130 | 127 | 138 | 25.00% | 188.89% |
| 5-2 | 155 | 188 | 176 | 259 | 44.62% | 317.78% |
| 10-0 | 10 | 143 | 123 | 218 | -23.94% | 217.78% |
| 10-1 | 110 | 155 | 153 | 158 | 8.39% | 244.44% |
| 20-0 | 20 | 128 | 123 | 138 | -17.42% | 184.44% |
| 50-0 | 50 | 133 | 129 | 138 | 3.91% | 195.56% |
| 100-0 | 100 | 148 | 144 | 158 | 11.28% | 228.89% |
| 200-0 | 200 | 199 | 181 | 236 | 34.46% | 342.22% |
| test | number of modules | avg | min | max | diff to previous | diff to 1 |
|---|---|---|---|---|---|---|
| 1-0 | 1 | 40 | 38 | 45 | 0 | 0 |
| 2-0 | 2 | 26 | 24 | 27 | -35.00% | -35.00% |
| 2-1 | 6 | 23 | 21 | 28 | -11.54% | -42.50% |
| 2-2 | 14 | 24 | 23 | 25 | 4.35% | -40.00% |
| 2-3 | 30 | 26 | 23 | 32 | 8.33% | -35.00% |
| 2-4 | 62 | 36 | 34 | 38 | 38.46% | -10.00% |
| 3-0 | 3 | 23 | 19 | 29 | -36.11% | -42.50% |
| 3-1 | 12 | 21 | 18 | 26 | -8.70% | -47.50% |
| 3-2 | 39 | 27 | 25 | 29 | 28.57% | -32.50% |
| 3-3 | 120 | 52 | 50 | 54 | 92.59% | 30.00% |
| 5-0 | 5 | 18 | 17 | 19 | -65.38% | -55.00% |
| 5-1 | 30 | 24 | 21 | 29 | 33.33% | -40.00% |
| 5-2 | 155 | 64 | 61 | 68 | 166.67% | 60.00% |
| 10-0 | 10 | 19 | 16 | 22 | -70.31% | -52.50% |
| 10-1 | 110 | 48 | 45 | 53 | 152.63% | 20.00% |
| 20-0 | 20 | 23 | 19 | 34 | -52.08% | -42.50% |
| 50-0 | 50 | 33 | 29 | 45 | 43.48% | -17.50% |
| 100-0 | 100 | 46 | 43 | 51 | 39.39% | 15.00% |
| 200-0 | 200 | 78 | 74 | 81 | 69.57% | 95.00% |
| test | number of modules | avg | min | max | diff to previous | diff to 1 |
|---|---|---|---|---|---|---|
| 1-0 | 1 | 691 | 580 | 864 | 0 | 0 |
| 2-0 | 2 | 692 | 574 | 924 | 0.14% | 0.14% |
| 2-1 | 6 | 682 | 544 | 799 | -1.45% | -1.30% |
| 2-2 | 14 | 668 | 577 | 767 | -2.05% | -3.33% |
| 2-3 | 30 | 689 | 550 | 816 | 3.14% | -0.29% |
| 2-4 | 62 | 644 | 460 | 900 | -6.53% | -6.80% |
| 3-0 | 3 | 654 | 506 | 801 | 1.55% | -5.35% |
| 3-1 | 12 | 673 | 543 | 809 | 2.91% | -2.60% |
| 3-2 | 39 | 694 | 545 | 825 | 3.12% | 0.43% |
| 3-3 | 120 | 628 | 520 | 726 | -9.51% | -9.12% |
| 5-0 | 5 | 689 | 531 | 871 | 9.71% | -0.29% |
| 5-1 | 30 | 661 | 593 | 717 | -4.06% | -4.34% |
| 5-2 | 155 | 742 | 549 | 1338 | 12.25% | 7.38% |
| 10-0 | 10 | 628 | 445 | 797 | -15.36% | -9.12% |
| 10-1 | 110 | 638 | 517 | 747 | 1.59% | -7.67% |
| 20-0 | 20 | 705 | 462 | 1362 | 10.50% | 2.03% |
| 50-0 | 50 | 641 | 533 | 840 | -9.08% | -7.24% |
| 100-0 | 100 | 664 | 543 | 1077 | 3.59% | -3.91% |
| 200-0 | 200 | 949 | 636 | 1721 | 42.92% | 37.34% |
| test | number of modules | avg | min | max | diff to previous | diff to 1 |
|---|---|---|---|---|---|---|
| 1-0 | 1 | 1493 | 1223 | 1768 | 0 | 0 |
| 2-0 | 2 | 1618 | 1379 | 2389 | 8.37% | 8.37% |
| 2-1 | 6 | 1489 | 1180 | 1837 | -7.97% | -0.27% |
| 2-2 | 14 | 1837 | 1377 | 2763 | 23.37% | 23.04% |
| 2-3 | 30 | 1986 | 1495 | 2548 | 8.11% | 33.02% |
| 2-4 | 62 | 2040 | 1441 | 2620 | 2.72% | 36.64% |
| 3-0 | 3 | 1627 | 1106 | 2804 | -20.25% | 8.98% |
| 3-1 | 12 | 1638 | 1201 | 2283 | 0.68% | 9.71% |
| 3-2 | 39 | 1867 | 1355 | 2503 | 13.98% | 25.05% |
| 3-3 | 120 | 1913 | 1521 | 2491 | 2.46% | 28.13% |
| 5-0 | 5 | 1514 | 1139 | 2274 | -20.86% | 1.41% |
| 5-1 | 30 | 1709 | 1111 | 2511 | 12.88% | 14.47% |
| 5-2 | 155 | 1723 | 1265 | 2410 | 0.82% | 15.41% |
| 10-0 | 10 | 1569 | 1052 | 2393 | -8.94% | 5.09% |
| 10-1 | 110 | 1801 | 1181 | 3121 | 14.79% | 20.63% |
| 20-0 | 20 | 1245 | 1058 | 1674 | -30.87% | -16.61% |
| 50-0 | 50 | 1709 | 1142 | 3490 | 37.27% | 14.47% |
| 100-0 | 100 | 1532 | 1184 | 2017 | -10.36% | 2.61% |
| 200-0 | 200 | 2204 | 1306 | 3768 | 43.86% | 47.62% |
One thing to note, that download size is not exactly the same because of module export and import statements, more modules require more import statements.
- HTTP2 offers huge improvements when loading multiple modules in parallel. With HTTP1 loading only 5 in parallel already slows down loading by ~130%.
- Without latency, when running on localhost, loading 100 modules adds around 10ms to load time.
- With latency, there is almost no difference if loading 1 big module or loading 100 small modules in parallel, difference is from 1-5%, in some tests it is even faster to load 100 modules in parallel. Loading 200 modules does cause consistently worse performance by ~40% when compared to loading one big module.
- Depth of dependency tree does impact performance. When using CDN, results are more consistent and impact is much lower, up to 5% per each depth level. Without CDN, when there is significant latency, performance can be impacted up to 15% per each depth level.


