- Introduction
- What is Fractal Governance?
- Getting Started for Data Scientists
- Example Analysis of the Genesis Fractal
- Setup
- A Dataset of Multiple pandas DataFrames
- DataFrame of Member Leaderboard
- A Plots Object of Multiple Visualizations
- Plot of Attendance vs Time
- DataFrame of New and Returning Member Attendance vs Time
- Average Attendees per Meeting
- Plot of Consistency of Attendance
- Average Consistency of Attendance
- DataFrame of New and Returning Member Respect Mined (or Earned) vs Time
- Plot of Accumulated New and Returning Member Respect vs Time
- Total Accumulated Member Respect
- DataFrame of Team Respect Mined (or Earned) vs Time
- Plot of Accumulated Team Respect vs Time
- Total Accumulated Team Respect
- DataFrame of Team Leaderboard
- Plot of Team Representation
- Average Team Representation per Meeting
- DataFrame of Consensus Rank vs Attendance
- DataFrame of Accumulated Consensus Rank vs Attendance
- Plot of Attendance Consistency vs Rank
- Getting Started for Software Engineers
- Notes for Contributors
- Resources
- License
Datasets, Jupyter notebooks and Streamlit dashboards for Fractal Governance
The motivation for this repository is to advance the understanding of Fractal Governance. The datasets from our experimental apparatus will be of particular interest to data scientists, researchers and educators.
The goal of Fractal Governance is lofty: incentivize people to collaborate in the production of public goods and services that also eliminates corruption and graft in the process.
The principles of Fractal Governance are described in the book More Equal Animals by Daniel Larimer, and the technical specifications for how to implement Fractal Governance at scale is defined in the fractally White Paper. This article presents an analysis of the initial results of the first group of people to govern themselves according to these principles and technical specifications.
These pioneers call their group Genesis and refer to it as a Fractal. The Genesis members meet weekly to mine the inherent value of their collaboration to produce public goods and services and return that mined value, tokenized in units called Respect, directly back to its members through a governance process that naturally prevents corruption and graft. This incorruptibility is the defining feature of Fractal Governance.
Fractal Governance directly and consistently rewards individuals for their recent past contributions towards the creation of public goods and services that also avoids the formation of Pareto distributions due to corruption and graft found in all other known forms of governance. Gone are the days of rewarding collusion with illicit gains (such as currency) from dishonest behavior or other questionable means.
Analogous to Bitcoin's Proof of Work consensus algorithm which rewards people for transforming stored energy, in the form of electricity, into an incorruptible public ledger of account, a collaboration of people governed in a Fractal nature also uses a Proof of Work consensus algorithm to reward people for transforming stored energy, in the form of human collaboration, into public goods and services.
The fundamental difference between the two consensus algorithms is in how rewards are allocated. The Bitcoin model allocates rewards called BTC tokens to those who consume the most electricity most consistently. The Fractal model, on the other hand, allocates rewards called Respect tokens to those who contribute the most value most consistently, as judged by their peers.
The Bitcoin consensus algorithm is prone to corruption and graft because it rewards those that obtain the most consistent source of electricity by any means whatsoever, illicit or otherwise. The Fractal Governance consensus algorithm, on the other hand, prevents corruption and graft by eliminating opportunities for collusion.
The nature of how the rewards from the Bitcoin and Fractal Governance systems are recorded is similar in that both systems use a blockchain for their public ledger of account.
You can immediately explore the Genesis Fractal dataset before returning here to continue your exploration. The dataset for this dashboard is curated by Gregory Wexler, Joshua Seymour and Matt Langston.
I use my M1 MacBook with MacPorts for the steps labeled one time setup.
Install python 3.9 and pipenv. I do this using MacPorts.
sudo port install python39
sudo port select --set python3 python39
sudo port select --set python python39
sudo port install pipenvUse pipenv to install the python dependencies. Run this command from the top-level directory of this git repository.
pipenv install --devRun the Streamlit app. This will run the same dashboard as Genesis Fractal dataset.
pipenv run streamlit run fractal_governance/streamlit/genesis_fractal.py
open http://localhost:8501Explore the Jupyter notebooks:
pipenv run jupyter labStart exploring our datasets, models and simulations. What follows is an example analysis of the Genesis fractal's dataset to inspire your own explorations.
# 3rd party dependencies
import matplotlib.pyplot as plt

# 2nd party dependencies
import fractal_governance.dataset
import fractal_governance.plots

from fractal_governance.util import GitHubMarkdownDataFrameRead the Genesis fractal's dataset into a Dataset object consisting of multiple convenient pandas DataFrames.
dataset = fractal_governance.dataset.Dataset.from_csv('../data/genesis-weekly_rank.csv')List the attributes of this Dataset object to see what properties and methods we have to work with.
[attribute for attribute in dir(dataset) if not attribute.startswith('__')]['_get_new_member_filter_for_meeting_id',
'attendance_consistency_stats',
'attendance_stats',
'df',
'df_member_attendance_new_and_returning_by_meeting',
'df_member_leader_board',
'df_member_rank_by_attendance_count',
'df_member_respect_new_and_returning_by_meeting',
'df_member_summary_stats_by_member_id',
'df_team_leader_board',
'df_team_representation_by_date',
'df_team_respect_by_meeting_date',
'from_csv',
'get_new_member_dataframe_for_meeting_id',
'get_returning_member_dataframe_for_meeting_id',
'last_meeting_date',
'team_representation_stats',
'total_meetings',
'total_member_respect',
'total_respect',
'total_team_respect',
'total_unique_members']
The curated raw data from the Genesis weekly consensus meetings is a pandas DataFrame accessed through the df property.
The other properties beginning with the prefix df_ are derived DataFrames from the raw data in the df DataFrame.
All other properties, total_respect for example, are interesting values calculated from the various DataFrames.
Let's have a look at the raw data df DataFrame from which everything else is derived.
GitHubMarkdownDataFrame(dataset.df)| Index | MemberID | Name | MeetingID | Group | Rank | TeamID | TeamName | MeetingDate | Respect | |
|---|---|---|---|---|---|---|---|---|---|---|
| 0 | 1 | 00 | Chace Eskimo | 2 | 1 | 4 | NaN | NaN | 2022-03-05 | 8 |
| 1 | 2 | 01 | Debraj Ghosh | 2 | 2 | 3 | NaN | NaN | 2022-03-05 | 5 |
| 2 | 3 | 02 | Nick Shock | 2 | 2 | 2 | NaN | NaN | 2022-03-05 | 3 |
| 3 | 4 | 03 | Jimmy Lee | 2 | 3 | 2 | NaN | NaN | 2022-03-05 | 3 |
| 4 | 5 | 04 | Abdulsalam Ridwa | 2 | 6 | 1 | NaN | NaN | 2022-03-05 | 2 |
| ... | ... | ... | ... | ... | ... | ... | ... | ... | ... | ... |
| 389 | 390 | dphillippi | Duane Phillippi | 12 | 6 | 5 | NaN | NaN | 2022-05-21 | 13 |
| 390 | 391 | tmess | Toby Messier | 12 | 6 | 4 | 3.0 | Fractally in Orbit | 2022-05-21 | 8 |
| 391 | 392 | shakhruz | Shakhruz Ashirov | 12 | 6 | 3 | 2.0 | EOS Translation Foundation | 2022-05-21 | 5 |
| 392 | 393 | drwu | Doug Wu | 12 | 6 | 2 | 2.0 | EOS Translation Foundation | 2022-05-21 | 3 |
| 393 | 394 | drew-bop | Andrew Ware | 12 | 6 | 1 | NaN | NaN | 2022-05-21 | 2 |
394 rows × 10 columns
dataset.total_meetings12
dataset.total_unique_members99
Inspect the first few rows of the member leaderboard DataFrame based on accumulated consensus Rank.
GitHubMarkdownDataFrame(dataset.df_member_leader_board.head(10))| MemberID | Name | AccumulatedRank | AccumulatedRespect | AttendanceCount | |
|---|---|---|---|---|---|
| 1 | dan | Daniel Larimer | 64 | 215 | 11 |
| 2 | dansingjoy | Dan Singjoy | 63 | 189 | 12 |
| 3 | wildwex | Gregory Wexler | 60 | 191 | 11 |
| 4 | jseymour | Joshua Seymour | 54 | 143 | 12 |
| 5 | novacryptollc | Patrick Bernard Schmid | 46 | 122 | 10 |
| 6 | hachtu | Mark Scheer | 45 | 126 | 9 |
| 7 | pnc | Pascal Ngu Cho | 42 | 89 | 11 |
| 8 | douglasjames | Douglas Butner | 41 | 113 | 11 |
| 9 | jaytaylor-node | Jay Taylor | 40 | 80 | 12 |
| 10 | dphillippi | Duane Phillippi | 40 | 88 | 11 |
Create a Plots object that contains interesting visualizations used throughput the remainder of our example analysis.
plots = fractal_governance.plots.Plots.from_dataset(dataset)List the attributes of this Plots object to see what properties and methods we have to work with.
[attribute for attribute in dir(plots) if not attribute.startswith('__')]['accumulated_member_respect_vs_time',
'accumulated_member_respect_vs_time_stacked',
'accumulated_team_respect_vs_time',
'accumulated_team_respect_vs_time_stacked',
'attendance_consistency_histogram',
'attendance_count_vs_rank',
'attendance_vs_time',
'attendance_vs_time_stacked',
'dataset',
'from_csv',
'from_dataset',
'team_representation_vs_time']
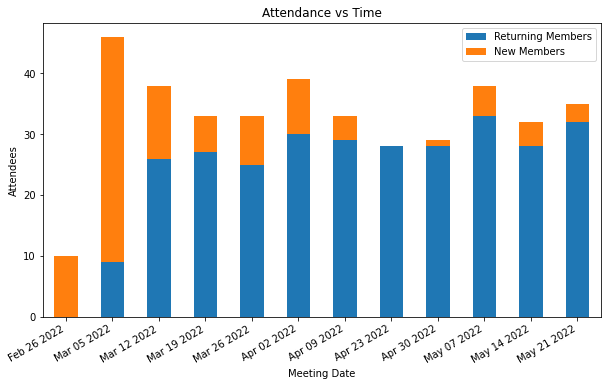
Plot the attendance vs time for each weekly consensus meeting.
The plot demonstrates that a relatively steady state has been reached where a core group of dedicated members is mixed with a steady stream of new participants as interest in Fractal Governance grows.
plots.attendance_vs_time_stacked
plt.show()Inspect the DataFrame of the attendance counts of new members vs returning members for each weekly consensus meeting.
GitHubMarkdownDataFrame(dataset.df_member_attendance_new_and_returning_by_meeting)| MeetingDate | MeetingID | NewMemberCount | ReturningMemberCount | |
|---|---|---|---|---|
| 0 | 2022-02-26 | 1 | 10 | 0 |
| 1 | 2022-03-05 | 2 | 37 | 9 |
| 2 | 2022-03-12 | 3 | 12 | 26 |
| 3 | 2022-03-19 | 4 | 6 | 27 |
| 4 | 2022-03-26 | 5 | 8 | 25 |
| 5 | 2022-04-02 | 6 | 9 | 30 |
| 6 | 2022-04-09 | 7 | 4 | 29 |
| 7 | 2022-04-23 | 8 | 0 | 28 |
| 8 | 2022-04-30 | 9 | 1 | 28 |
| 9 | 2022-05-07 | 10 | 5 | 33 |
| 10 | 2022-05-14 | 11 | 4 | 28 |
| 11 | 2022-05-21 | 12 | 3 | 32 |
The average number of attendees per meeting.
dataset.attendance_statsStatistics(mean=32.83, standard_deviation=8.68)
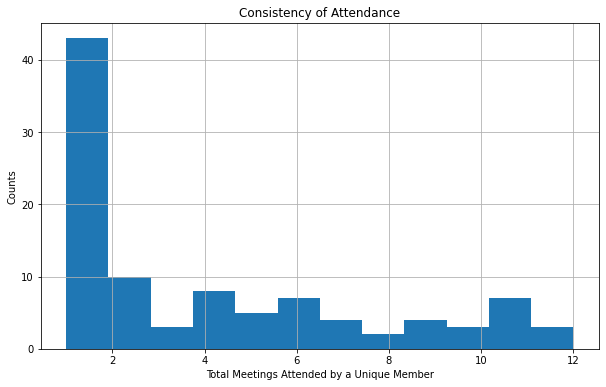
Plot the consistency of attendance for the weekly consensus meetings. This is the total number of meetings attended by a unique member. The first bin counts the number of people who have only attended one weekly consensus meeting.
plots.attendance_consistency_histogram
plt.show()The average number of meetings attended by a unique member.
dataset.attendance_consistency_statsStatistics(mean=3.98, standard_deviation=3.61)
Inspect the DataFrame for the total amount of member Respect mined (or earned) for each weekly consensus meeting.
GitHubMarkdownDataFrame(dataset.df_member_respect_new_and_returning_by_meeting)| MeetingDate | MeetingID | AccumulatedRespect | AccumulatedRespectNewMember | AccumulatedRespectReturningMember | |
|---|---|---|---|---|---|
| 0 | 2022-02-26 | 1 | 99 | 99 | 0 |
| 1 | 2022-03-05 | 2 | 412 | 296 | 116 |
| 2 | 2022-03-12 | 3 | 356 | 76 | 280 |
| 3 | 2022-03-19 | 4 | 306 | 49 | 257 |
| 4 | 2022-03-26 | 5 | 306 | 66 | 240 |
| 5 | 2022-04-02 | 6 | 358 | 44 | 314 |
| 6 | 2022-04-09 | 7 | 306 | 14 | 292 |
| 7 | 2022-04-23 | 8 | 256 | 0 | 256 |
| 8 | 2022-04-30 | 9 | 258 | 2 | 256 |
| 9 | 2022-05-07 | 10 | 356 | 45 | 311 |
| 10 | 2022-05-14 | 11 | 304 | 12 | 292 |
| 11 | 2022-05-21 | 12 | 310 | 10 | 300 |
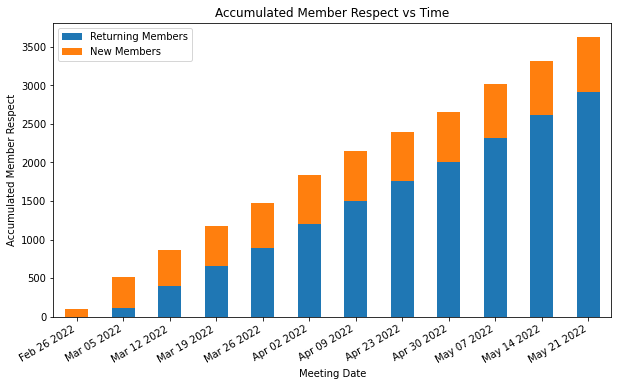
Plot the accumulated member Respect of the Genesis fractal vs time.
plots.accumulated_member_respect_vs_time_stacked
plt.show()The total accumulated member Respect integrated over all members.
dataset.total_member_respect3627
Inspect the DataFrame for the total amount of team Respect mined (or earned) for each weekly consensus meeting.
GitHubMarkdownDataFrame(dataset.df_team_respect_by_meeting_date)| TeamName | MeetingDate | AccumulatedRespect | |
|---|---|---|---|
| 0 | EOS Translation Foundation | 2022-04-23 | 21 |
| 1 | EOS Translation Foundation | 2022-04-30 | 23 |
| 2 | EOS Translation Foundation | 2022-05-07 | 21 |
| 3 | EOS Translation Foundation | 2022-05-14 | 26 |
| 4 | EOS Translation Foundation | 2022-05-21 | 34 |
| 5 | Fractally in Orbit | 2022-05-14 | 29 |
| 6 | Fractally in Orbit | 2022-05-21 | 16 |
| 7 | Team fractally | 2022-03-26 | 118 |
| 8 | Team fractally | 2022-04-02 | 89 |
| 9 | Team fractally | 2022-04-09 | 89 |
| 10 | Team fractally | 2022-04-23 | 68 |
| 11 | Team fractally | 2022-04-30 | 84 |
| 12 | Team fractally | 2022-05-07 | 102 |
| 13 | Team fractally | 2022-05-14 | 63 |
| 14 | Team fractally | 2022-05-21 | 76 |
| 15 | fractally francophonie | 2022-05-21 | 8 |
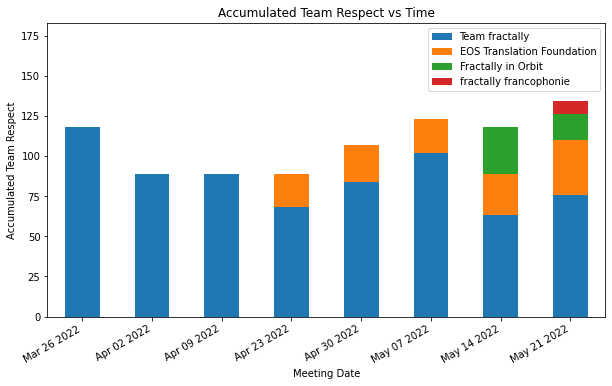
Plot the accumulated team Respect of the Genesis fractal teams vs time.
plots.accumulated_team_respect_vs_time_stacked
plt.show()The total accumulated team Respect integrated over all teams.
dataset.total_team_respect867
The team leaderboard shows the the total accumulated team Respect for each team.
GitHubMarkdownDataFrame(dataset.df_team_leader_board)| AccumulatedRespect | |
|---|---|
| TeamName | |
| Team fractally | 689 |
| EOS Translation Foundation | 125 |
| Fractally in Orbit | 45 |
| fractally francophonie | 8 |
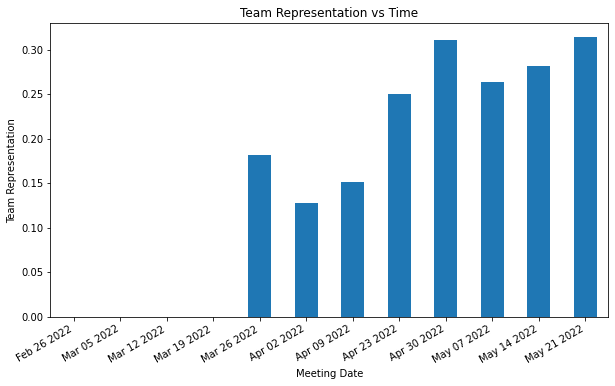
Plot the fraction of members representing teams over time.
plots.team_representation_vs_time
plt.show()The average team representation per meeting. This is the number of members in attendance that are members of a team divided by the total number of members in attendance.
dataset.team_representation_statsStatistics(mean=0.24, standard_deviation=0.07)
Inspect the DataFrame for the accumulated consensus Rank of contributions as discerned by the Genesis fractal for each member.
GitHubMarkdownDataFrame(dataset.df_member_summary_stats_by_member_id)| AttendanceCount | AccumulatedRank | AccumulatedRespect | Mean | StandardDeviation | |
|---|---|---|---|---|---|
| MemberID | |||||
| 00 | 1 | 4 | 8 | 4.000000 | NaN |
| 01 | 1 | 3 | 5 | 3.000000 | NaN |
| 02 | 1 | 2 | 3 | 2.000000 | NaN |
| 03 | 1 | 2 | 3 | 2.000000 | NaN |
| 04 | 1 | 1 | 2 | 1.000000 | NaN |
| ... | ... | ... | ... | ... | ... |
| wakeupjohnny | 1 | 1 | 2 | 1.000000 | NaN |
| wigglesthe3r | 2 | 7 | 13 | 3.500000 | 0.707107 |
| wildwex | 11 | 60 | 191 | 5.454545 | 0.934199 |
| willspatrick | 1 | 1 | 2 | 1.000000 | NaN |
| zhenek | 1 | 3 | 5 | 3.000000 | NaN |
99 rows × 5 columns
Inspect the DataFrame for the mean accumulated consensus Rank based on meeting attendance.
GitHubMarkdownDataFrame(dataset.df_member_rank_by_attendance_count)| AttendanceCount | Mean | StandardDeviation | |
|---|---|---|---|
| 0 | 1 | 2.581395 | 1.331533 |
| 1 | 2 | 3.500000 | 1.905670 |
| 2 | 3 | 3.222222 | 1.855921 |
| 3 | 4 | 3.375000 | 1.539795 |
| 4 | 5 | 3.160000 | 1.572683 |
| 5 | 6 | 4.380952 | 1.637255 |
| 6 | 7 | 3.750000 | 1.776910 |
| 7 | 8 | 2.875000 | 1.147461 |
| 8 | 9 | 3.611111 | 1.572583 |
| 9 | 10 | 4.033333 | 1.129032 |
| 10 | 11 | 4.129870 | 1.584054 |
| 11 | 12 | 4.361111 | 1.376388 |
The mean accumulated consensus Rank is strongly correlated with meeting attendance.
GitHubMarkdownDataFrame(dataset.df_member_rank_by_attendance_count[['AttendanceCount', 'Mean']].corr())| AttendanceCount | Mean | |
|---|---|---|
| AttendanceCount | 1.00000 | 0.67134 |
| Mean | 0.67134 | 1.00000 |
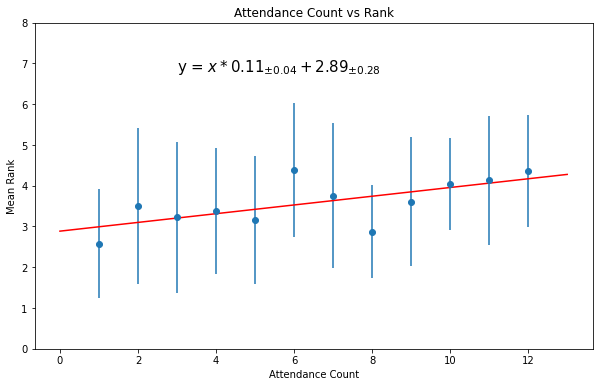
Based on this strong correlation, plot the change in Rank vs the number of meetings attended.
plots.attendance_count_vs_rank
plt.show()
As the plot shows, on average members rank higher in subsequent weeks based on the number of past weekly consensus meetings they have participated in. Possible reasons for this phenomena include:
- Over time members learn what their fellow members value and come into alignment with those values.
- Over time members begin to imitate their higher ranked colleagues from watching how they conduct themselves.
- There is a self-selection process going on. This is an interesting idea for further analysis.
I use my M1 MacBook for software engineering, and the following steps reflect that architecture.
Install bazel on your PATH. I do this using bazelisk.
curl -LJO https://github.com/bazelbuild/bazelisk/releases/download/v1.11.0/bazelisk-darwin-arm64
chmod a+x bazelisk-darwin-arm64
ln -s bazelisk-darwin-arm64 bazelInstall buildifier on your PATH.
You need buildifier for linting and formatting the bazel files WORKSPACE and BUILD if you change them.
curl -LJO https://github.com/bazelbuild/buildtools/releases/download/5.1.0/buildifier-darwin-arm64
chmod a+x buildifier-darwin-arm64
ln -s buildifier-darwin-arm64 buildifierInstall Xcode from the App Store.
I needed to create the following symlink on my M1 MacBook.
pushd /Applications/Xcode.app/Contents/Developer/Platforms/MacOSX.platform/Developer/SDKs/
sudo ln -s MacOSX.sdk MacOSX12.1.sdk
popd
This symlink was required to work around this error during bazel test //....
Compiling with an SDK that doesn't seem to exist: /Applications/Xcode.app/Contents/Developer/Platforms/MacOSX.platform/Developer/SDKs/MacOSX12.1.sdk Please check your Xcode installation
Clone this repo and build all targets.
bazel build //...Run all unit tests.
bazel test //...You are encouraged to collaborate and contribute to this project. Please ask questions and share your insights and discoveries in the Modeling and Simulation topic of gofractally.com.
Please perform the following procedures before opening a pull request for this project. These manual procedures are temporary and will eventually be incorporated into bazel targets and enforced through CI.
The source of truth for this project's python dependencies is the Pipfile file. The following three files are derived from this Pipfile file and must be regenerated after changing it:
This project's bazel repository, defined in WORKSPACE, depends on requirements.txt to define the python dependencies for bazel targets throughout this project.
The Streamlit app also depends on requirements.txt to define its runtime python dependencies.
Developer tools, like jupyterlab code formatters and linters, depend on requirements-dev.txt to define its runtime python dependencies.
The following procedure is how I update these three derived files after changing the Pipfile file. You will need pipenv for this step, so if you don't have this development tool installed then you may want to follow the steps labeled one time setup in Getting Started for Data Scientists.
pipenv install --dev
pipenv lock -r > requirements.txt
pipenv lock --dev -r > requirements-dev.txt
Check that the README.ipynb notebook and Streamlit app still run by following the procedure in Getting Started for Data Scientists, and that the unit tests still pass by following the procedure in Getting Started for Software Engineers.
Please use the following procedure to format and lint the python source code after making any changes.
find fractal_governance test -name '*.py' -print0 | xargs -0 pipenv run yapf -i
find fractal_governance test -name '*.py' -print0 | xargs -0 pipenv run pylintPlease use the following procedure to format and lint the bazel source files.
find . -type f -name "BUILD" -or -name "WORKSPACE" -print0 | xargs -0 buildifier -lint fixThe source of truth for this project's README.md file is the README.ipynb notebook. The following procedure is how I update the README.md file after changing the README.ipynb notebook.
pipenv run nodeenv -p
pipenv run npm install -g doctocrm -rf README_files
pipenv run jupyter nbconvert --to markdown notebook/README.ipynb --output-dir .
pipenv run doctoc README.mdResources to learn more about Fractal Governance:
- fractally White Paper
- More Equal Animals by Daniel Larimer
- First Results from the Fractal Governance Experiments
- Genesis Fractal Dashboard
- Modeling and Simulation topic on gofractally.com
If you contribute new Jupyter notebooks then please place them in the notebook directory.
This project is licensed under the terms of the MIT license as defined in the LICENSE file.
