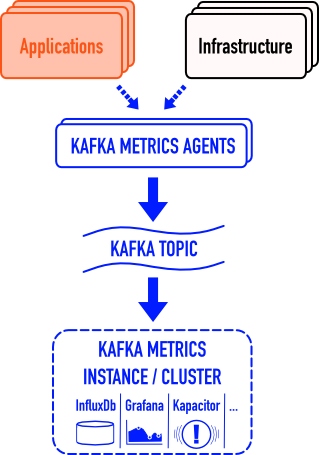
This is a system for real-time aggregation of metrics from large distributed systems. Rather than replacing existing
monitoring solutions it fulfills the role of real-time distributed aggregation element to combine metrics from
multiple systems, with some out-of-the-box features for data streams pipelines based on Apache Kafka.
- Overview
- Quick Start
- Modules Reference
- Configuration
- Operations & Troubleshooting
- Development
Kafka Metrics is a set of libraries and runtime modules that can be deployed in various configurations and can be used as an A) out-of-the-box monitoring for data streams infrastructures built with Apache Kafka including automatic discovery and configuration for existing Kafka clusters B) a framework for monitoring distributed systems in general using Apache Kafka infrastructure as a transport layer.
The aim of the design is to have small composable modules that can be deployed by configuration to cover use cases ranging from quick, non-intrusive inspection of existing Kafka clusters and stream pipelines, to massive-scale purpose-built monitoring, detection and alerting infrastructure for distributed systems in general.
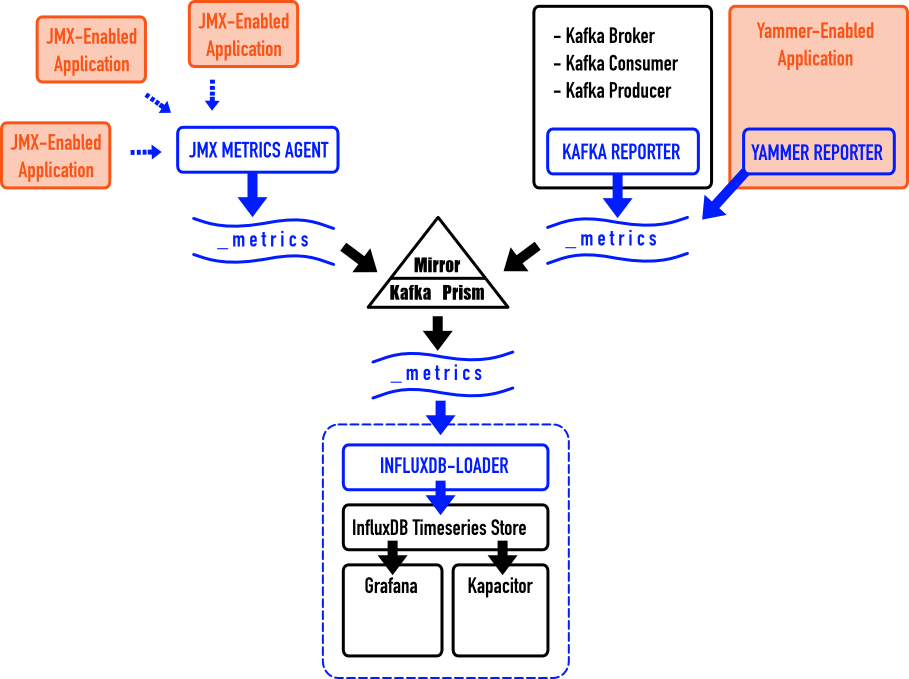
There are several ways of how the aggregation of metrics is achieved using one or more modules.
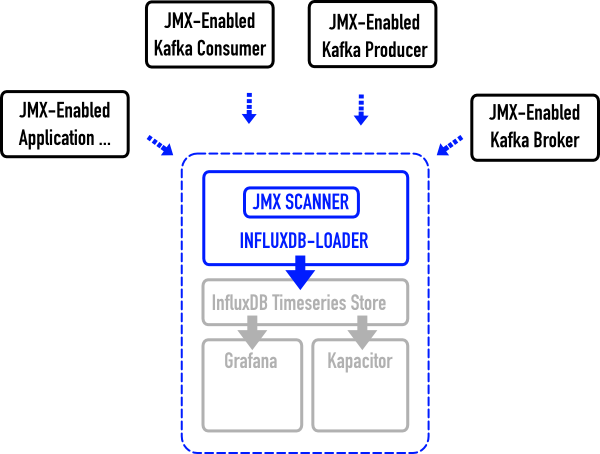
For smaller systems consisting of components on the same network or simply a localhost, direct JMX scanner tasks can be configured for each JMX Application. This method doesn't require to include any extra code in the monitored applications as long as they already expose JMX MBeans and in a local environment the kafka topic can also be omitted.
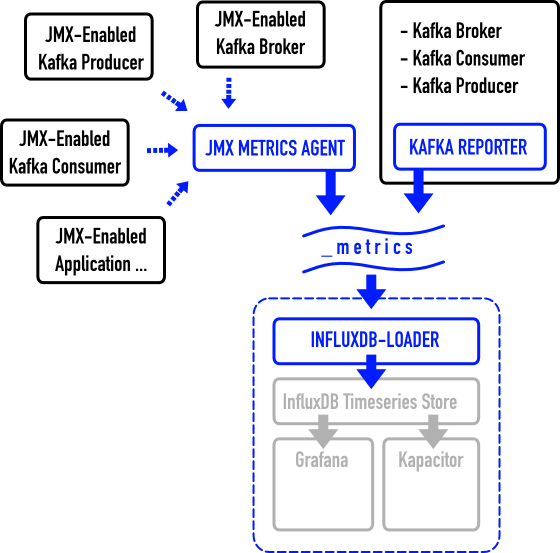
For bigger systems, where metrics from several hosts need to be aggregated or in cases where more fault-tolerant collection of metrics is required, a combination of pluggable TopicReproter or JMX Metrics Agent and a Kafka Topic can be deployed by configuration. The JMX Scanner used in the basic scenario is replaced with InfluxDB Loader which is a kafka consumer that reads measurements from the metrics topic and writes them into the InfluxDB.
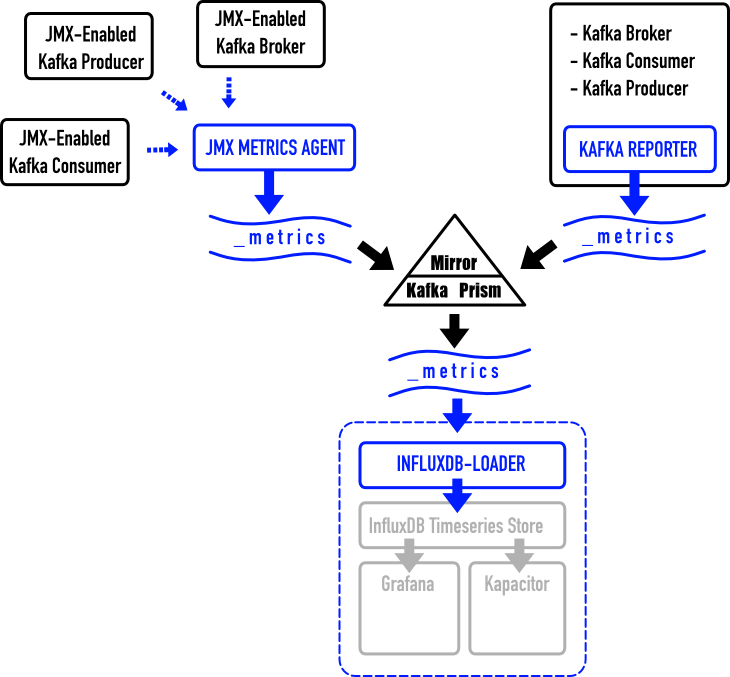
For multi-DC, potentially global deployments, where metrics from several disparate clusters need to be collected, each cluster has its agent which publishes into a local metrics topic and one of the existing mirroring components (Kafka Prism, Kafka Mirror Maker, ...) is deployed to aggregate local metrics topic into a single aggregated stream providing a real-time monitoring of the entire system.
Finally, in the heterogeneous environments, where different kinds of application and infrastructure stacks exist, firstly any JMX-Enabled or YAMMER-Enabled application can be plugged by configuration.
For non-JVM applications or for JVM applications that do not expose JMX MBeans, there is a work in progress to have REST Metrics Agent which can receive http put requests and which can be deployed in all scenarios either with or without the metrics topic.
First we need to build the project from source which requires at least java 1.7 installed on your system:
./gradlew build
There is a docker-compose.yml file that contains grafana, influxdb and kapactior images and a small script that starts and integrates them together:
./docker-instance.sh
Grafana UI should be now exposed at http://localhost:3000 - under Data Sources tab there should also be one item
named 'Kafka Metrics InfluxDB'. The next command will discover all topics the brokers on a local kafka broker
by looking into the zookeeper but you can replace the zookeeper connect string with your own:
./discovery/build/scripts/discovery --zookeeper "127.0.0.1:2181" --dashboard "my-kafka-cluster" \
    --dashboard-path $PWD/.data/grafana/dashboards --interval 25 \
    --influxdb  "http://root:root@localhost:8086" | ./influxdb-loader/build/scripts/influxdb-loader
The dashboard should be now accessible on this url:
http://localhost:3000/dashboard/file/my-kafka-cluster.json
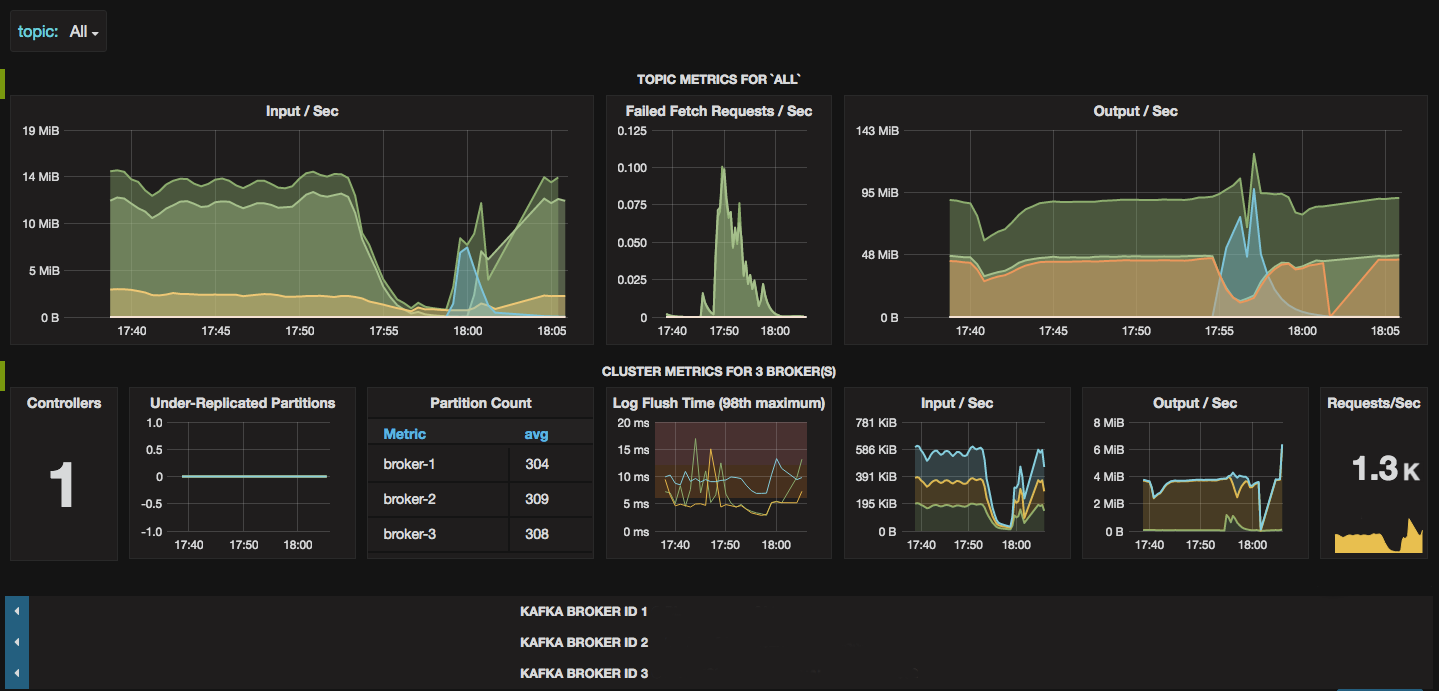
For a cluster of 3 brokers it might look like this:
Metrics Discovery tool can be used for generating configs and dashboards for existing Kafka Clusters. It uses Zookeeper Client and generates Grafana dashboards as json files and configurations for other Kafka Metrics modules into the STDOUT. The output configuration can be piped into one of the runtime modules, e.g. InfluxDBLoader or Metrics Agent. It is a Java Application and first has to be built with the following command:
./gradlew :discovery:build
./discovery/build/scripts/discovery \
    --zookeeper "localhost:2181" \
    --dashboard "local-kafka-cluster" \
    --dashboard-path "./.data/grafana/dashboards" \
    --influxdb "http://root:root@localhost:8086" | ./influxdb-loader/build/scripts/influxdb-loader
The above command discovers all the brokers that are part of the cluster and configures an influxdb-loader using local instance of InfluxDB. It also generates a dashboard for the discovered cluster which will be stored in the default Kafka Metrics instance.
On the Kafka Cluster:
./discovery/build/scripts/discovery \
    --zookeeper "<SEED-ZK-HOST>:<ZK-PORT>" \
    --dashboard "remote-kafka-cluster" \
    --topic "metrics" | ./metrics-agent/build/scripts/metrics-agent
On the Kafka Metrics instance:
./discovery/build/scripts/discovery \
    --zookeeper "<SEED-ZK-HOST>:<ZK-PORT>" \
    --topic "metrics" \
    --dashboard "remote-kafka-cluster" \
    --dashboard-path "./.data/grafana/dashboards" \
    --influxdb "http://root:root@localhost:8086" | ./influxdb-loader/build/scripts/influxdb-loader
InfluxDB Loader is a Java application which writes measurements into InfluxDB backend which can be configured
to scan the measurements from any number of JMX ports oand Kafka metrics topics.
In versions 0.9.+, the topic input functionality is replaced by the Metrics Connect module which utilizes Kafka Connect
framework. To build an executable jar, run the following command:
./gradlew :influxdb-loader:build
Once built, the loader can be launched with ./influxdb-loader/build/scripts/influxdb-loader by passing it
path to properties file containing the following configuration:
- InfluxDB Configuration (required)
- JMX Scanner Configuration (at least one scanner or consumer is required)
- Metrics Consumer Configuration (at least on scanner or consumer is required)
There is a few example config files under influxdb-loader/conf which explain how JMX scanners can be added.
If you have a Kafka Broker running locally which has a JMX Server listening on port 19092 and a docker instances of
InfluxDB and Grafana running locally, you can use the following script and config file to collect the broker metrics:
./influxdb-loader/build/scripts/influxdb-loader influxdb-loader/conf/local-jmx.properties
This module builds on Kafka Connect framework. The connector is jar that needs to be first built:
./gradlew :metrics-connect:build
The command above generates a jar that needs to be in the classpath of Kafka Connect which can be achieved
by copying the jar into libs directory of the kafka installation:
cp ./metrics-connect/build/lib/metrics-connect-*.jar $KAFKA_HOME/libs
Now you can launch for example kafka connect standalone connector with the following example configurations:
"$KAFKA_HOME/bin/connect-standalone.sh" "metrics-connect.properties" "influxdb-sink.properties" "hdfs-sink.properties"
First, metrics-connect.properties is the connect worker configuration which doesn't specify any connectors
but says that all connectors will use MeasurementConverter to deserialize measurement objects.
bootstrap.servers=localhost:9092
key.converter=org.apache.kafka.connect.storage.StringConverter
value.converter=io.amient.kafka.metrics.MeasurementConverter
...
The second configuration file is a sink connector that loads the measurements to InfluxDB, for example:
name=metrics-influxdb-sink
connector.class=io.amient.kafka.metrics.InfluxDbSinkConnector
topics=metric
...
The third configuration file is a sink connector that loads the measurements to hdfs, for example as parquet files:
name=metrics-hdfs-sink
topics=metrics
connector.class=io.confluent.connect.hdfs.HdfsSinkConnector
format.class=io.confluent.connect.hdfs.parquet.ParquetFormat
partitioner.class=io.confluent.connect.hdfs.partitioner.TimeBasedPartitioner
path.format='d'=YYYY'-'MM'-'dd/
partition.duration.ms=86400000
locale=en
timezone=Etc/GMT+1
...
The purpose of the agent is to move expensive metrics collection like JMX polling closer to the application and publish these into the kafka metrics topic. The JMX scanners can be configured in the same way as with InfluxDB Loader except the InfluxDB backend connection is replaced with kafka metrics producer which publishes the measurements into a kafka topic. It is also a Java application and the executable jar can be built with the following command:
./gradlew :metrics-agent:build
To run the agent instance, a configuration file is required, which should contain the following sections: - JMX Scanner Configuration - Metrics Producer Configuration
./metrics-agent/build/scripts/kafka-metrics-agent <CONFIG-PROPERTIES-FILE>
The Topic Reporter provides a different way of collecting metrics from Kafka Brokers, Producers, Consumers and Samza
processors - each of these expose configuration options for plugging a reporter directly into their runtime and the
class io.amient.kafka.metrics.TopicReporter can be used in either of them. It translates the metrics to kafka metrics
measurements and publishes them into a topic.
This reporter publishes all the metrics to configured, most often local kafka topic metrics. Due to different stage of
maturity of various kafka components, watch out for subtle differences when adding TopicReporter class. To be able to
use the reporter as plug-in for kafka brokers and tools you need to put the packaged jar in their classpath, which in
kafka broker means putting it in the kafka /libs directory:
./gradlew :metrics-reporter:build
cp stream-reporter/build/lib/stream-reporter-*.jar $KAFKA_HOME/libs/
The reporter only requires one set of configuration properties: - Metrics Producer Configuration
add following properties to the configuration for the component
kafka.metrics.reporters=io.amient.kafka.metrics.TopicReporter
kafka.metrics.polling.interval.secs=10
kafka.metrics.topic=_mterics
#kafka.metrics.<TAG>=<VALUE>
#kafka.metrics.<CONFIGURATION-OPTIONS>...
metric.reporters=io.amient.kafka.metrics.TopicReporter
kafka.metrics.<CONFIGURATION-OPTIONS>...
Like any other yammer metrics reporter, given an instance (and configuration), once started, the reporter will produce kafka-metrics messages to a configured topic every given time interval. Scala-Maven Example:
...
<dependency>
   <groupId>io.amient.kafka.metrics</groupId>
   <artifactId>metrics-reporter</artifactId>
   <version>${kafka.version}</version>
</dependency>
...
... Using builder for programmatic initialization
val registry = MetricsRegistry.defaultRegistry()
val reporter = TopicReporter.forRegistry(registry)
    .setTopic("metrics") //this is also default
    .setBootstrapServers("kafka1:9092,kafka2:9092")
    .setTag("host", "my-host-xyz")
    .setTag("app", "my-app-name")
    .build()
reporter.start(10, TimeUnit.SECONDS);
... OR Using config properties:
val registry = MetricsRegistry.defaultRegistry()
val config = new java.util.Properties(<CONFIGURATION-OPTIONS>)
val reporter = TopicReporter.forRegistry(registry).configure(config).build()
reporter.start(10, TimeUnit.SECONDS);
The InfluxDB Loader and Metrics Connect use the same code which understands json messages that Samza generates using MetricsSnapshotSerdeFactory. So just a normal samza metrics configuration without additional code, for example:
metrics.reporters=topic
metrics.reporter.topic.class=org.apache.samza.metrics.reporter.MetricsSnapshotReporterFactory
metrics.reporter.topic.stream=kafkametrics.metrics
serializers.registry.metrics.class=org.apache.samza.serializers.MetricsSnapshotSerdeFactory
systems.kafkametrics.streams.metrics.samza.msg.serde=metrics
systems.kafkametrics.samza.factory=org.apache.samza.system.kafka.KafkaSystemFactory
systems.kafkametrics.consumer.zookeeper.connect=<...>
systems.kafkametrics.producer.bootstrap.servers=<...>
The following configuration is required for modules that need to write to InfluxDB backend:
| parameter | default | description |
|---|---|---|
| influxdb.database | metrics |
InfluxDB Database Name where to publish the measurements |
| influxdb.url | http://localhost:8086 |
URL of the InfluxDB API Instance |
| influxdb.username | root |
Authentication username for API calls |
| influxdb.password | root |
Authentication passord for API calls |
The following configuration options can be used with the InfluxDB Loader and MetricsAgent:
| parameter | default | description |
|---|---|---|
| jmx.{ID}.address | - | Address of the JMX Service Endpoint |
| jmx.{ID}.query.scope | *:* |
this will be used to filer object names in the JMX Server registry, i.e. *:* or kafka.*:* or kafka.server:type=BrokerTopicMetrics,* |
| jmx.{ID}.query.interval.s | 10 | how frequently to query the JMX Service |
| jmx.{ID}.tag.{TAG-1} | - | optinal tags which will be attached to each measurement |
| jmx.{ID}.tag.{TAG-2} | - | ... |
| jmx.{ID}.tag.{TAG-n} | - | ... |
The following configuration options can be used with the TopicReporter and MetricsAgent:
| parameter | default | description |
|---|---|---|
| kafka.metrics.topic | metrics |
Topic name where metrics are published |
| kafka.metrics.polling.interval | 10s |
Poll and publish frequency of metrics, llowed interval values: 1s, 10s, 1m |
| kafka.metrics.bootstrap.servers | inferred | Coma-separated list of kafka server addresses (host:port). When used in Brokers, localhost is default. |
| kafka.metrics.tag..<tag=value> | - | Fixed name-value pairs that will be used as tags in the published measurement for this instance, .e.g kafka.metrics.tag.host.my-host-01 or kafka.metrics.tag.dc.uk-az1 |
The following configuration options can be used with the modules that use Kafka consumer to get measurements:
| parameter | default | description |
|---|---|---|
| consumer.topic | metrics |
Topic to consumer (where measurements are published by Reporter) |
| consumer.numThreads | 1 |
Number of consumer threads |
| consumer.zookeeper.connect | localhost:2181 |
As per Kafka Consumer Configuration |
| consumer.group.id | - | As per Any Kafka Consumer Configuration |
| consumer.... | - | Any other Kafka Consumer Configuration |
Using kafka console consumer with a formatter for kafka-metrics:
./bin/kafka-console-consumer.sh --zookeeper localhost --topic metrics --formatter io.amient.kafka.metrics.MeasurementFormatter
https://github.com/amient/kafka-metrics/issues
Kafka Metrics is closely related to Apache Kafka and from this perspective it can be viewed as having 2 dimensions:
- general functionality - concepts that are available regardless of Kafka version
- version-specific functionality - implementation details that are specific/missing/added in concrete Kafka version
We need this to be able to support variety of real-world setups which may use different Apache Kafka versions in their infrastructure. For this reason, we maintain active branches for each version of Apache Kafka project starting from version 0.8.2.1.
When considering a new general feature, like for example having a first-class collectd integration, it should be considered how this will work in different versions and then design the API appropriately such that it can be easily merged and ported in each active branch.
Once designed, the general features should be implemented against the master branch which is linked to
the latest official release of Apache Kafka and once this is fully working a pull request against the master can be made.
As part of merging the pull request, the feature must be back-ported to all supported versions.
In case of using a new features of Apache Kafka which are not available in the previous versions actively supported by this project, an attempt should be made to design the desired general functionality in such way that the older version can merge and emulate the missing feature internally. Good example for this is using Kafka Connect features in place of InfluxDB Loader that consumes measurement messages from Kafka topic and writes them to InfluxDb. The general feature here is to be able to publish measurements into InfluxDB from a Kafka topic. In 0.8.x versions we can use a custom Kafka Consumer (implemented in the core module as MetricsConsumer class) but in 0.9.x+ releases we can use a Connector implementation that can be used in a Kafka Connect context. There is a re-design ticket which addresses the point of having the internal API flexible enough to allow for these 2 different ways of implementing it: issues/12
Additional layer of complexity is different versions of InfluxDB. To keep things simple we are not attempting to support multiple versions of InfluxDB protocol and use the latest available. It is possible to support different time-series backends but in the world of monitoring there are already a plenty of ways to integrate with InfluxDB so for now we keep this option closed unless this becomes an actual pain that cannot be solved otherwise.
If you'd like to contribute, please open an issue to start a discussion about the idea or enter discussion of an existing one and we'll take it from there.
