This project is a part of James Rocco Research Scholarship provided by Lake Forest College and was carried out under the supervision of Prof. Arthur Bousquet. The main idea is based on an article by Graciela Carrillo posted on Towards Data Science.
Using Anaconda create a new environment from environment.yml.
conda env create --file environment.ymlTo conveniently read all the notebooks follow this link.
Notebooks/:
- EDA.ipynb (Exploratory Data Analysis) - A brief overview and analysis of raw data
- kepler_map.ipynb - Visualization of the whole dataset using Kepler.gl
- data_preprocessing.ipynb - Preprocessing the data for future uses (outlier detection, feature selection, handling missing data, etc.)
- regressions.ipynb - Development of initial price prediction models
- cta_mapping.ipynb - Visualization of geo_loc.py using Folium maps (Map of routes to CTAs in the radius and shortest path detection)
- model.ipynb - Final model for price prediciton that compares the results of datasets with and without newly produced variables
Scripts:
- geo_loc.py - A python script for geospatial analysis: creates 5 new variables using such libraries as OSMnx and OpenRouteSerivce:
- Restaurants - Number of restaurants in a 1000 meters radius
- Cafes - Number of cafes in the radius
- Bars - Number of bard in the radius
- CTA - Number of CTA (Chicago Subway) stations in the radius
- time_to_cta_minutes - Time in minutes to the nearest CTA station (can be out of the radius)
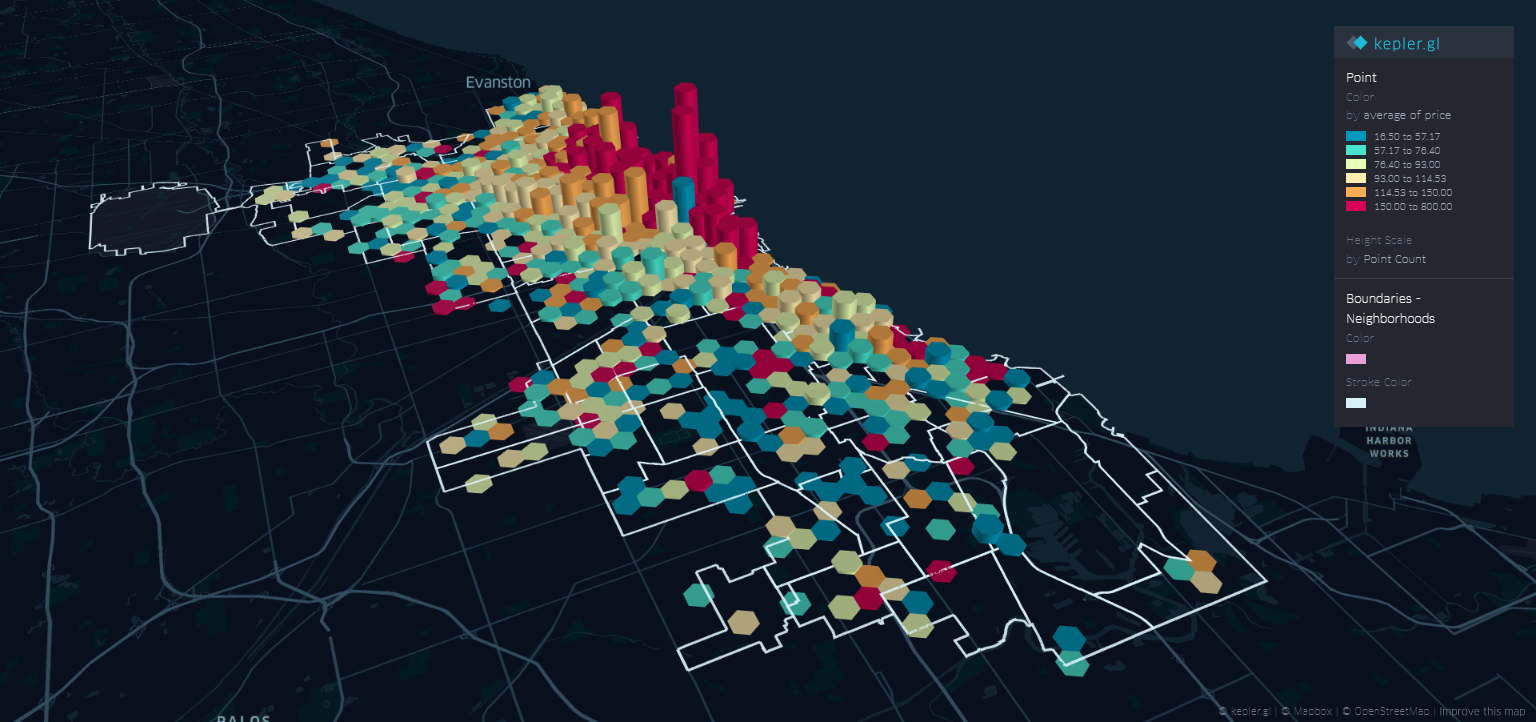
The main goal of this project is to build a model that predicts the price of a listing given its dependent variables. The data for both dependent and independent variables is available through Insideairbnb.com. To get a general understanding of the data used for this project, take a look at the map below where the data is projected on the map of Chicago. Listings (i.e. rows in the dataset) are grouped within hexagons whose height represents the listings count and the color represents the price range.
The accuracy, i.e. how well the model performs, is measured by R^2 a metric commonly used for regression models that represents the proportion of the variance for a dependent variable that's explained by independent variables. To further improve the accuracy and add originality to the project, 5 new variables are created by analyzing surrounding areas and fetching distances to chosen types of locations as well as calculating the walking time to the nearest subway station.
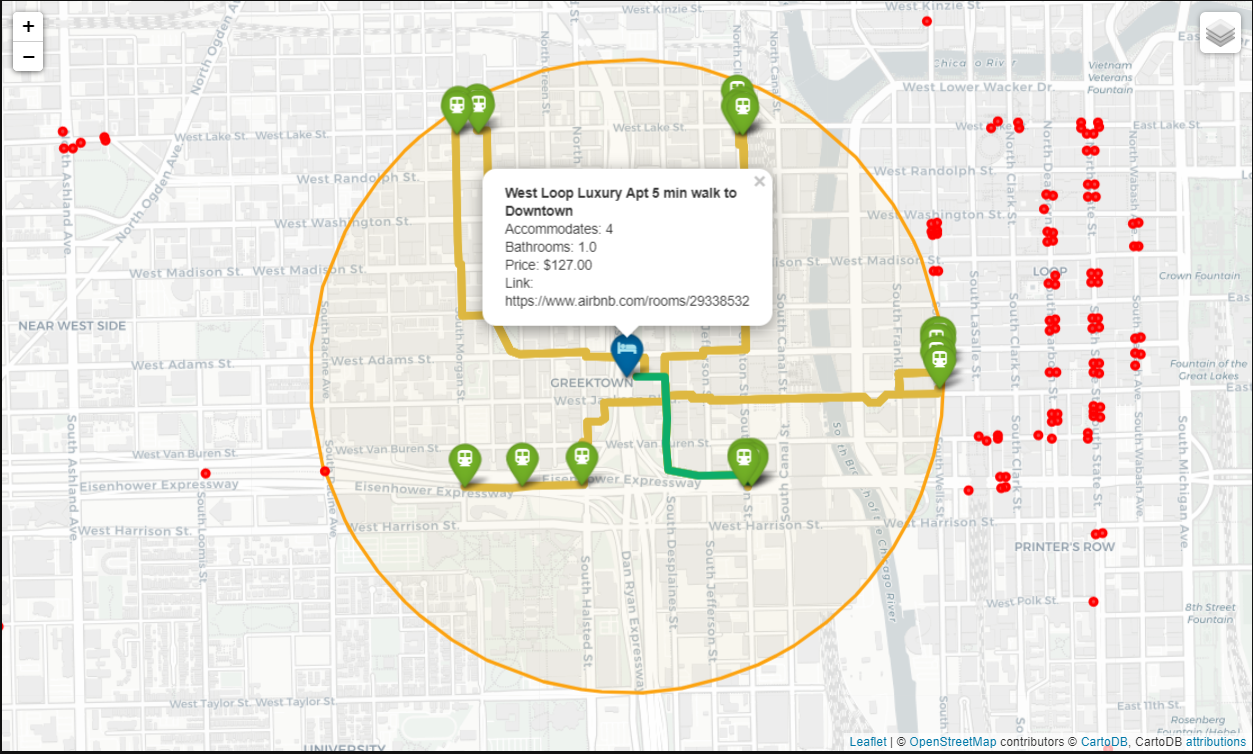
Since it is possible to visualize locations and routes, below you can see a map with routes to all subway stations within the range of 1000m (the circle) and with the shortest route colored in green. Red dots represent subway station that lie outside the wanted radius.
Here is the list of variables used to predict the price of a listings:
Numerical variables:
- Accommodates - Number of people a listing can accommodate
- Bathrooms - Number of bathrooms
- Minimum_nights - Minimum amount of nights a listing should be booked for
- Maxium_nights - Maximum amount of nights a listing can be booked for
- Availability_30 - Number of days a listing is available in the next 30 days
- Number_of_reviews - Total number of reviews
- Number_of_reviews_ltm - Number of reviews within last month
- Restaurants, Bars, Cafes, Universities - Number of places of specified type within 1000 meters from the listing (4 different variables)
- Time_to_cta_minutes - Time it takes to walk to the nearest subway (in Chicago CTA) station (Distance does not matter)
Categorical variables:
- Neighbourhood_cleansed - name of the neighborhood a listing is located in
- Property_type - type of property a listing is located in (e.g. Apartment, Condomonium, House, etc.)
- Bed_type - type of bed present in a listing
- Cancellation_policy - type of cancellation policy chosen by the host
As it can be apparent from file descriptions, a step-by-step approach was taken to build the model. To understand the model and the thought process you can read through the notebooks.
To achieve the best possible result I tried various models and these are the results:
| _ | Linear Regression | Lasso Regression | Ridge Regression | Lasso Regression with Polynomial Features | Ridge Regression with Polynomial Features | XGBoost |
|---|---|---|---|---|---|---|
| No new variables: Train R2 |
0.4298 | 0.4294 | 0.4296 | 0.4918 | 0.5143 | 0.6428 |
| Test R2 | 0.4607 | 0.462 | 0.4615 | 0.4867 | 0.4925 | 0.5391 |
| With new variables: Train R2 |
0.4387 | 0.4375 | 0.4384 | 0.5036 | 0.5224 | 0.6742 |
| Test R2 | 0.411 | 0.4163 | 0.4129 | 0.4503 | 0.453 | 0.5445 |
A good way to see the difference in modeling between the data without and with the new variables is to look at feature importances computed by XGBoost. Categorical variables are not included not to overcrowd the plot.
As we can see on the bottom plot the new features possess high importance (higher than some of the initial features).
Machine Learning Tutorial Playlist
Complete Machine Learning Course by Andrew NG
Airbnb Price Prediction Using Linear Regression (Scikit-Learn and StatsModels)
Ridge and Lasso Regression: L1 and L2 Regularization
Predicting Airbnb prices with machine learning and location data
Exploring Airbnb prices in London: which factors influence price?
How to calculate Travel time for any location in the world
Find and plot your optimal path using OSM, Plotly and NetworkX in Python
Loading Data from OpenStreetMap with Python and the Overpass API


