istio-newrelic
Hacking istio to have proper distributed traces in NewRelic
Disclaimer: Code in this solution is not production ready
problem statement
If you are using Istio in your Kubernetes cluster you probably want to achieve higher observability with Distibuted Tracing.
And if you are using NewRelic as the monitoring platform then you want traces to be visible in NewRelic Distributed Tracing
And when you add tracing with NewRelic agent to you application, it will start sending data to NewRelic abount incoming requests and adding W3C headers to outgoing requests.
But there is one small problem — Istio of the box is not supporting W3C headers.
So in the end you will receive unconnected spans originated from istio-proxy/envoy sidecars and gateways and NewRelic agent in your application.
let's get our hands dirty
I'm using using Docker Desktop Kubernets cluster for testing.
Istio — v1.6.0.
Fist, let's install istio from a little bit modified, but still off-the-shelf profile (istio directory):
cd istio
kubectl create namespace istio-system
./install-shelf.sh
Please check pods in istio-system namespace, they should be up and running.
$ kubectl -n istio-system get pods
NAME                                    READY   STATUS    RESTARTS   AGE
istio-ingressgateway-85cf5b655f-km6qk   1/1     Running   0          4m30s
istiod-7f494bfdc8-9vtxg                 1/1     Running   0          4m42s
With this profile there will be no zipkin/jaeger installed.
That's because you need to add some headers before sending data to NewRelic trace api:
 Api-Key: [API KEY HERE]
 Data-Format: zipkin
 Data-Format-Version: 2
nr-tracing proxy
So we will just write a little go application that will act like a jaeger and proxy data to NewRelic. Code is in nr-tracing directory.
It will read following environmental variables:
- PORT — port to listen, default 8080
- NEW_RELIC_API_KEY — your Insert API key
- NEW_RELIC_TRACE_URL —
https://trace-api.newrelic.com/trace/v1if you are using US NewRelic data centers andhttps://trace-api.eu.newrelic.com/trace/v1in case of EU data centers
Next, build and push docker image for it. Please adjust script to your docker registry.
nr-app
Let's build some simple web service and instrument it with NewRelic agent. Code is in nr-app directory.
The service will listen to GET /api/* and:
- if no
UPSTREAM_URLenv variable configured — response with[terminating upstream got <path>]text/plain response - if
UPSTREAM_URLis set — send aGETrequest to upstream and response to client with upstream reqeust
Before calling upstream app will create a span (segment in terms of NewRelic Agent API):
es := newrelic.StartExternalSegment(txn, req)
res, err := client.Do(req)
es.End()
Again, let's push this image to some docker registry.
running in k8s
In k8s directory there are kubernetes and kustomize manifests.
gw.yaml         - istio ingress gateway configuration with "*" match
nr-app-a.yaml   — application with upstream configured to http://b.svc.cluster.local
nr-app-b.yaml   — application with no upstream
nr-tracing.yaml — nr-tracing proxy and "zipkin" service
ns-nr-app.yaml  — namespace nr-app
Please alter image fields in deployments to reflect your docker registry.
You will need to also create two .env files in k8s directory — one for nr-app and second for nr-tracing:
# nr-app.env
NEW_RELIC_LICENSE_KEY=<your NewRelic license key>
# nr-tracing.env
NEW_RELIC_API_KEY=<your Insert API key>So, lets spin it up in our kubernetes cluster
kustomize build k8s | kubectl apply -fCheck the pods:
$ kubectl -n istio-system get pods
NAME                                    READY   STATUS        RESTARTS   AGE
istio-ingressgateway-85cf5b655f-km6qk   1/1     Running       0          33m
istiod-7f494bfdc8-9vtxg                 1/1     Running       0          33m
nr-tracing-74b74677f9-7v9jp             0/1     Running       0          10s

$ kubectl -n nr-app get pods
NAME                        READY   STATUS    RESTARTS   AGE
nr-app-a-7b47d854d5-z9rwg   2/2     Running   0          38s
nr-app-b-858db66f6d-x9mtd   2/2     Running   0          37s
Let's check envoy proxy configuration:
$ istioctl -n nr-app proxy-config bootstrap nr-app-a-7b47d854d5-z9rwg

...
  "clusters": [
    ...
      {
      "name": "zipkin",
      "type": "STRICT_DNS",
      "connectTimeout": "1s",
      "loadAssignment": {
          "clusterName": "zipkin",
          "endpoints": [
              {
                  "lbEndpoints": [
                      {
                          "endpoint": {
                              "address": {
                                  "socketAddress": {
                                      "address": "zipkin.istio-system",
                                      "portValue": 9411
                                  }
                              }
                          }
                      }
                  ]
              }
          ]
      },
  ]
  ...
  "tracing": {
      "http": {
          "name": "envoy.zipkin",
          "typedConfig": {
              "@type": "type.googleapis.com/envoy.config.trace.v2.ZipkinConfig",
              "collectorCluster": "zipkin",
              "collectorEndpoint": "/api/v2/spans",
              "traceId128bit": true,
              "sharedSpanContext": false,
              "collectorEndpointVersion": "HTTP_JSON"
          }
      }
  },
So, tracing should work now? Let's try:
curl localhost:80/api/
[terminating upstream got /api/]%
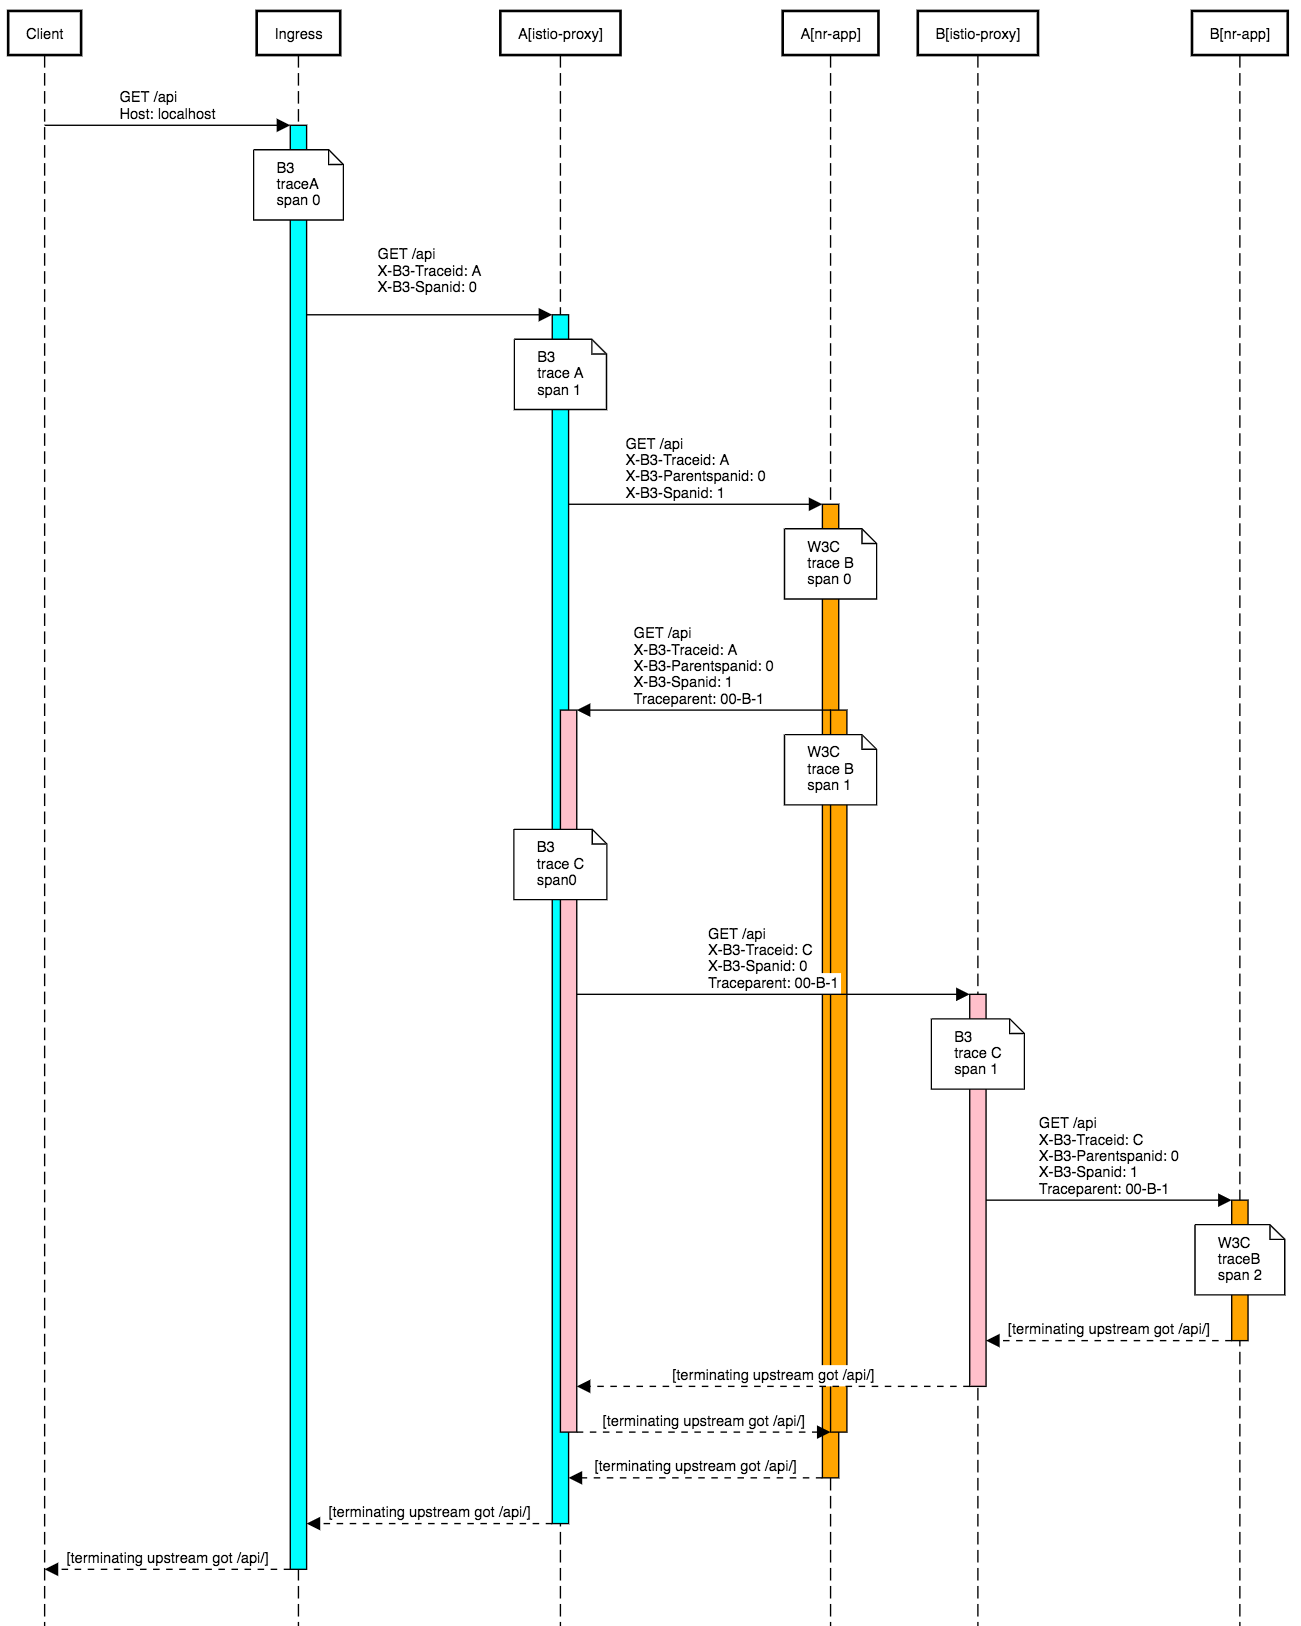
But we don't have istio-ingress here. What is actually happening now — we have 3 trace forests:
Why?
- istio starts one forest with ingress-gateway
- it comes to application
A— and it lost traces, because they are in B3 format - application
Astarts a new forest — with NewRelic and W3C headers - application
Acalls applicationBwith W3C headers (second forest) - this request is intercepted by istio-proxy which adds third forest — first one is lost by app
so we are lost?
Actually Envoy supports W3C headers with OpenCensus adapter: https://www.envoyproxy.io/docs/envoy/latest/api-v3/config/trace/v3/opencensus.proto.html
And even more, Istio is actually using OpenCensus but only to work with StackDriver: https://github.com/istio/istio/blob/1.6.0/tools/packaging/common/envoy_bootstrap_v2.json#L568
So, let's hack this file a little bit and put it inside our docker image: [istio/envoy_bootstrap_v2.json]
Next, we need to alter profile a little to use our own images instead for officail istio. Anyway, you are always syncing images to private registry before using them in production?
cd istio
./install-hack.sh
We will need to restart our applications as well to get new proxy image and config.
kubectl -n nr-app rollout restart deploy/nr-app-a
kubectl -n nr-app rollout restart deploy/nr-app-b
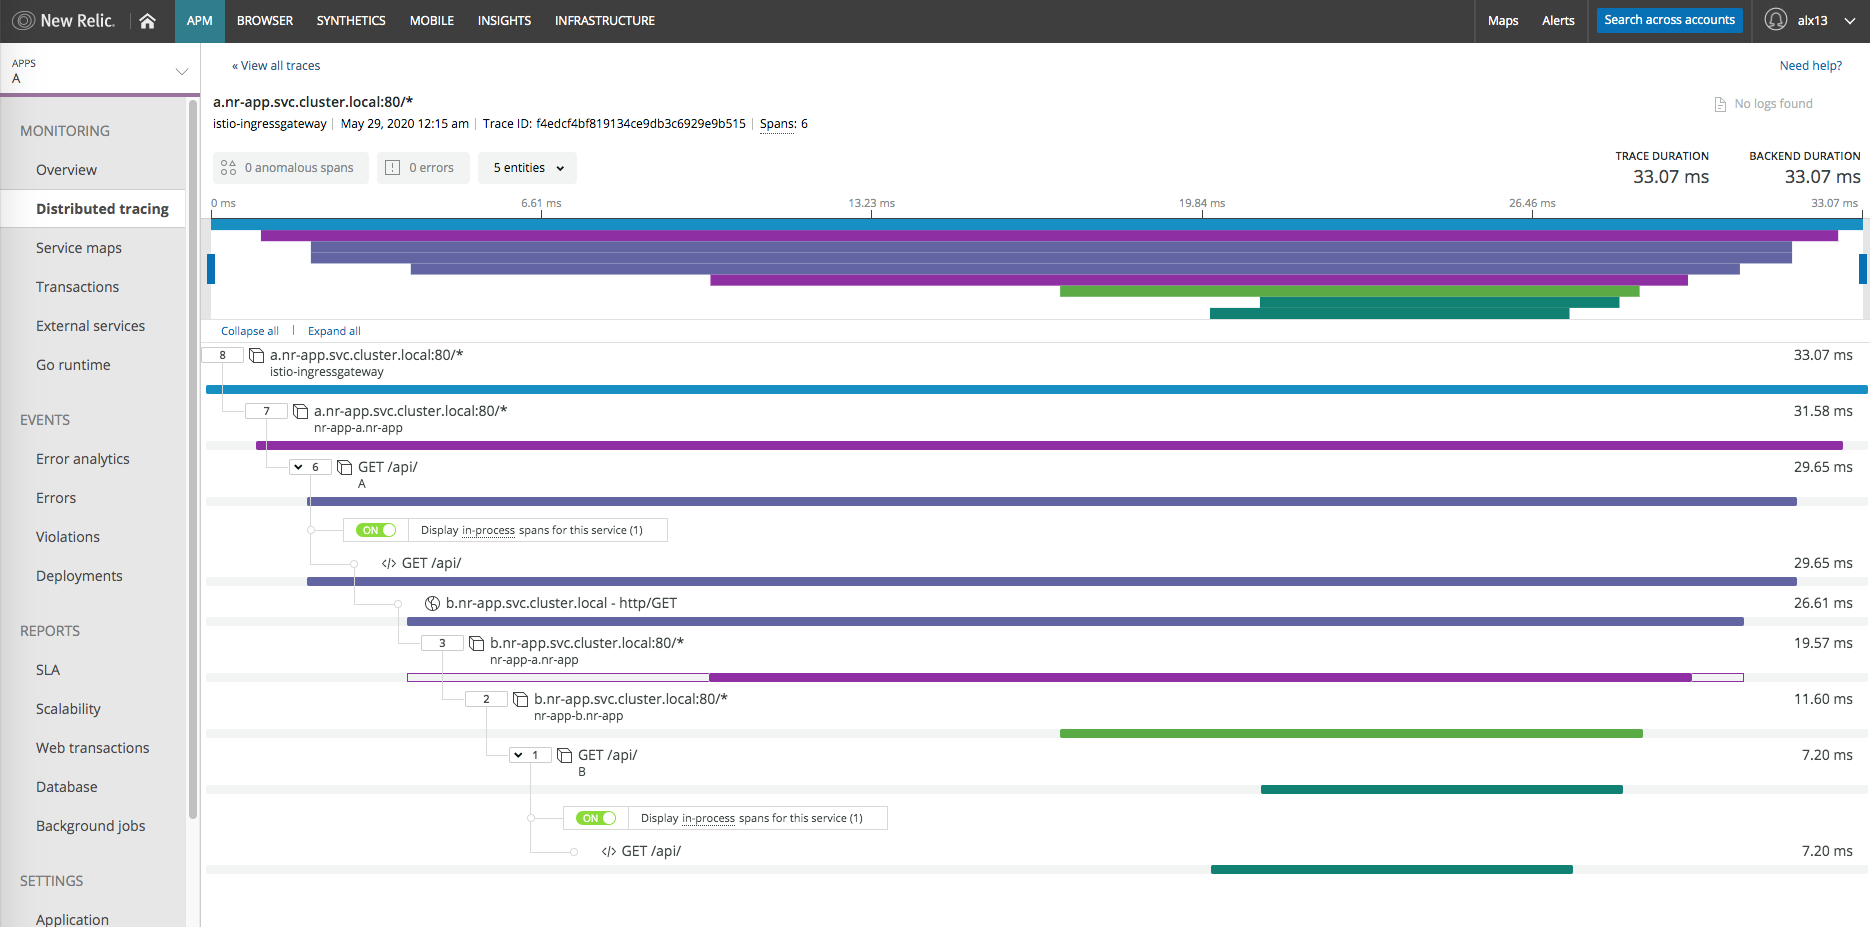
Let's test again:
curl localhost/api/ --verbose

