
This project serves as a practical exercise in system administration: A secure virtual machine is configured, involving user authentication, firewall rules, and system monitoring, with a focus on Linux system administration and network security.
Rather than providing another step-by-step installation guide, this documentation highlights certain challenges I noticed during evaluations, which are also overlooked by many online guides for this project.
- Operating System Configuration: Set up a Debian server with minimal services and create partitions using LVM.
- User and Group Management: Manage users and groups through sudoers configuration for controlled access and privileges.
- Security Measures: Implement robust security protocols, covering SSH configuration, root access restriction, UFW setup, and enforcing a stringent password policy.
- System Monitoring Script: Develop a monitoring.sh bash script to provide regular system information updates on all terminals at predefined intervals.
- WordPress Website Setup: Host a WordPress website using lighttpd, MariaDB, and PHP.
I used the following guides to set up my virtual machine, acknowledging certain limitations as highlighted in the sections below:
- Born2BeRoot Guide by Pasquale Rossi.
- born2beroot-42network-cursus by Youssef Oussama.
- For explaining concepts: born2beroot by Pablo Gómez Álvarez.
- Download the latest version of Debian here.
- To install Debian with the specified partitions as mentioned in the bonus section, I followed this video guide by Youssef Oussama.
⚠️ Ensure that you install the server on 42's shared storage space "sgoinfre." Be mindful not to exceed the disk space limits specified by your school's policy (the partition sizes presented in the project's subject are examples; a total size of ~8 GB should work just fine).⚠️ Note how the volume "var--log" (as listed withlstblk) is named "var-log" during setup (see 7:50 timestamp in the video guide). Naming it "var--log" would result in a volume called "var----log".
During OS Installation:
- I recommend adhering to the password policy when setting up passwords for both the root and main user. Also, please keep following the same policy for accessing the encrypted partition; even if it's not explicitly specified in the subject, it is still good practice. By establishing strong passwords from the beginning, you can avoid the need to change them later and mitigate the risk of forgetting about it, as there is no prompt for rule changes.
Editing Password Settings:
⚠️ Some guides only change settings in/etc/pam.d/common-password. However, this doesn't affect password requirements for existing users (root, main) when changing the password (passwd username). Ensure that you edit/etc/security/pwquality.confinstead for these changes to take effect.⚠️ After editing the password aging settings in/etc/login.defs, make sure to manually apply corresponding policies to existing users using commands likechage -m 2 -M 30 -W 7 rootorchage -m 2 -M 30 -W 7 username. Check password aging settings viasudo chage -l username.
Testing Password Policy Setup:
- Test the correctness of the password policy setup by creating a user and providing a 'bad' password, e.g. by simply pressing 'Enter' when asked for one (
sudo adduser test_user). Although this user will be created, attempting to log in or switch to the user should prompt for a password that was not set up, rendering the user effectively unusable. Make sure to use the '-r' flag to remove the user along with the user's home directory and its contents:sudo userdel -r test_user.
-
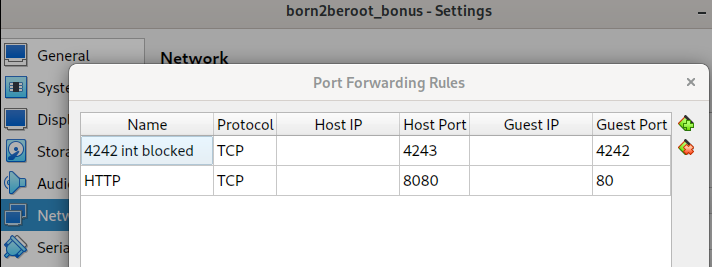
The project's specifications require the SSH service to run on port 4242 exclusively. However, there's a chance that this port is already in use on your network. In such cases,
ssh username@localhost -p 4242may not work for logging into your server ('guest') from your machine ('host'). To address this, you can use port forwarding, allowing you to log in using a different port. For example, with the setup below,ssh username@localhost -p 4243does the trick. -
In VirtualBox, open the settings of your virtual machine/server -> Network -> Advanced (Adapter 1) -> Port Forwarding.
- When modifying the sudoers file, use
sudo visudoinstead of calling an editor (e.g.,sudo nano /etc/sudoers). Visudo not only grants you access to edit the sudoers file but also performs syntax checking, reducing the risk of errors that could potentially lock you out of sudo access.
- As with everything you find online: Take it with a grain of salt and make sure to understand and test before implementing it into your own project. I've encountered a few monitoring scripts that were not 100% correct (e.g., counting the header line of a table showing TCP connections, therefore always being "1" too much).
- Here is my monitoring script; please do not copy and paste it before testing it yourself! ;)
#!/bin/bash

# ARCH
arc=$(uname -a)

# CPU PHYSICAL
cpu_p=$(grep "physical id" /proc/cpuinfo | sort | uniq | wc -l)

# CPU VIRTUAL
cpu_v=$(grep "^processor" /proc/cpuinfo | wc -l)

# RAM
ram_total=$(free -m | awk '$1 == "Mem:" {print $2}')
ram_use=$(free -m | awk '$1 == "Mem:" {print $3}')
ram_perc=$(free | awk '$1 == "Mem:" {printf("%.2f"), $3/$2*100}')

# DISK
disk_total=$(df -BG | grep '^/dev/' | grep -v '/boot$' | awk '{ft += $2} END {print ft}')
disk_use=$(df -BM | grep '^/dev/' | grep -v '/boot$' | awk '{ut += $3} END {print ut}')
disk_perc=$(df -BM | grep '^/dev/' | grep -v '/boot$' | awk '{ut += $3} {ft+= $2} END {printf("%d"), ut/ft*100}')

# CPU LOAD
cpu_l=$(top -bn1 | grep '^%Cpu' | cut -c 9- | xargs | awk '{printf("%.1f%%"), $1 + $3}')

# LAST BOOT
lb=$(who -b | awk '$1 == "system" {print $3 " " $4}')

# LVM USE
lvmu=$(if [ $(lsblk | grep "lvm" | wc -l) -eq 0 ]; then echo no; else echo yes; fi)

# TCP CONNECTIONS
tcpc=$(ss -neopt state established | grep -v "Recv-Q" | wc -l)

# USER LOG
ulog=$(users | wc -w)

# NETWORK
ip=$(hostname -I)
mac=$(ip link show | grep "ether" | awk '{print $2}')

# SUDO COMMANDS
cmds=$(journalctl _COMM=sudo | grep COMMAND | wc -l)

# Multiline message
message="
     #Architecture: $arc
     #CPU physical: $cpu_p
     #vCPU: $cpu_v
     #Memory Usage: $ram_use/${ram_total}MB ($ram_perc%)
     #Disk Usage: $disk_use/${disk_total}GB ($disk_perc%)
     #CPU load: $cpu_l
     #Last boot: $lb
     #LVM use: $lvmu
     #Connections TCP: $tcpc ESTABLISHED
     #User log: $ulog
     #Network: IP $ip ($mac)
     #Sudo: $cmds commands"

# Send the message to all logged-in users
echo "$message" | wall`-
arc=$(uname -a)- Purpose: Retrieves system architecture information.
- Explanation: The
uname -acommand prints system information, including the system architecture (e.g., x86_64), kernel version, and other details.
-
cpu_p=$(grep "physical id" /proc/cpuinfo | sort | uniq | wc -l)- Purpose: Counts the number of physical CPUs.
- Explanation: This line uses a series of commands to extract unique physical CPU IDs from
/proc/cpuinfo, sorts them, and counts the unique IDs usingwc -l(number of output lines).
-
cpu_v=$(grep "^processor" /proc/cpuinfo | wc -l)- Purpose: Counts the number of virtual CPUs.
- Explanation: This line counts the number of lines starting with "processor" in
/proc/cpuinfo, representing virtual CPUs.
-
ram_total=$(free -m | awk '$1 == "Mem:" {print $2}')- Purpose: Retrieves total RAM in megabytes.
- Explanation: Uses the
free -mcommand to display memory information in megabytes, then usesawkto extract the total RAM (in MB) from the line starting with "Mem:".
-
ram_use=$(free -m | awk '$1 == "Mem:" {print $3}')- Purpose: Retrieves used RAM in megabytes.
- Explanation: Similar to the previous line, extracts the used RAM (in MB) from the "Mem:" line using
awk.
-
ram_perc=$(free | awk '$1 == "Mem:" {printf("%.2f"), $3/$2*100}')- Purpose: Calculates the percentage of used RAM.
- Explanation: Uses
awkto calculate the percentage of used RAM and formats the result to two decimal places. It divides used memory ($3) by total memory ($2) and multiplies by 100.
-
disk_total=$(df -BG | grep '^/dev/' | grep -v '/boot$' | awk '{ft += $2} END {print ft}')- Purpose: Calculates total disk space in gigabytes.
- Explanation: Uses
df -BGto display disk space information in gigabytes, filters lines starting with '/dev/' excluding '/boot', and calculates the total disk space by summing up the second field ($2).
-
disk_use=$(df -BM | grep '^/dev/' | grep -v '/boot$' | awk '{ut += $3} END {print ut}')- Purpose: Calculates used disk space in megabytes.
- Explanation: Similar to the previous line, calculates the total used disk space by summing up the third field (
$3).
-
disk_perc=$(df -BM | grep '^/dev/' | grep -v '/boot$' | awk '{ut += $3} {ft+= $2} END {printf("%d"), ut/ft*100}')- Purpose: Calculates the percentage of used disk space.
- Explanation: Calculates the percentage of used disk space by dividing used disk space (
ut) by total disk space (ft), multiplying by 100, and formatting the result as an integer.
-
cpu_l=$(top -bn1 | grep '^%Cpu' | cut -c 9- | xargs | awk '{printf("%.1f%%"), $1 + $3}')- Purpose: Retrieves CPU load percentage.
- b: batch (snapshot) → not dynamic/real-time updates
- n1: runs for a single iteration and then stops
- Explanation: Uses
topto get CPU usage information, extracts the CPU load percentage, and formats the result to one decimal place (xargstakes the output of the previous command and converts it into arguments, turning the multi-column output into a single line of space-separated values).
-
lb=$(who -b | awk '$1 == "system" {print $3 " " $4}')- Purpose: Retrieves the last system boot time.
- Explanation: Uses
who -bto get information about the last system boot and extracts the date and time.
-
lvmu=$(if [ $(lsblk | grep "lvm" | wc -l) -eq 0 ]; then echo no; else echo yes; fi)- Purpose: Checks if Logical Volume Management (LVM) is in use.
- Explanation: Uses
lsblkto check if any block devices mention "lvm." If the count is zero, it echoes "no"; otherwise, it echoes "yes".
-
tcpc=$(ss -neopt state established | grep -v "Recv-Q" | wc -l)- Purpose: Counts established TCP connections.
- Explanation: Uses
ssto list established TCP connections and counts the lines.grep -v "Recv-Q"excludes the header line
-
ulog=$(users | wc -w)- Purpose: Counts the number of logged-in users.
- Explanation: Uses
usersto list logged-in users andwc -wto count the number of words (users).
-
ip=$(hostname -I)- Purpose: Retrieves the system's IP address.
- Explanation: Uses
hostname -Ito obtain the system's IP address.
-
mac=$(ip link show | grep "ether" | awk '{print $2}')- Purpose: Retrieves the MAC address of the network interface.
- Explanation: Uses
ip link showto list network interfaces, filters lines containing "ether" (MAC address), and extracts the MAC address. The MAC address (Media Access Control address) is a unique identifier assigned to network interfaces for communication on a network.
-
cmds=$(journalctl _COMM=sudo | grep COMMAND | wc -l)- Purpose: Counts the number of sudo commands executed.
- Explanation: Uses
journalctlto query the system's journal for sudo commands, filters lines with "_COMM=sudo" and "COMMAND", and counts the lines.
-
The
wallcommand in Linux is used to send a message to all users currently logged into the system. When you pipe a message intowallusing theechocommand, it broadcasts that message to all open terminal sessions.
- While the directory
/usr/local/binis commonly designated for locally installed user executables, you are free to place your custom scripts anywhere you prefer. - Many guides set up the cron job to execute the monitoring script like this in the crontab settings (
sudo crontab -u root -e):*/10 * * * * sh /usr/local/bin/monitor_script.sh
⚠️ While this setup does execute the script every 10 minutes, it does so every full 10 minutes on the clock (e.g., 12:00, 12:10, 12:20, ...). The project's subject, however, specifies that the monitoring information is to be shown at server startup and then every 10 minutes. This means that if the server is started at 12:34:56 (HH:MM:SS), the monitoring info is expected to be displayed right away and then at 12:44:56, 12:54:56, 01:04:56, and so on.- To align with the project requirements, consider the crontab setting below (
sudo crontab -u root -e):@reboot sleep 30 && /usr/local/bin/monitor_script.sh */10 * * * * /usr/local/bin/sleep_script.sh && /usr/local/bin/monitor_script.sh
-
@reboot sleep 30ensures a 30-second delay to allow the user to access the encrypted partition and log in before executing the monitoring script. This delay is necessary as system information would not be displayed while the user is still accessing. -
sleep_script.shintroduces a delay in the execution of the monitoring script, ensuring that system information is displayed 10 minutes after server startup. By employing a separate script, you can conveniently adjust the scheduling of system information messages without modifying the monitoring script itself:#!/bin/bash # boot time(hh:min); 12:34:56 boot_time=$(last -FR | grep reboot | head -n 1 | awk '{print $7}') # boot time, min single digit; 12:34:56 -> 4 single_digit_minute=$(echo "$boot_time" | awk '{printf substr($1,5,1)}') # boot time, sec; 12:34:56 -> 56 seconds=$(echo "$boot_time" | awk '{printf substr($1,7,2)}') sleep $(($single_digit_minute*60 + $seconds))
-
boot_time=$(last -FR | grep reboot | head -n 1 | awk '{print $7}')- Purpose: Retrieves the timestamp of the last system reboot.
- Uses the 'last' command with options -FR to display the full date and seconds for the reboot history. It then filters lines containing 'reboot', takes the first line using
head -n 1, and extracts the seventh column (timestamp) using awk.
-
single_digit_minute=$(echo "$boot_time" | awk '{printf substr($1,5,1)}')- Purpose: Extracts the single-digit minute from the boot timestamp.
- Explanation: Takes the value stored in
boot_timeand uses awk to extract a substring starting from the 5th character with a length of 1 (the single-digit minute).
-
seconds=$(echo "$boot_time" | awk '{printf substr($1,7,2)}')- Purpose: Extracts the seconds from the boot timestamp.
- Explanation: Similar to the previous line, it uses awk to extract a substring starting from the 7th character with a length of 2 (the seconds).
-
- Ensure that the cron jobs can execute the scripts by setting the appropriate permissions. You can check the permissions with
ls -l. If adjustments are needed, use the following commands:chmod +x /usr/local/bin/monitor_script.sh chmod +x /usr/local/bin/sleep_script.sh
- This guide explains the setup neatly in step 1–5.
- Access your website through your browser at http://localhost:8080, where you'll be prompted to sign up for WordPress. To edit your website, visit http://localhost:8080/wp-admin, using the credentials you've just set up. Please note that the use of port 8080 is a personal choice, as this port is often employed for development and testing purposes, and port 80 was not available on my network. By default, Lighttpd is configured to listen on port 80, the standard port for HTTP (check Port Setup to see how this is managed).
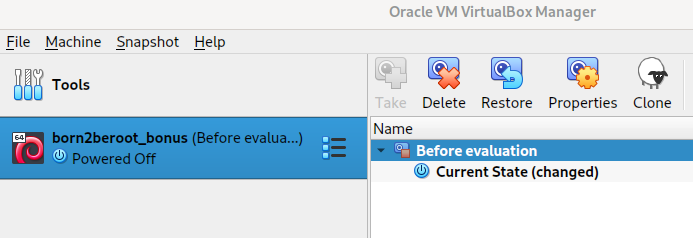
- Taking a snapshot in VirtualBox allows you to capture the current state of your virtual machine, making it easy to revert back to that state later. This can be especially useful before making significant changes, ensuring a stable point to return to. Reverting back to a snapshot after an evaluation ensures that the hash value of your virtual machine still aligns with the one you uploaded. Follow these steps to take a snapshot:
- Make sure that your virtual machine is powered off before taking a snapshot.
- Open the VirtualBox Manager and select your virtual machine. Navigate to the 'Snapshots' tab by clicking the 'list icon' (symbolized as a stack of lines) next to the virtual machine.
- Click on the 'Take' button to create a snapshot. You'll notice the 'Current State' is 'changed' once the virtual machine starts.
- To revert to the snapshot state, select the desired snapshot and choose 'Restore.'
- I would like to thank the authors mentioned in Guides Used for their valuable documentation.
- The project badge used is retrieved from this repo by Ali Ogun.
- A big thank you to the Debian and VirtualBox communities for their outstanding contributions and dedication to open-source ethos.