pdvega is a library that allows you to quickly create interactive
Vega-Lite plots from Pandas dataframes,
using an API that is nearly identical to Pandas' built-in
visualization tools, and designed for easy use within the Jupyter notebook.
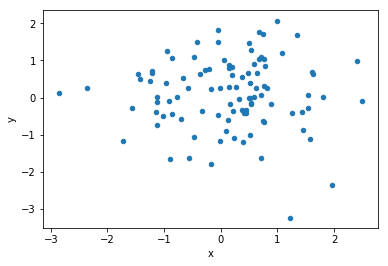
Pandas currently has some basic plotting capabilities based on matplotlib. So, for example, you can create a scatter plot this way:
import numpy as np
import pandas as pd

df = pd.DataFrame({'x': np.random.randn(100), 'y': np.random.randn(100)})
df.plot.scatter(x='x', y='y')
The goal of pdvega is that any time you use dataframe.plot, you'll be
able to replace it with dataframe.vgplot and instead get a similar
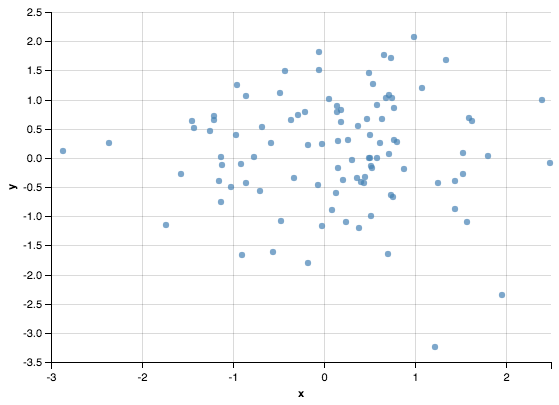
(but prettier and more interactive) visualization output in Vega-Lite that you can easily export to share or customize:
import pdvega  # import adds vgplot attribute to pandas

df.vgplot.scatter(x='x', y='y')
The above image is a static screenshot of the interactive output; please see the Documentation for a full set of live usage examples.
You can get started with pdvega using pip:
$ pip install jupyter pdvega
$ jupyter nbextension install --sys-prefix --py vega3
The first line installs pdvega and its dependencies; the second installs
the Jupyter extensions that allows plots to be displayed in the Jupyter
notebook. For more information on installation and dependencies, see the
Installation docs.
When working with data, one of the biggest challenges is ensuring reproducibility of results. When you create a figure and export it to PNG or PDF, the data become baked-in to the rendering in a way that is difficult or impossible for others to extract. Vega and Vega-Lite change this: instead of packaging a figure by encoding its pixel values, they package a figure by describing, in a declarative manner, the relationship between data values and visual encodings through a JSON specification.
This means that the Vega-Lite figures produced by pdvega are portable: you can send someone the
resulting JSON specification and they can choose whether to render it interactively online, convert it to
a PNG or EPS for static publication, or even enhance and extend the figure to learn more about the data.
pdvega is a step in bringing this vision of figure portability and reproducibility to the Python world.
Altair is a project that seeks to design an intuitive declarative API for generating Vega-Lite and Vega visualizations, using Pandas dataframes as data sources.
By contrast, pdvega seeks not to design new visualization APIs, but to use the existing DataFrame.plot visualization api and output visualizations with Vega/Vega-Lite rather than with matplotlib.
In this respect, pdvega is quite similar in spirit to the now-defunct mpld3 project, though the scope is smaller and (hopefully) much more manageable.


