Let's say you're responsible to run an application that has to work within a certain performance criteria. These performance goals are commonly referred to as SLOs (Service Level Objectives).
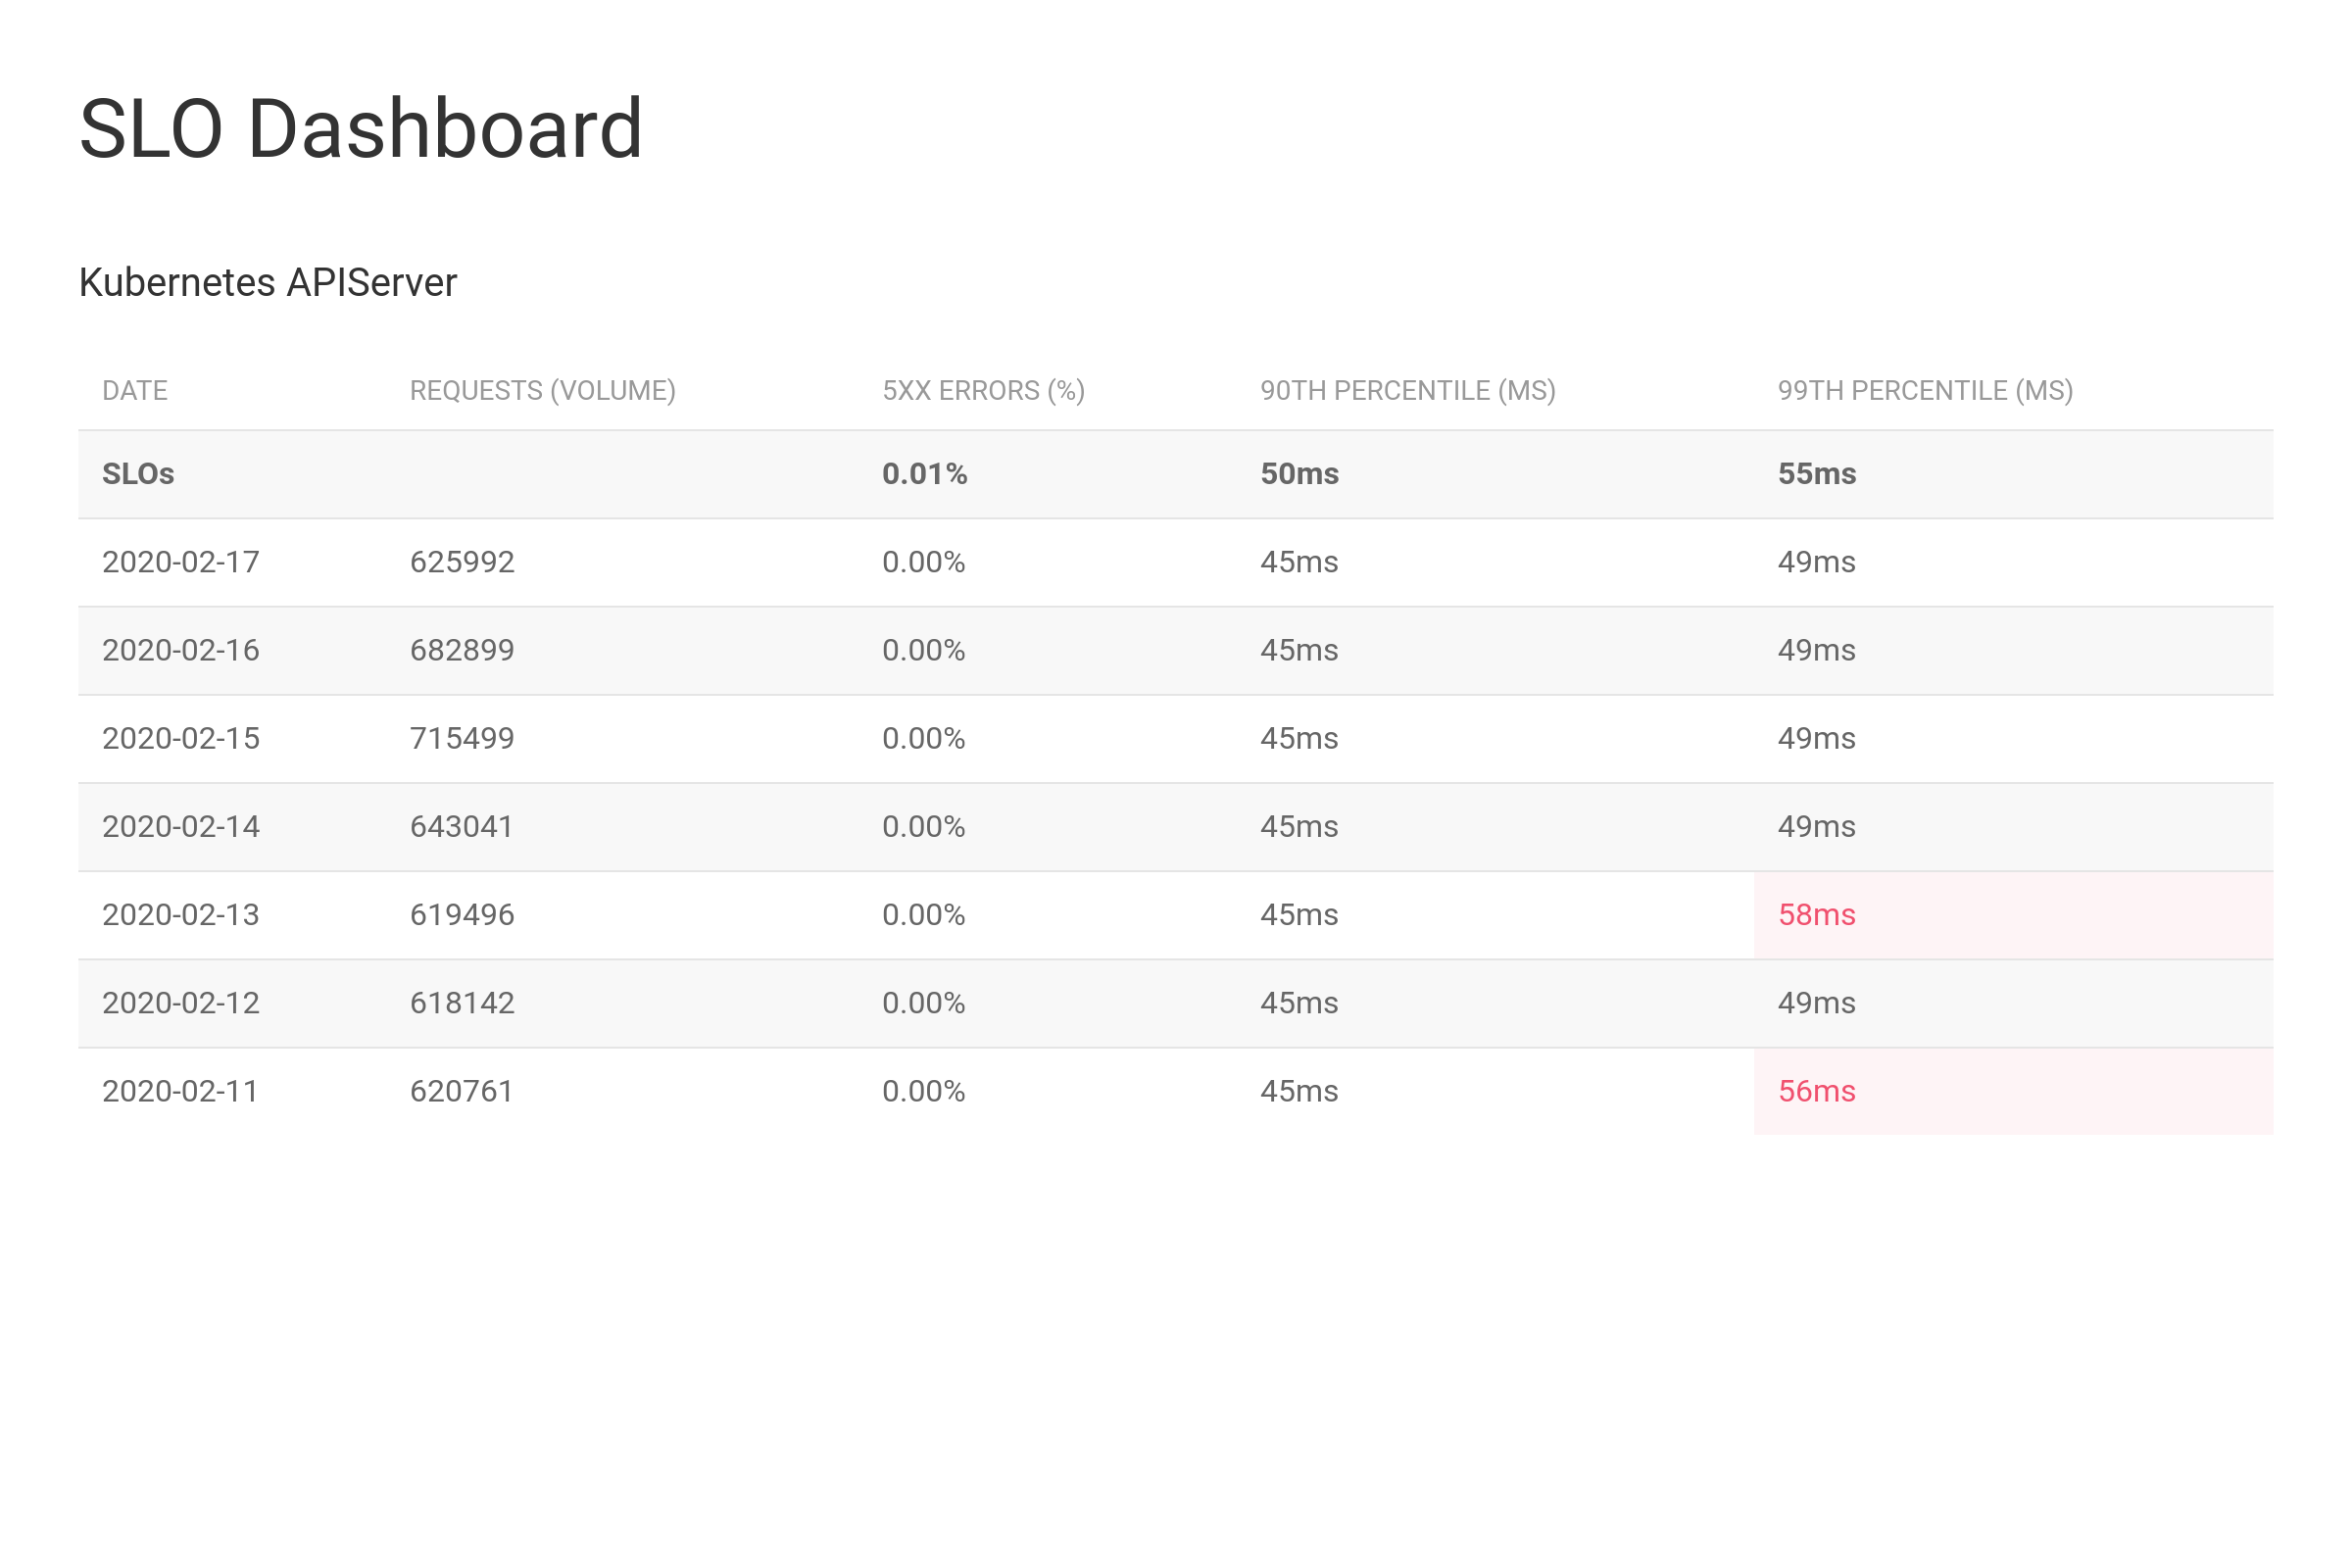
This SLO-dashboard is a simple website that shows you, by default on a per day basis, how your application was performing. It can be used as a VALET (Volume, Availability, Latency, Errors, Tickets) dashboard, however, the exact metrics you query and store are up to you.
 Example dashboard configured with a 99% availablity on errors.
This SLO-dashboard can show multiple projects (applications).
Each projects can define multiple columns to report based on a Prometheus Query (with PromQL) and a title for the column.
These queries are defined in a projects.yaml file that is read during start-up.
What is currently being implemented.
You can host the SLO-dashboard on Kubernetes as a long lived webserver.
Every 5min the SLO-dashboard will check if there is a report for the previous day.
Shortly midnight (UTC) it will find that there's no report and fire all queries against Prometheus.
To make things consistent, the query will be run with 00:00:00 as time.
Therefore a query like increase(http_requests_total[1d]) should return consistent queries, no matter how often they are run.
All responses are then saved to a database (BoltDB - think SQLite just embedded into Go, also used by etcd). As we store all results persistently on disk, we can save reports a lot longer than our Prometheus retention allows us to.
Needs to be implemented.
If this mode is enabled we will, upon starting, run all queries for all projects against a Prometheus. The results are stored in-memory. By default we will query the last 28d.
For now, you can simply go get -u github.com/metalmatze/slo-dashboard or go build -v once you have cloned the project.
Once you have a binary, run slo-dashboard which by default is looking for projects.yaml and querying Prometheus on localhost:9090.
Both parameters are tweakable with --file (-f) and --prometheus.url if you need to change them.