attachment: lab files
-
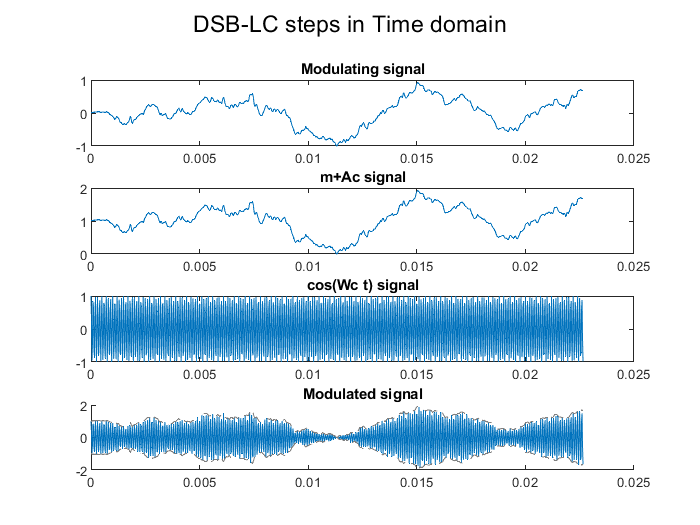
Choose reasonable values for 𝐴 and 𝜔 to achieve DSB-LC modulation with your previous audio signal and explain how you choose them?
-
for choosing $Fc$ ⇒
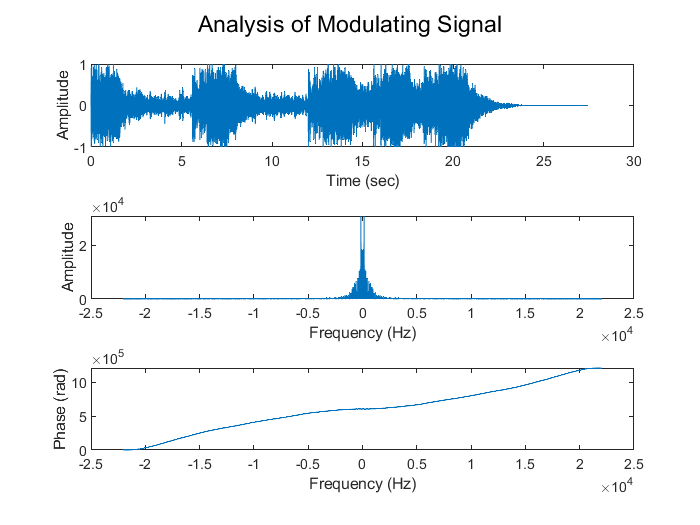
$w_c=2.\pi.F_c$ - from first plot (signal in frequency domain) ⇒
$\text{bandwidth} \approx 5000 \text{ hz}$ - from variables in code ⇒
$F_s = 44100 \text{ hz}$ ⇒$\frac{F_s}{2} = 22050\text{ hz}$ $\text{bandwidth} \lt F_c \lt \frac{F_s}{2}$ $F_c = 2*\text{bandwidth} = 10000 \lt \frac{Fs}{2}$ - usually it more than 2 for antenna and other reasons
- from first plot (signal in frequency domain) ⇒
-
for choosing
$A_c$ let
$\mu = 1$ so$\therefore \eta = 33.33%$ &$\therefore A_c = \frac{|min(m(t))|}{\mu} \approx 1$
-
-
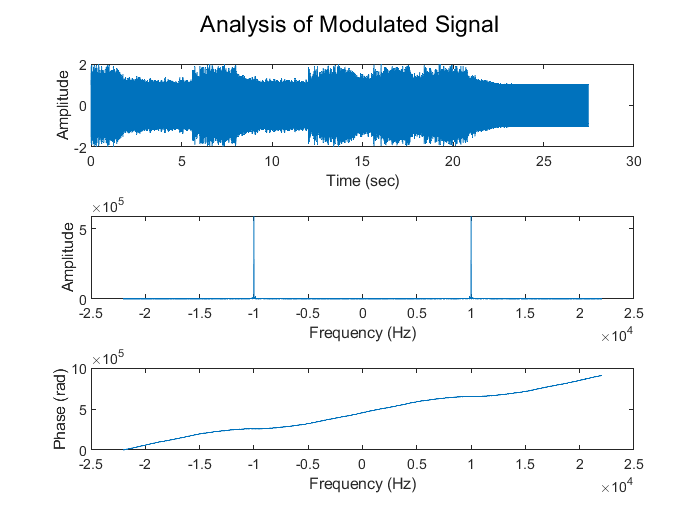
Plot the modulated signal waveform in time domain and the modulated signal amplitude and phase in frequency domain.
- What do you think is a carrier’s minimum Amplitude (A) to avoid over
modulation? What is the problem with the AM signal when it is over-modulated?
$A_c \gt |\text{minimum }m(t)|$ - so all signal become above access and when modulated I can extract envelope easily first by my eye then by a simple cheap circuit
- if the signal toggle between negative and positive x-axis we won’t able to know modulating signal from envelope
-
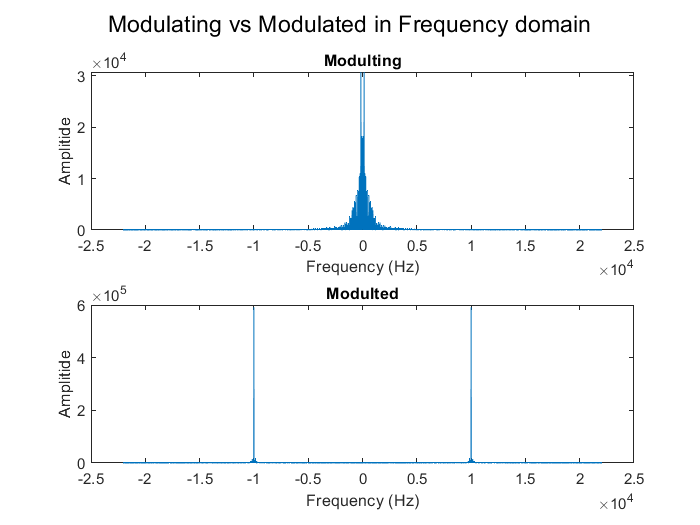
Compare between the bandwidth of the audio signal and the modulated one by plotting both signal in the frequency domain.
comment:
- it’s clear that amplitude have peaks at
$F_c$ &$-F_c$ - and bandwidth of modulated signal is double modulating signal not clear in plot
- modulated its mirror (even) because modulating signal is real
- it’s clear that amplitude have peaks at
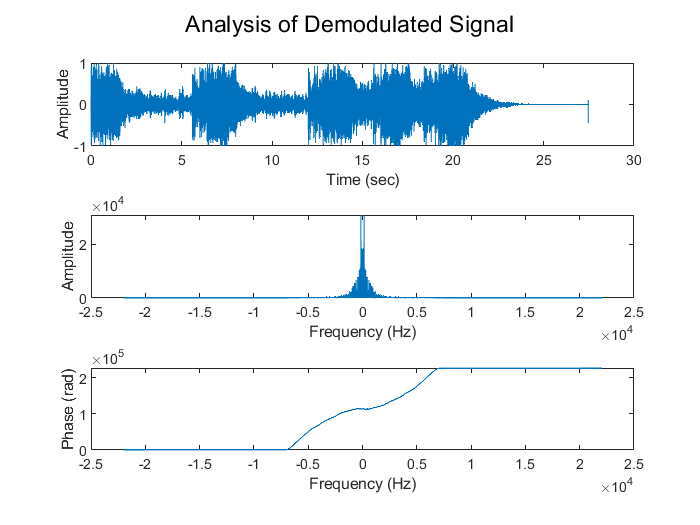
- Do synchronous demodulation to obtain 𝑥(𝑡) , then plot the final signal in time and frequency domain as previous.
-
Hear the demodulated signal and compare it with the original one. Are the two signals the same? Explain why?
comment:
😲 they Hear the same (for left channel *as I removed right channel to ease calculations)
small change in phase : I think it may be the Low pass filter function because after all I approximate bandwidth by my eye
why:
- carrier signal used in modulation and demodulation process is the same we know exactly
$\phi_c$ ,$A_c$ ,$w_c$ - achieve max power efficiency
$33%$
- carrier signal used in modulation and demodulation process is the same we know exactly
