Node.js excel chart builder
Install
npm install xlsx-chartGenerate and write chart to file
var XLSXChart = require ("xlsx-chart");
var xlsxChart = new XLSXChart ();
var opts = {
file: "chart.xlsx",
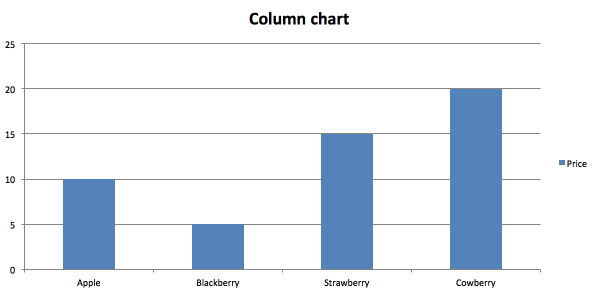
chart: "column",
titles: [
"Title 1",
"Title 2",
"Title 3"
],
fields: [
"Field 1",
"Field 2",
"Field 3",
"Field 4"
],
data: {
"Title 1": {
"Field 1": 5,
"Field 2": 10,
"Field 3": 15,
"Field 4": 20
},
"Title 2": {
"Field 1": 10,
"Field 2": 5,
"Field 3": 20,
"Field 4": 15
},
"Title 3": {
"Field 1": 20,
"Field 2": 15,
"Field 3": 10,
"Field 4": 5
}
}
};
xlsxChart.writeFile (opts, function (err) {
console.log ("File: ", opts.file);
});Generate and download chart data
xlsxChart.generate (opts, function (err, data) {
res.set ({
"Content-Type": "application/vnd.ms-excel",
"Content-Disposition": "attachment; filename=chart.xlsx",
"Content-Length": data.length
});
res.status (200).send (data);
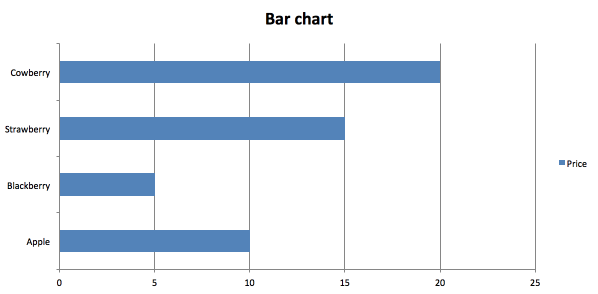
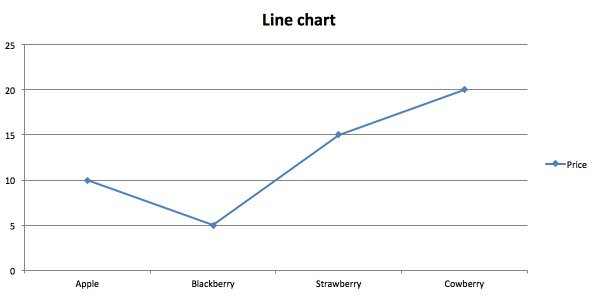
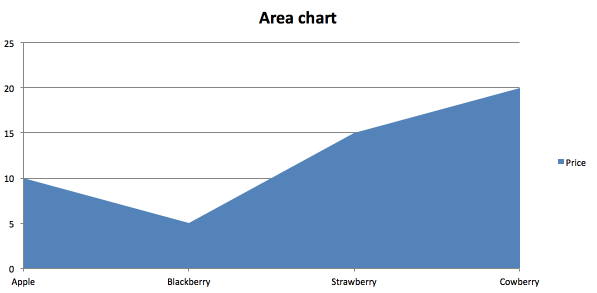
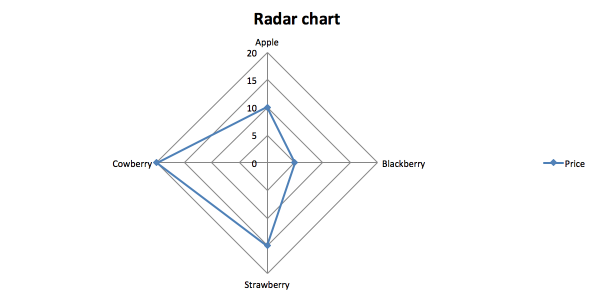
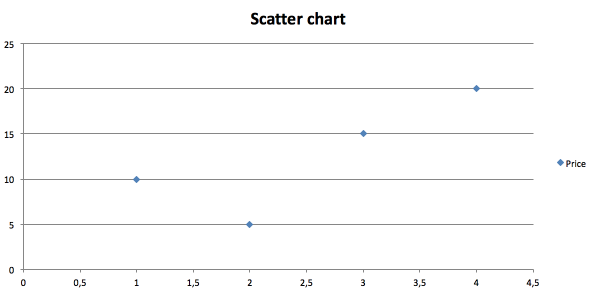
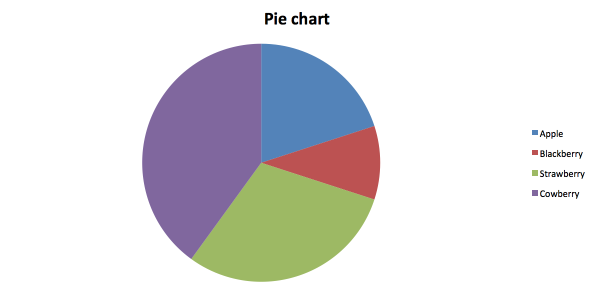
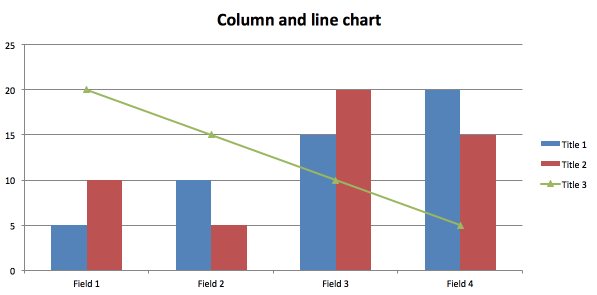
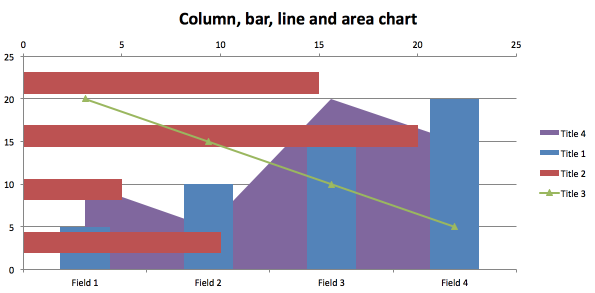
});column, bar, line, area, radar, scatter, pie
You can mix column, bar, line, area.
Default templates: xlsx-chart/template/*.xlsx
var opts = {
	file: "chart.xlsx",
	chart: "column",
	templatePath: __dirname + "/myColumn.xlsx",
	...
};
xlsxChart.writeFile (opts, function (err) {
  console.log ("File: ", opts.file);
});Only column chart. For other types use custom template.
let fs = require ("fs");
let XLSXChart = require ("xlsx-chart");
let xlsxChart = new XLSXChart ();
let opts = {
	charts: [{
		chart: "column",
		titles: [
			"Title 1",
			"Title 2",
			"Title 3"
		],
		fields: [
			"Field 1",
			"Field 2",
			"Field 3",
			"Field 4"
		],
		data: {
			"Title 1": {
				"Field 1": 5,
				"Field 2": 10,
				"Field 3": 15,
				"Field 4": 20
			},
			"Title 2": {
				"Field 1": 10,
				"Field 2": 5,
				"Field 3": 20,
				"Field 4": 15
			},
			"Title 3": {
				"Field 1": 20,
				"Field 2": 15,
				"Field 3": 10,
				"Field 4": 5
			}
		},
		chartTitle: "Title 1"
	}, {
		chart: "column",
		titles: [
			"Title 1",
			"Title 2",
			"Title 3"
		],
		fields: [
			"Field 1",
			"Field 2",
			"Field 3",
			"Field 4"
		],
		data: {
			"Title 1": {
				"Field 1": 5,
				"Field 2": 10,
				"Field 3": 15,
				"Field 4": 20
			},
			"Title 2": {
				"Field 1": 10,
				"Field 2": 5,
				"Field 3": 20,
				"Field 4": 15
			},
			"Title 3": {
				"Field 1": 20,
				"Field 2": 15,
				"Field 3": 10,
				"Field 4": 5
			}
		},
		chartTitle: "Title 2"
	}, {
		chart: "column",
		titles: [
			"Title 1",
			"Title 2",
		],
		fields: [
			"Field 1",
			"Field 2",
			"Field 3",
		],
		data: {
			"Title 1": {
				"Field 1": 15,
				"Field 2": 30,
				"Field 3": 45,
			},
			"Title 2": {
				"Field 1": 5,
				"Field 2": 2,
				"Field 3": 10
			}
		},
		chartTitle: "Title 3"
	}]
};
xlsxChart.generate (opts, function (err, data) {
	fs.writeFileSync ("chart.xlsx", data);
});column.js
bar.js
line.js
area.js
radar.js
scatter.js
pie.js
columnLine.js
mix.js
Dmitriy Samortsev
MIT