- 1. Exploring Cartography, React, and Deck.gl
- 2. Basic Principles of Web-Oriented Cartography
- 3. QGIS
- 4. GeoJSON Format
- 5. @deck.gl
- 6. Deck.gl Demo Application
In this exploration, we'll delve into various aspects of web-oriented cartography, geospatial data formats, and tools for editing and visualizing geospatial data. We'll also explore different aspects of the geospatial data visualization library Deck.gl and how it can be integrated with React.
Cartography is a discipline that deals with the graphical representation of the Earth. Nowadays, cartography has become a fundamental tool for decision-making in various fields such as urban planning, natural resource management, disaster management, navigation, etc. Its myriad uses have made it an essential tool for decision-making in various domains.
In this exploration, we'll focus on web-oriented cartography, geospatial data formats, and tools for editing and visualizing geospatial data.
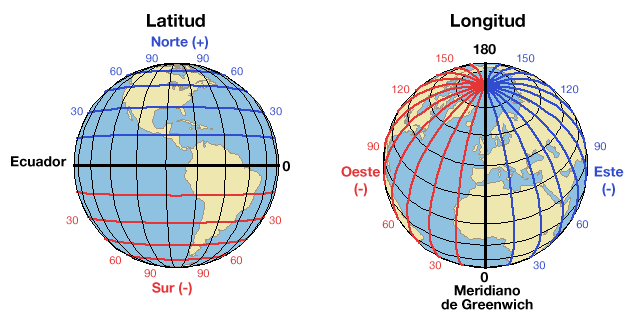
Geographic coordinates are a reference system used to represent the location of a point on the Earth's surface. Geographic coordinates consist of two values: latitude and longitude.
The most commonly used geographic coordinate systems are:
-
WGS84: Geographic coordinates in the WGS84 system are expressed in decimal degrees.
Examples:
- 40.7128° N, 74.0060° W (decimal format)
- 40° 42' 46.08" N, 74° 0' 21.6" W (degree, minute, second format)
-
UTM: Geographic coordinates in the UTM system are expressed in meters.
Example:
- 583964.601 4507344.285 (meter format)
- 18T 583964.601 4507344.285 (UTM format)
Positive values correspond to the northern hemisphere and east of the central meridian, while negative values correspond to the southern hemisphere and west of the central meridian.
This system programmatically has some issues because longitude and latitude are angular, not linear values. Therefore, to perform calculations with geographic coordinates, it's necessary to perform projection transformations. For example, to calculate the distance between two points in geographic coordinates, if a projection transformation is not performed, the result will be incorrect for long distances that involve a change in latitude and longitude. Hence, there are libraries like Turf.js that allow us to perform calculations with geographic coordinates.
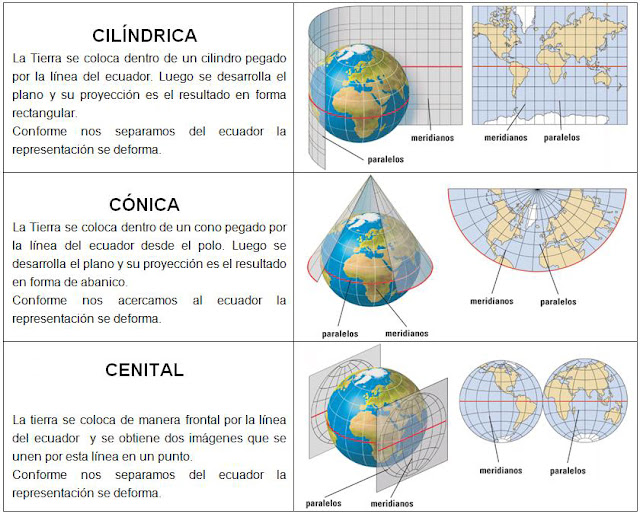
Cartographic projections are mathematical transformations that allow representing the Earth's surface on a plane. There are different types of cartographic projections, such as cylindrical projection, conical projection, zenithal projection, etc. Each type of cartographic projection has its own characteristics and advantages and is used in different contexts and applications.
More info: http://mapasyotroscuentos.blogspot.com/2016/01/las-proyecciones-cartograficas-o-cuando.html
It's important to understand that all cartographic projections have distortions, and there is no perfect cartographic projection.
The most used projections on the web are:
- WGS84 Projection: It's a spherical projection used for representing the Earth on the web. Its encoding is EPSG:4326.
- Web Mercator Projection: It's a cylindrical projection used for representing the Earth on the web. Its encoding is EPSG:3857.
The Web Mercator projection is the de facto standard for web map applications. It gained fame when Google Maps adopted it in 2005. It is used by virtually all major online map providers, including Google Maps, CARTO, Mapbox, Bing Maps, OpenStreetMap, MapQuest, Esri, and many others.
Although in recent years, Google Maps on its desktop version has adopted the spherical WGS84 projection.
Usually, when importing a GeoJSON, Shapefile, KML, etc., file into a web application, it's necessary to consider the projection of the file and the projection of the map. If the projections do not match, a projection transformation is necessary.
Geospatial data describes the location of objects on the Earth's surface. Geospatial data can be represented in different formats, such as GeoJSON, Shapefile, KML, GML, etc. In this exploration, we'll focus on the GeoJSON format, which is a JSON-based geospatial data format.
In addition to the format itself, there are fundamental differences between vector and raster geospatial data. This difference can be enumerated in the following points:
- Vector Data: Represent geographical information as points, lines, and polygons.
- Raster Data: Represent geographical information as a grid of cells.
- DTM (Digital Terrain Model): Represent geographical information as a grid of cells with altitude values.
Regarding the formats:
- GeoJSON: JSON-based geospatial data format.
- Shapefile: Geospatial data format developed by ESRI.
- KML: Geospatial data format developed by Google.
- GML: XML-based geospatial data format.
- DTM: Digital Terrain Model.
- GeoTIF: Raster geospatial data format. (There are other variants like GeoJP2, GeoPNG, etc.)
Furthermore, there are map services, which are services that provide maps and geospatial data over the web. Some of the well-known map services are Google Maps, Bing Maps, OpenStreetMap, Mapbox, etc.
There are also dedicated servers, which can be deployed on one's own server. Some of the well-known map servers are GeoServer, MapServer, etc.
These services require a client to visualize the data, and this is where geospatial data visualization libraries come into play. The most well-known ones are Leaflet, OpenLayers, Mapbox GL, Deck.gl, etc.
Geospatial databases are databases that allow storing geographic information and performing spatial queries. Currently, there are different geospatial databases, such as PostGIS, MongoDB, Cassandra, Oracle Spatial, etc. In this exploration, we'll focus on PostGIS, which is a spatial extension for PostgreSQL.
PostGIS provides a set of spatial functions and operators that allow performing spatial queries, such as intersection, union, difference, buffer, etc. PostGIS also provides a set of functions and operators for performing projection transformations, simplifying geometries, calculating areas and lengths, etc.
Examples of spatial queries:
-- Query for all polygons intersecting with a point
SELECT * FROM polygons WHERE ST_Intersects(geom, ST_GeomFromText('POINT(0 0)', 4326));

-- Change the projection of a polygon
SELECT ST_Transform

(geom, 3857) FROM polygons;

-- Calculate the area of a polygon
SELECT ST_Area(geom) FROM polygons;

-- Calculate the length of a line
SELECT ST_Length(geom) FROM lines;

-- Generate a GeoJSON from a polygon
SELECT ST_AsGeoJSON(geom) FROM polygons;

-- Generate a GeoJSON from a polygon with attributes
SELECT row_to_json((SELECT d FROM (SELECT id, name, ST_AsGeoJSON(geom) AS geom) AS d)) FROM polygons;

-- Generate a GeoJSON from a polygon with attributes and projection
SELECT row_to_json((SELECT d FROM (SELECT id, name, ST_AsGeoJSON(ST_Transform(geom, 3857)) AS geom) AS d)) FROM polygons;

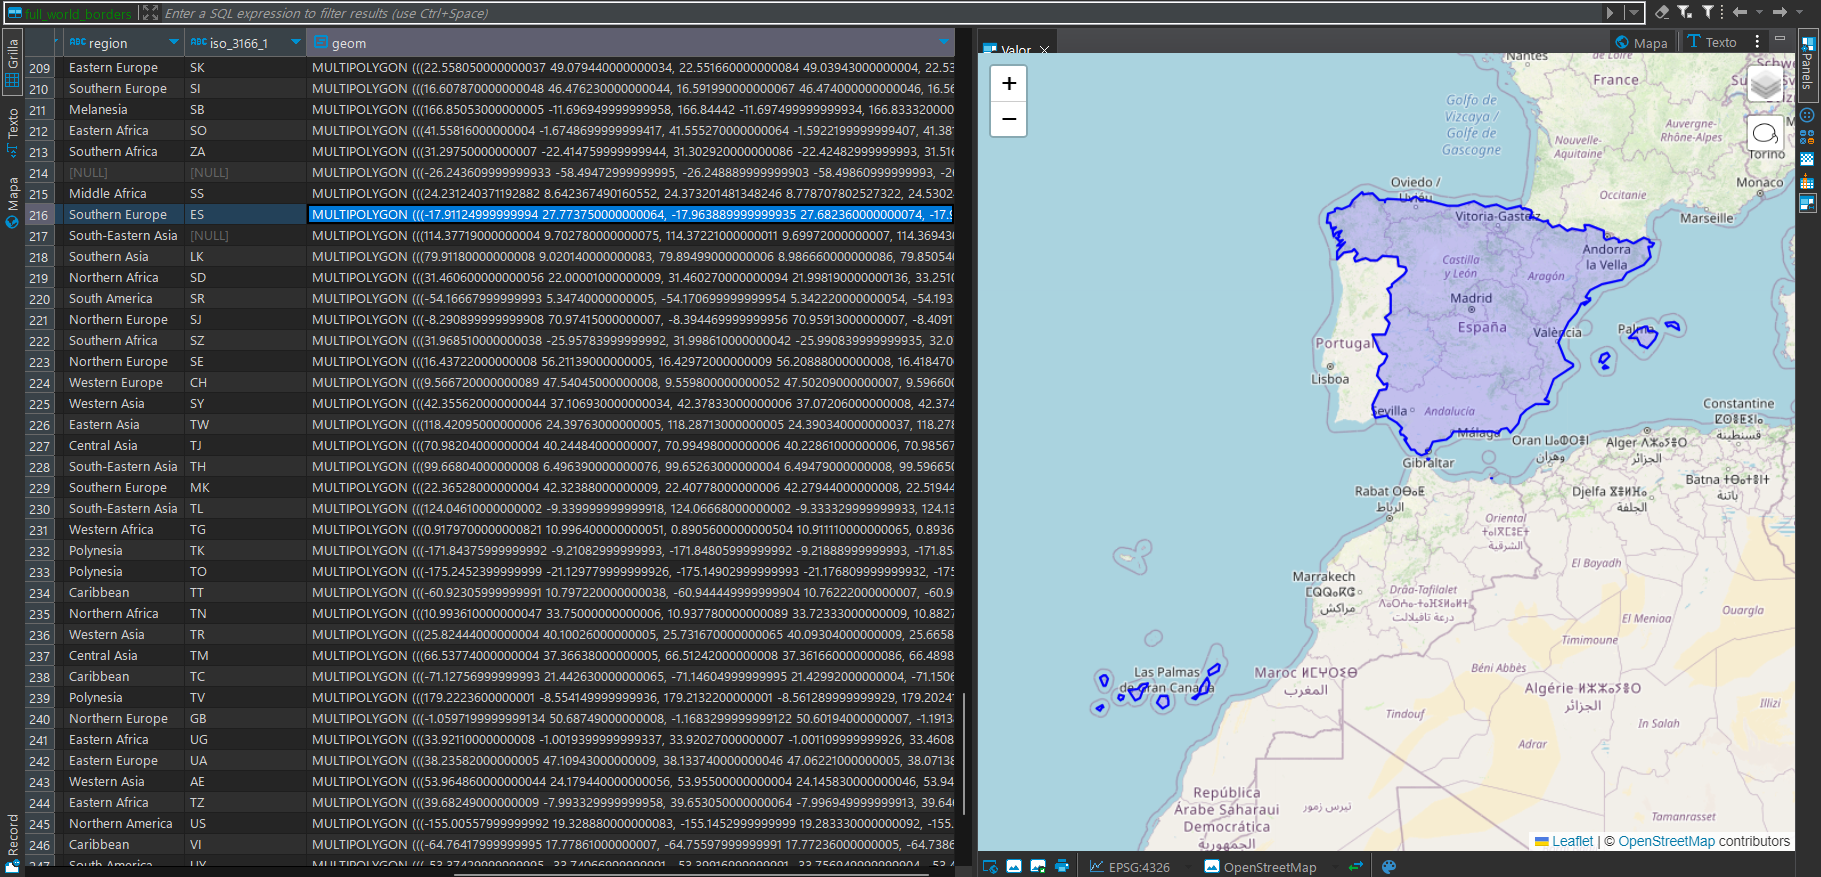
-- table:full_world_borders
-- fields: gid, iso3, status, color_code, name, continent, region, iso_3166_1, geom

-- Query that generates a GeoJSON from a polygon with attributes and projection and filters by the European continent

SELECT json_agg(row_to_json(fc))
FROM (
  SELECT
    'FeatureCollection' AS type,
    array_to_json(array_agg(f)) AS features
  FROM (
    SELECT
      'Feature' AS type,
      row_to_json((SELECT l FROM (SELECT gid, iso3, status, color_code, name, continent, region, iso_3166_1) AS l)) AS properties,
      ST_AsGeoJSON(ST_Transform(geom, 3857))::json AS geometry
    FROM
      full_world_borders
    WHERE
      continent = 'Europe'
  ) AS f
) AS fc;
With a backend that uses PostGIS, spatial queries can be performed and GeoJSON can be generated from the query results. Geo-spatial data in GeoJSON format can be used, for example, in Deck.gl to visualize the data in a web application.
PostGIS: https://postgis.net/
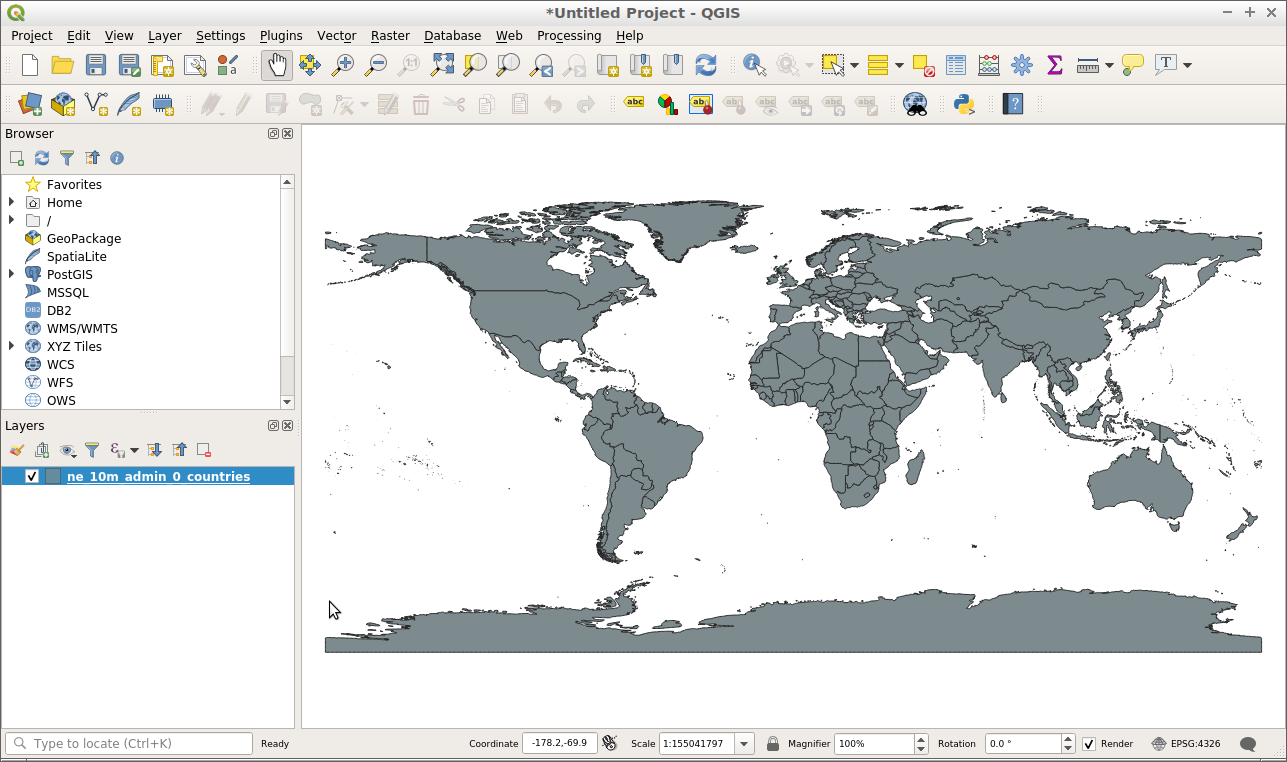
QGIS is an open-source Geographic Information System (GIS) that allows visualization, editing, and analysis of geospatial data. QGIS is a powerful and versatile tool used in various fields and applications, competing with other paid programs such as ArcGIS.
From a programmer's point of view, QGIS is a very useful tool for editing and visualizing geospatial data. QGIS allows importing and exporting geospatial data in different formats, performing spatial analysis, creating thematic maps, etc.
QGIS: https://www.qgis.org/
Our goal is not to create maps, that is the work of cartographers, but if our goal is the visualization of geospatial data in web applications, it is important that we know how these tasks are performed in QGIS in order to understand the data we are going to visualize and to perform the necessary transformations.
These are some of the functionalities that we need to use in our projects:
To import geospatial data into QGIS, there are many ways, but generally dragging the file to the QGIS window is sufficient. Then there are plenty of options for importing from databases, web services, etc.
To export geospatial data in QGIS, you can right-click on the layer and select "Export" and then select the output format.
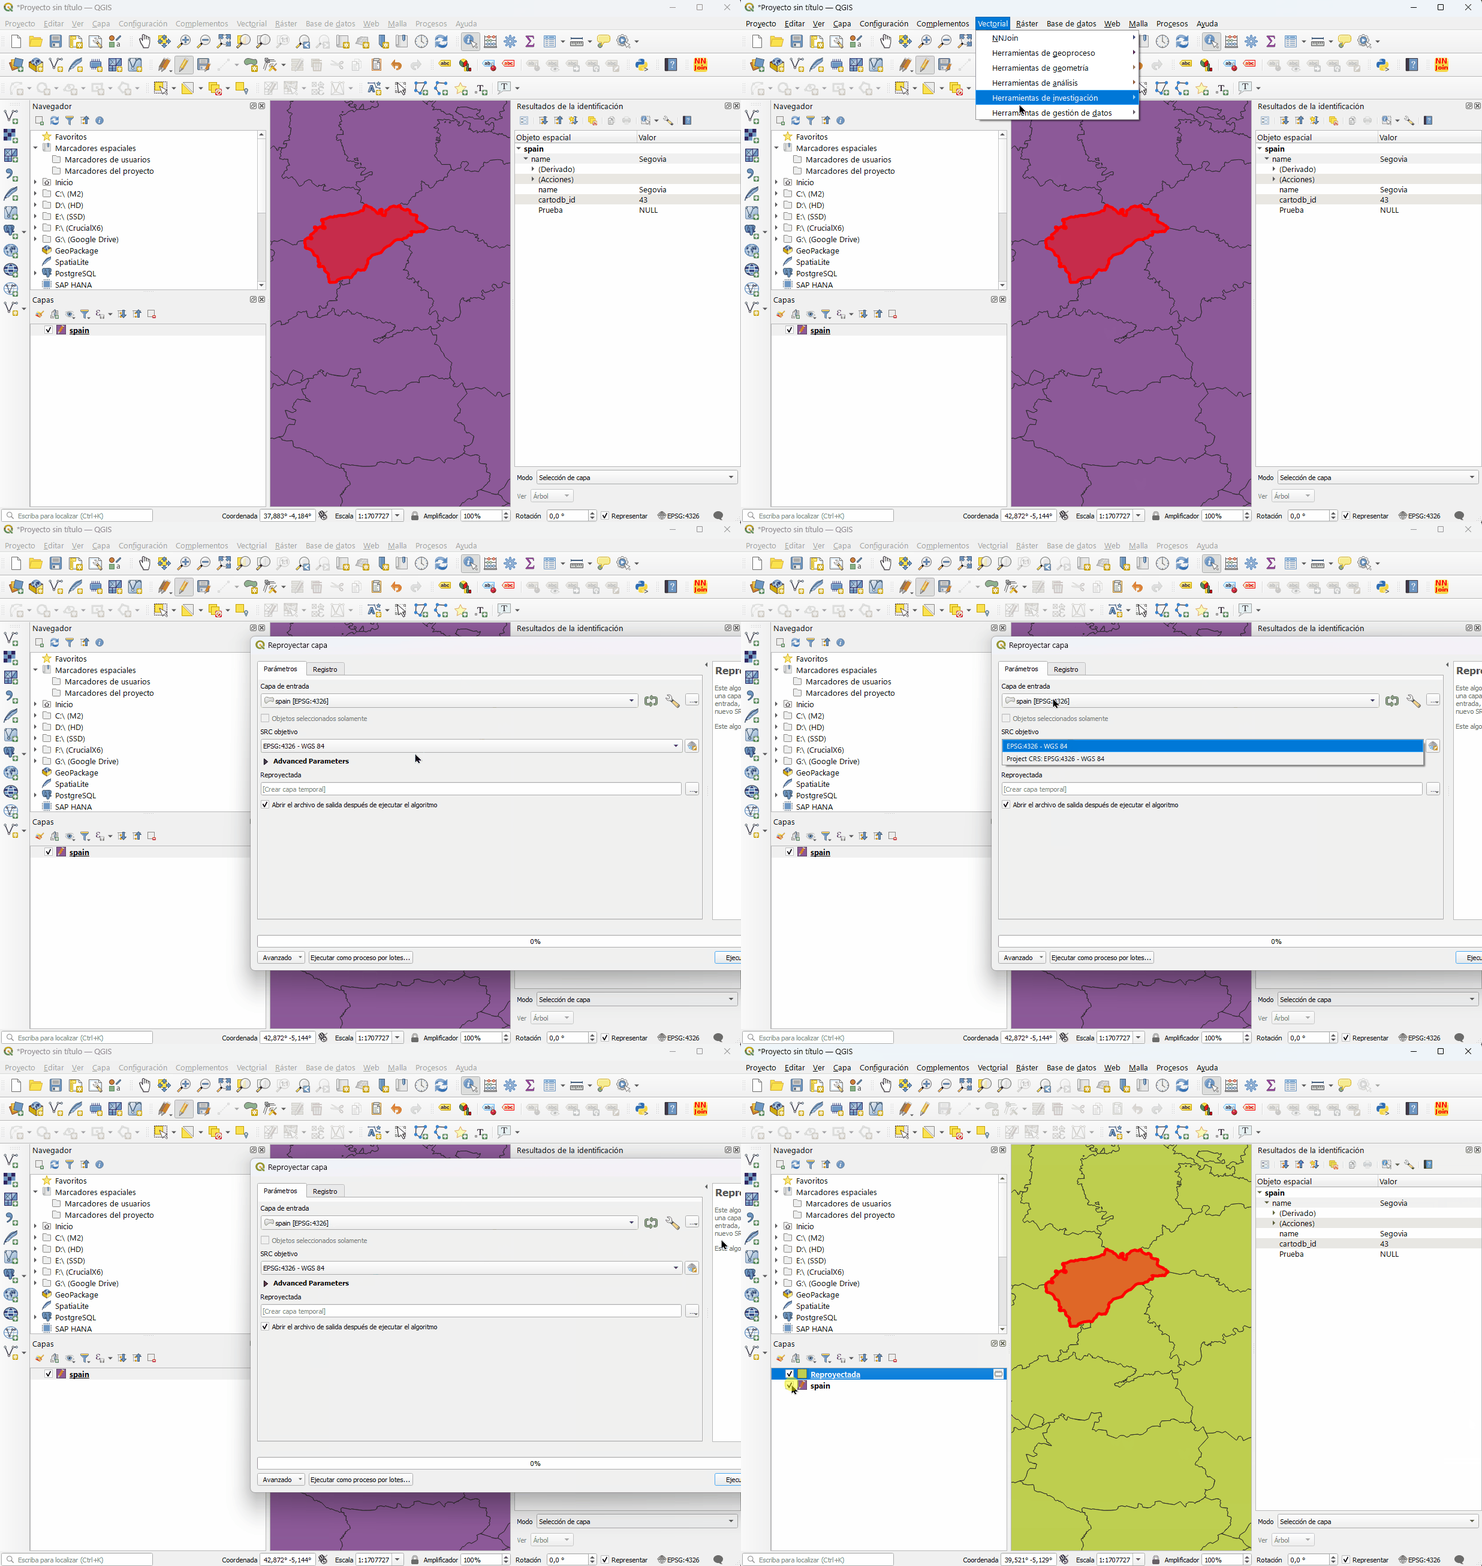
To perform projection transformations in QGIS, go to the "Vector" option and select "Data management tools" and then "Reproject layer". Then select the desired output projection and click "OK".
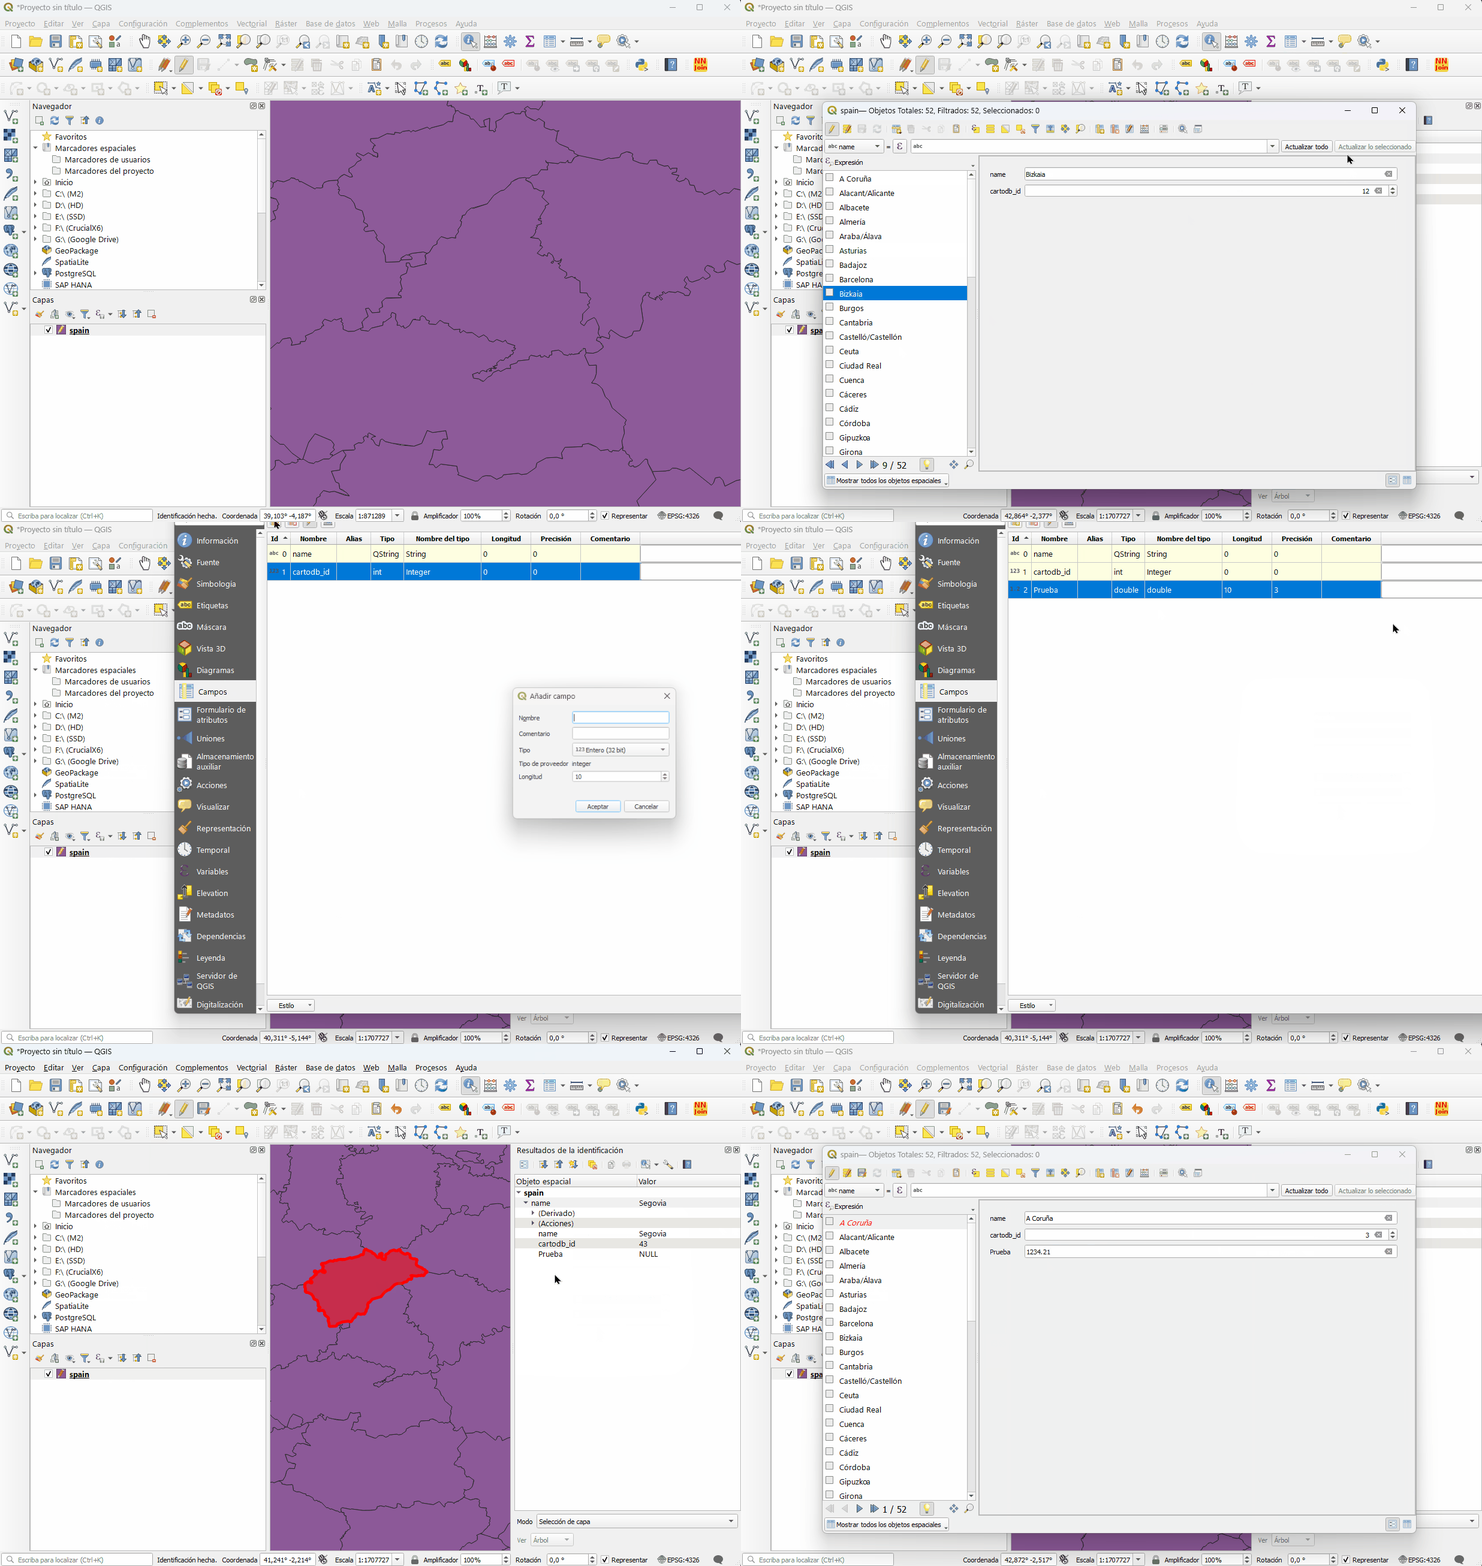
To edit attributes of geospatial data in QGIS, click on the attribute editing icon, to add a new attribute, right-click on the layer and select "Properties" and then "Fields".
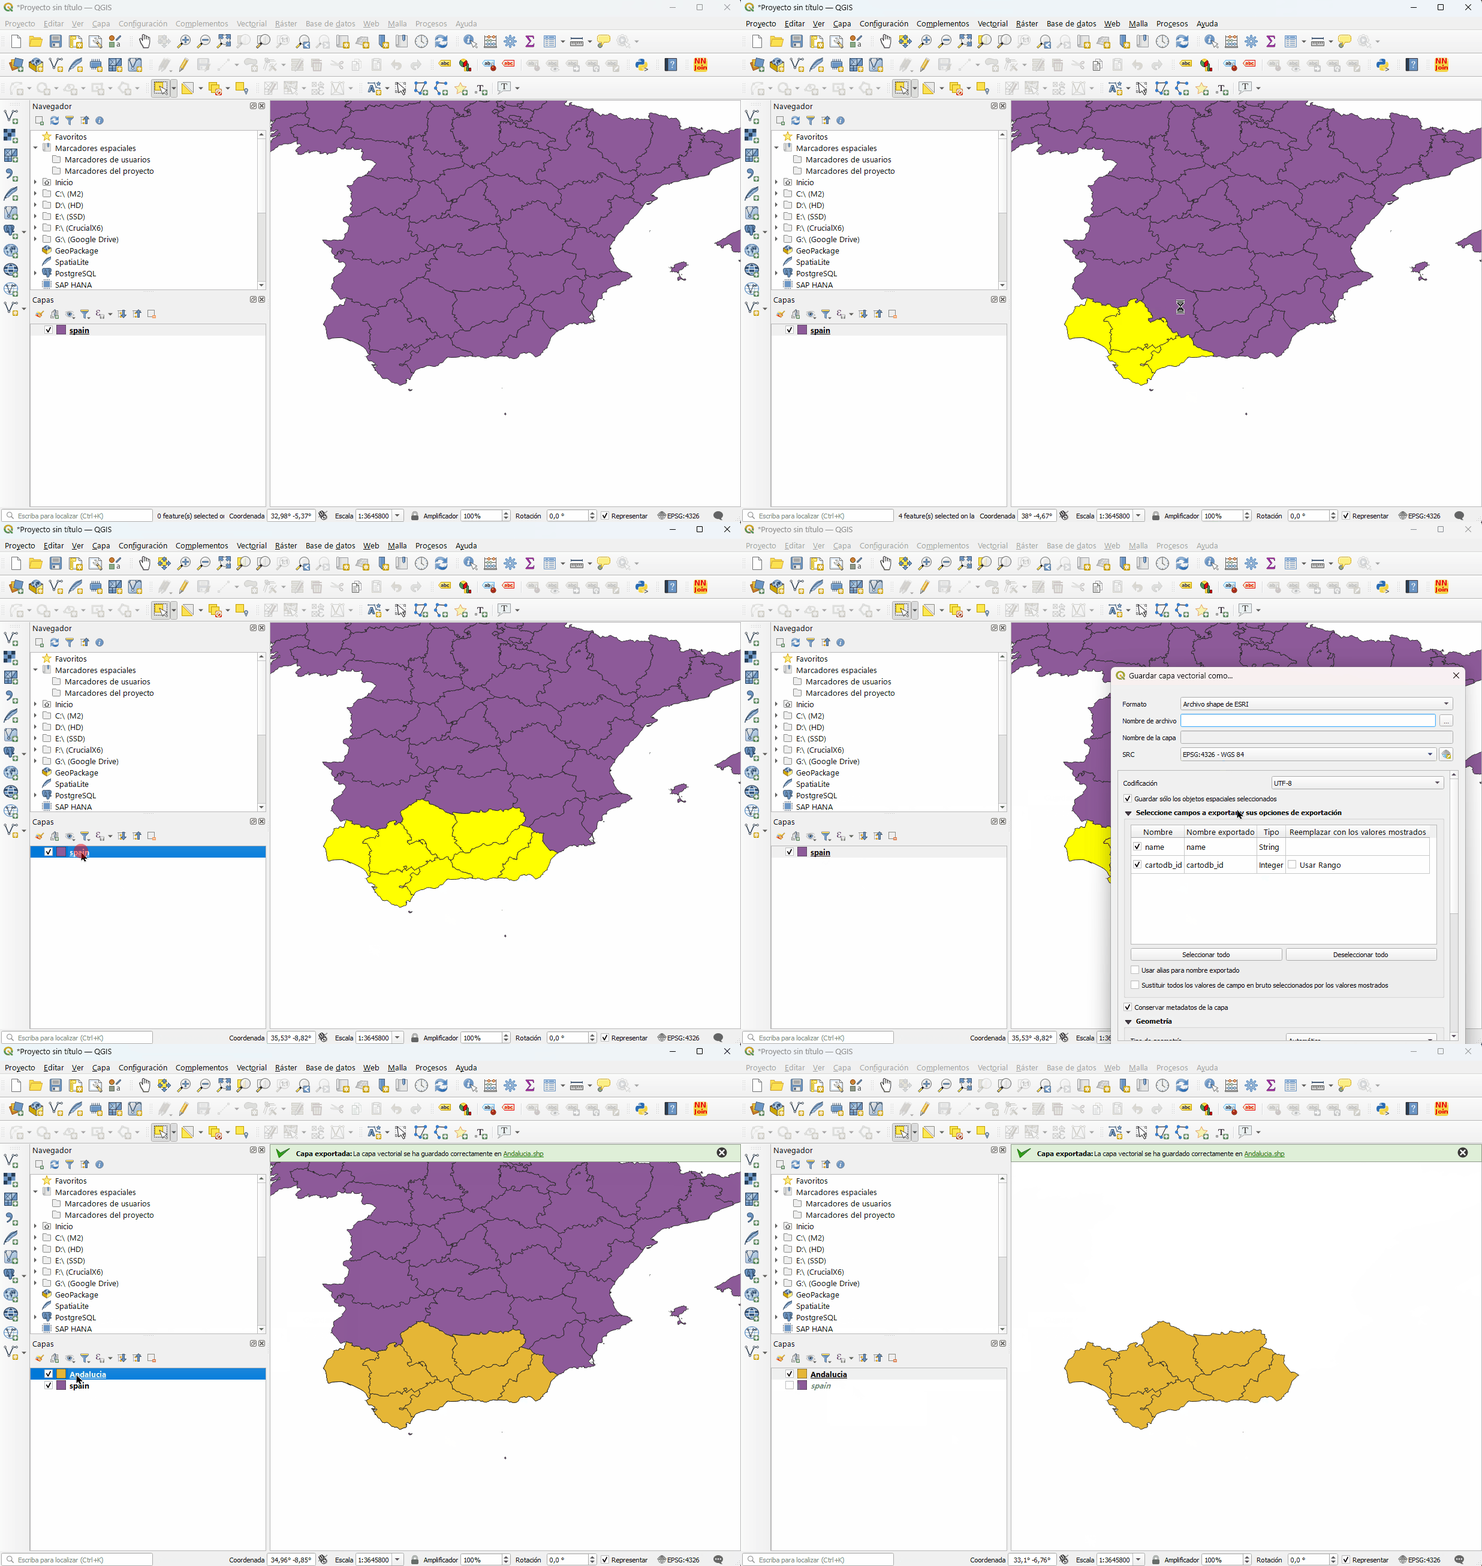
To split geospatial data layers in QGIS, simply select the elements to be split and export with the option of only the selected elements.
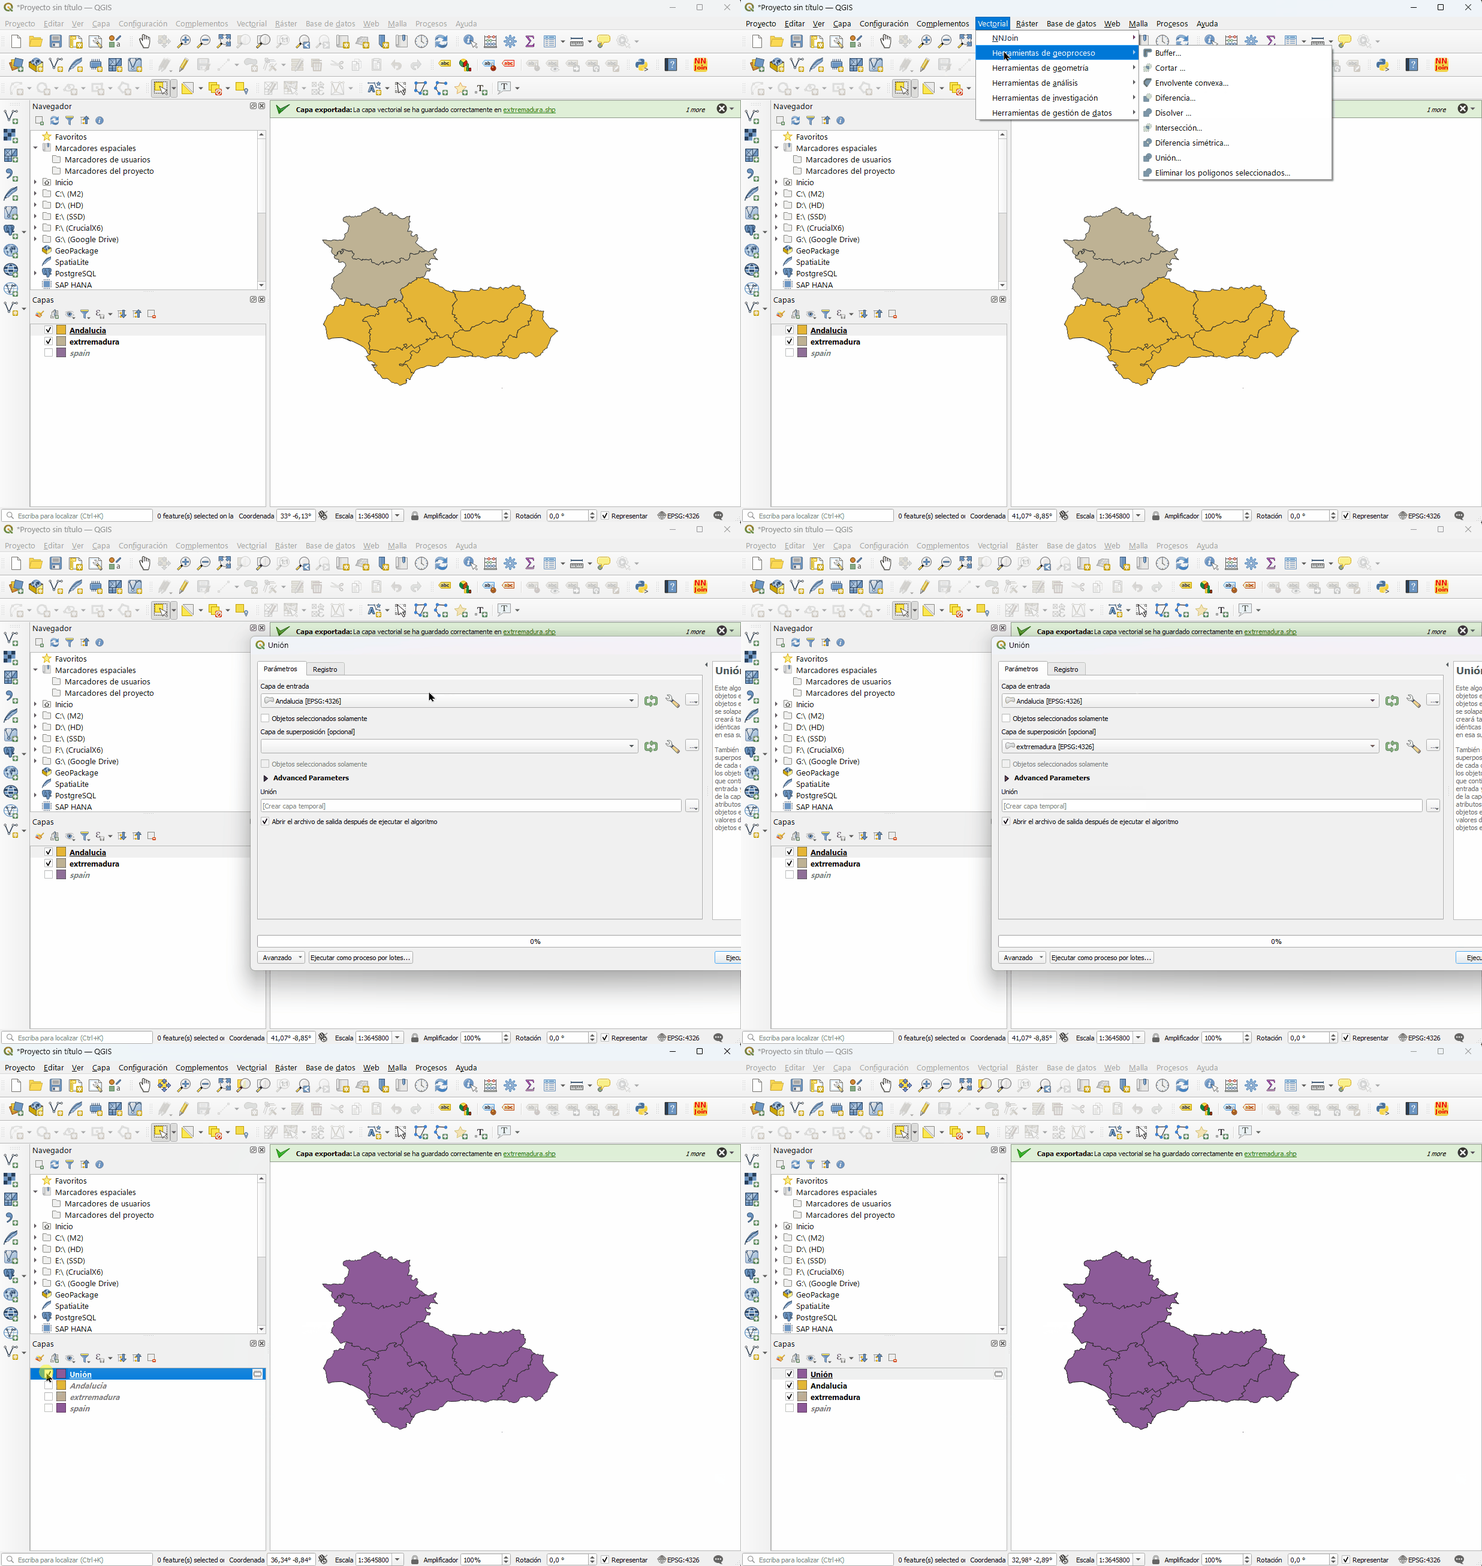
To combine geospatial data layers in QGIS, click on "Vector" and select "Geoprocessing tools" and then "Union".
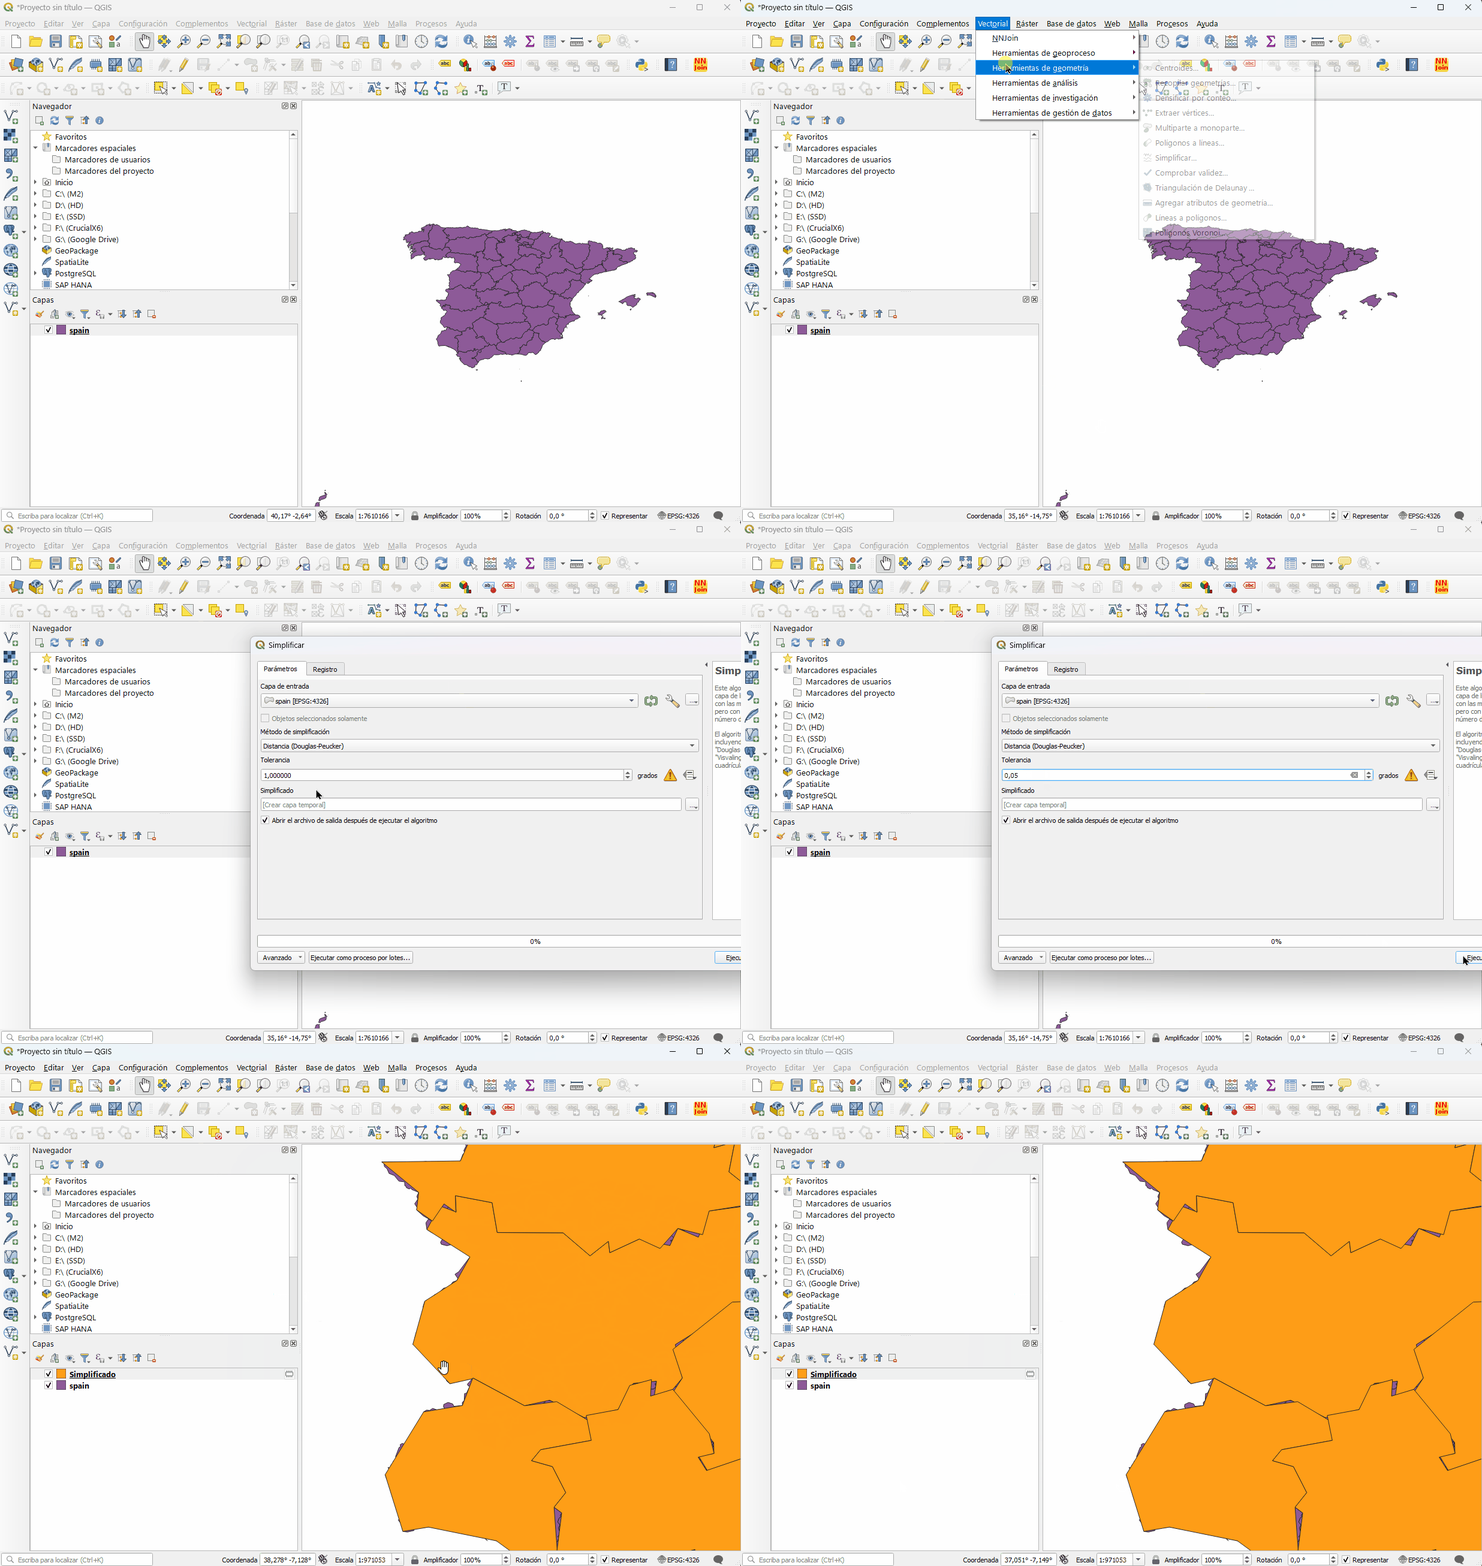
To simplify geometries in QGIS, click on "Vector" and select "Geometry tools" and then "Simplify".
Often this simplification is necessary/recommended to reduce the size of the data and improve the performance of the web application.
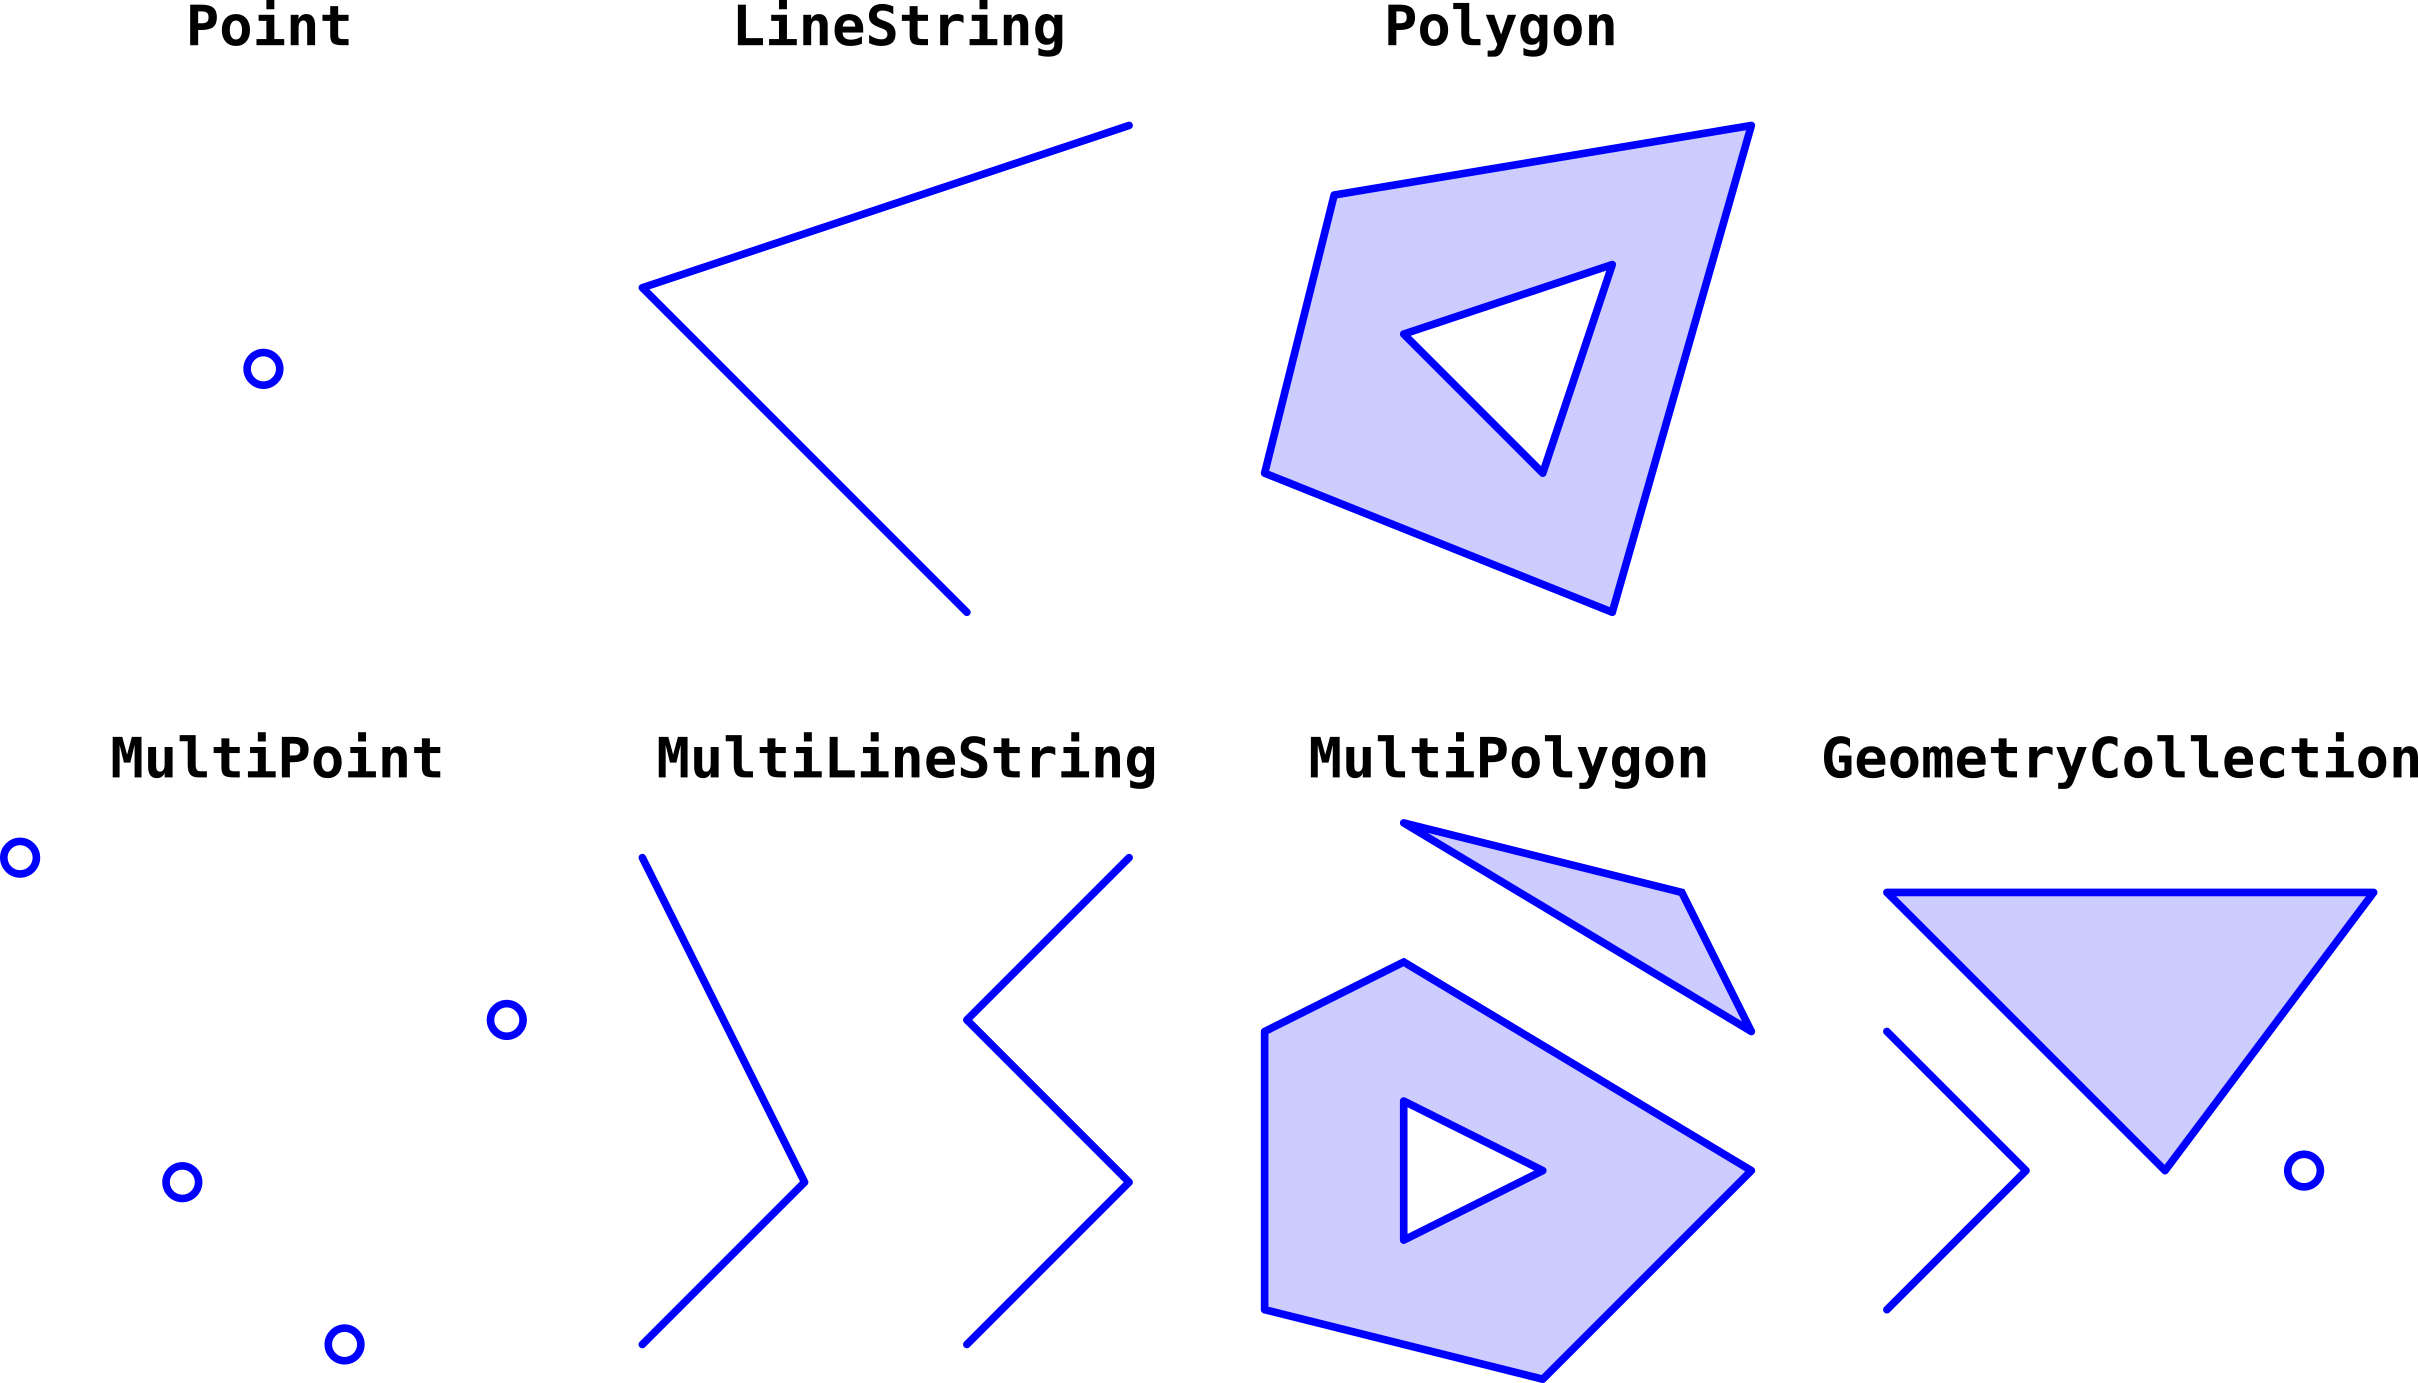
The GeoJSON format is a JSON-based geospatial data format, it allows representing different types of geometries, such as points, lines, and polygons, and also allows representing attributes associated with the geometries.
The GeoJSON format consists of two types of objects:
- Geometries: represent the shape and location of geospatial objects.
- Attributes: represent the information associated with geospatial objects.
An example of a GeoJSON object is as follows:
{
  "type": "FeatureCollection",
  "features": [
    {
      "type": "Feature", // Object type (Feature, FeatureCollection)
      "geometry": {
        "type": "Point", // Geometry type (Point, LineString, Polygon, MultiPoint, MultiLineString, MultiPolygon)
        "coordinates": [102.0, 0.5] // Geometry coordinates
      },
      "properties": {
        "prop0": "value0" // Attributes associated with the geometry
      }
    },
    {
      "type": "Feature",
      "geometry": {
        "type": "LineString",
        "coordinates": [
          [102.0, 0.0],
          [103.0, 1.0],
          [104.0, 0.0],
          [105.0, 1.0]
        ]
      },
      "properties": {
        "prop0": "value0",
        "prop1": 0.0
      }
    },
    {
      "type": "Feature",
      "geometry": {
        "type": "Polygon",
        "coordinates": [
          [
            [100.0, 0.0],
            [101.0, 0.0],
            [101.0, 1.0],
            [100.0, 1.0],
            [100.0, 0.0]
          ]
        ]
      },
      "properties": {
        "prop0": "value0",
        "prop1": {
          "this": "that"
        }
      }
    }
  ]
}
So the structure of a GeoJSON file is as follows:
- Object type:
- Feature: represents an individual geospatial object.
- FeatureCollection: represents a collection of geospatial objects.
- Geometry:
- Point: represents a point.
- LineString: represents a line.
- Polygon: represents a polygon.
- MultiPoint: represents a collection of points.
- MultiLineString: represents a collection of lines.
- MultiPolygon: represents a collection of polygons.
- Attributes: represent the information associated with geospatial objects. Attributes are represented as key-value pairs, they can be of different types, such as text, number, boolean, etc.
Deck.gl is a visualization framework with WebGL technology that provides a variety of easy-to-use 2D and 3D data visualizations compatible with large datasets.
Layers in deck.gl are defined in four categories:
-
Core Layers: Core layers are fundamental for generic data visualizations and are the most stable and compatible with deck.gl, such as GeoJsonLayer, ScatterplotLayer, etc.
-
Aggregation Layers: These layers aggregate input data and visualize them in alternative representations such as grids, hexagons, contours, and heatmaps. Examples include GridLayer, HexagonLayer, ContourLayer, HeatmapLayer, etc.
-
Geo Layers: These layers focus on geospatial visualizations and support popular formats and indexing systems. For example:
- TileLayer: To display maps based on tile mosaics.
- TripsLayer: To visualize movement trajectories over time.
-
Mesh Layers: These layers enable the visualization of 3D models, with experimental support for glTF format scenes. SimpleMeshLayer and ScenegraphLayer are examples.
Some of the most common layers are:
- GeoJsonLayer: Renders geospatial data in GeoJSON format.
- IconLayer: Represents rasterized icons at given coordinates.
- TextLayer: Renders text at given coordinates.
- BitmapLayer: Renders georeferenced images.
- ArcLayer: Renders elevated arcs connecting pairs of origin and destination coordinates.
- ColumnLayer: Renders extruded cylinders (tessellated regular polygons) at given coordinates.
More info: Layers API Reference
Base maps provide context for visualizing geospatial data. deck.gl integrates with various base map providers through two methods:
-
Overlay: Deck is displayed over the base map as an independent element. It is robust and suitable for 2D maps.
-
Interleaved: Deck integrates with the WebGL context of the base map, allowing layer hiding. Availability depends on the provider's APIs.
More info: Using with Map
import { DeckGL } from '@deck.gl/react';
import { GeoJsonLayer } from '@deck.gl/layers';
import Map from "react-map-gl";

/* GeoJsonLayer
* Represents data from the city of Vancouver in GeoJSON format
* Each polygon represents a city block
* The height of each polygon is based on the value of the valuePerSqm property
* The color of each polygon is based on the value of the growth property
*/
const geojsonLayer = new GeoJsonLayer({
  id: 'geojson-layer',
  data: 'https://raw.githubusercontent.com/visgl/deck.gl-data/master/examples/geojson/vancouver-blocks.json',
  opacity: 0.8,
  stroked: false,
  filled: true,
  extruded: true,
  wireframe: true,
  getElevation: f => Math.sqrt(f.properties.valuePerSqm) * 500,
  getFillColor: f => colorScale(f.properties.growth),
  getLineColor: [255, 255, 255],
  pickable: true
});
// Initial view state of the map, coordinates are for the city of Vancouver
// with camera tilt and orientation to give a 3D effect
const INITIAL_VIEW_STATE = {
  latitude: 49.254,
  longitude: -123.13,
  zoom: 11,
  bearing: 140,
  pitch: 60
};

<DeckGL
  initialViewState={INITIAL_VIEW_STATE} // Initial view
  controller={true} // Enable camera control
  layers={[geojsonLayer]}>
    <Map
        mapStyle="https://basemaps.cartocdn.com/gl/voyager-nolabels-gl-style/style.json"
        /> <!-- Background map using Mapbox and Carto services -->
</DeckGL>This React application demonstrates the capabilities of Deck.gl for interactive geospatial visualization. It allows users to explore world population data, filter by continent, adjust style parameters, and display additional information on hover.
- Interactive Map: Uses
react-map-glto render a base map and position the visualization. - World Population Data: Utilizes GeoJSON layers to display world boundaries and population data.
- Filtering by Continent: Allows users to select a specific continent to highlight countries.
- Dynamic Styling: Provides controls to adjust line width, color scales, and elevation based on population.
- Hover Interactions: Displays detailed information about countries on hover, including population estimates.
- Clone the repository:
git clone https://github.com/alexwing/deck.gl-demo-visualization-test.git
- Install dependencies:
cd deck.gl-demo-visualization-test npm install - Run the application:
npm start
Visit [live demo link] to experience the application interactively.
App.tsx: The main component that renders the application and handles global state.DeckMap.tsx: The main component responsible for rendering the map, layers, and handling user interactions.Utils.js: Contains utility functions for manipulation and color calculation.ToolsPanel.tsx: The component that provides controls to adjust style and data filtering.MenuTop.tsx: The component that provides controls to select two predefined views.db/: Stores GeoJSON data files (vancouver-blocks.geojson,world-population.geojson,spain.geojson).
- Libraries: React, react-map-gl, Deck.gl
- Data Format: GeoJSON
- Explore additional Deck.gl layers such as ArcLayer, HexagonLayer, and GridCellLayer.
- Integrate a legend to visualize the color scale and population distribution.
Use "react-map-gl": "5.3.21" version since starting from version 6.0.0, a Mapbox access key is required to use the map service. There already exists an open-source project called mapLibre that allows using Mapbox maps without the need for an access key. In principle, Mapbox usage limits are very generous, but if an application with a large number of users is required, it may be a limitation.
With v2.0, Mapbox GL JS became proprietary and requires a Mapbox account to use, even if you don't load tiles from the Mapbox data service. Community forks of the v1 codebase, like MapLibre GL JS, can usually be used as a direct replacement for mapbox-gl.
