- Getting Started
- Analysis code
- STEM Java program
- Contact
- Cite
- Copyright
Table of contents generated with markdown-toc
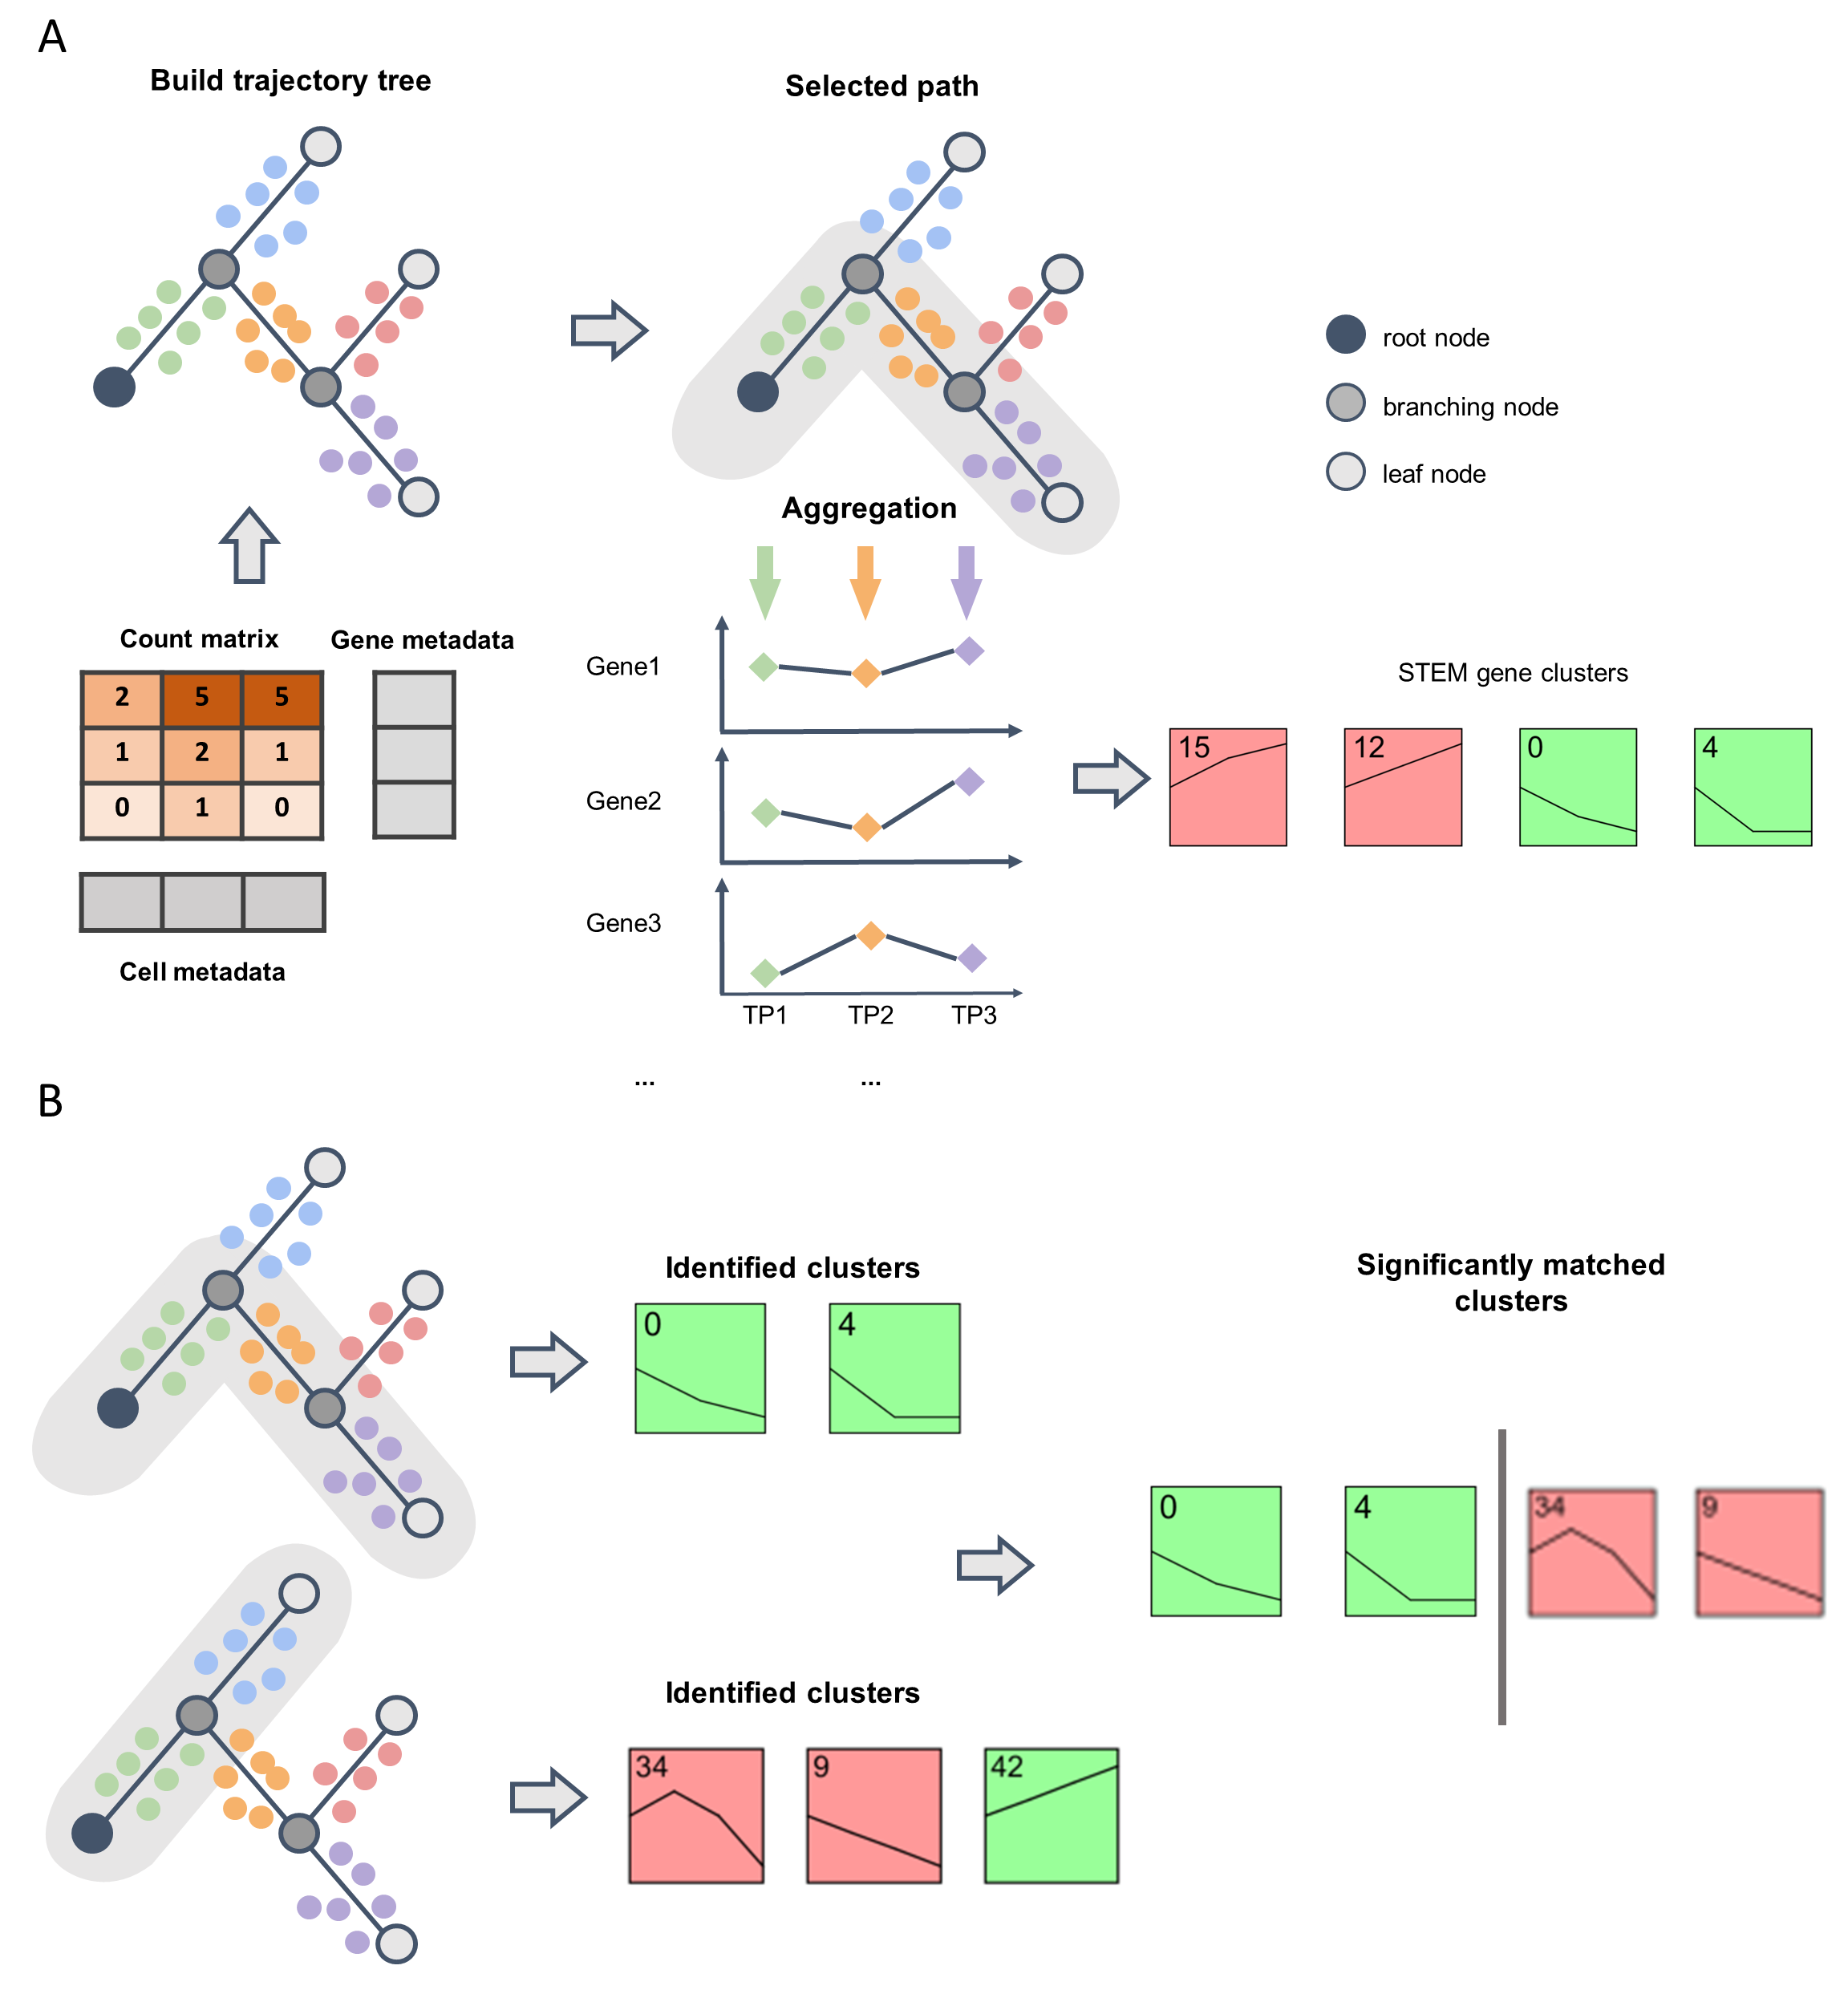
Single cell STEM (scSTEM) is a shiny app based R package for visualizing and clustering genes in pseudotime ordered single cell RNA-seq data. scSTEM is a GUI based tool and thus does not require any coding experience.
scSTEM may have system dependencies that differ for different OS. Different requirments for different OS are described here.
- Install docker from https://docs.docker.com/get-docker/. You may install scSTEM without installing docker. However, many trajectory inference methods might not be running correctly except for Monocle3.
- Instal Rtools from https://cran.r-project.org/bin/windows/Rtools/
Run the following commands to install Docker and other system depedencies (tested with Ubuntu 18.04):
# Install docker
sudo apt-get update && apt-get install -y --no-install-recommends \
    ca-certificates curl gnupg lsb-release
curl -fsSL https://download.docker.com/linux/ubuntu/gpg | gpg --dearmor -o /usr/share/keyrings/docker-archive-keyring.gpg
echo \
  "deb [arch=$(dpkg --print-architecture) signed-by=/usr/share/keyrings/docker-archive-keyring.gpg] https://download.docker.com/linux/ubuntu \
  $(lsb_release -cs) stable" | tee /etc/apt/sources.list.d/docker.list > /dev/null
sudo apt-get update && sudo apt-get install -y --no-install-recommends docker-ce docker-ce-cli containerd.io

# Install system dependencies
sudo apt-get install -y --no-install-recommends \
      	imagemagick libgdal-dev libhdf5-dev libudunits2-dev \
        libgeos-dev libproj-dev libgmp3-dev
You may install scSTEM without installing docker. However, many trajectory inference methods might not be running correctly except for Monocle3.
- Install docker from https://docs.docker.com/get-docker/. You may install scSTEM without installing docker. However, many trajectory inference methods might not be running correctly except for Monocle3.
- Install xcode if xcode has not been installed yet. To install, open terminal and type
xcode-select --installand then follow the prompts. - Install gfortran if gfortran has not been installed yet. You may find the gfortran version corresponding to your macOS here and download and install the package.
Once system dependencies have been installed, you may choose to install scSTEM by method 2.2 or 2.3 or 2.4. If you encounter any issues during installation, you may refer to 2.4 Trouble shootings or create a new issue under this repository.
For easy installation and reproducibility, you may use renv to install all dependencies and scSTEM. Make sure that you have 1) R version >= 4.1.0, download R here, 2) Java, download Java here installed and 3) internet access. We would recommend installing Rstudio to interact with R in an easy-to-use GUI. If R asks "Do you want to install from sources the package which needs compilation?", it is recommended to select No (or N). Below are installation steps using renv:
1.In R, execute the following code to install renv:
install.packages("renv")- Create a new directory to store dependency files for scSTEM (e.g.
/home/alex/scstem).renvwill later install dependencies into this personal folder. Download therenv.lockfile in this repository or right click and 'save as' from this link.renv.lockis the lock file which contains the dependency information. Note that when you copy and paste the content of renv.lock into a text editor and save the file, your text editor (such as the default TextEdit in macOS) may automatically append file extension after renv.lock. This will causerenvto fail becauserenv.lockfile cannot be found. Double-check the file name and its extension. Remove any extensions afterrenv.lock(e.g..rtforRTF). - Once lock file is downloaded, copy the file into the folder you just created. Make sure the file name is 'renv.lock'. Then in R, execute the following code to activate the environment in this personal folder.
install_folder = "/home/alex/scstem/"
renv::activate(install_folder)
# "/home/alex/scstem/" is the path to the directory we just created (The direcotry where the renv.lock file should be saved.)
# You will need to replace them with your own directory and path.- Once the environment is activated. Install all necessary files into this personal folder simply by using the following code.
renv::restore(prompt = F)
- How to run and exit scSTEM. To activate the project environment and run scSTEM, simply executing the following code. R will then load all dependencies from the folder we just created.
renv::activate(install_folder)
library("scSTEM")
run_scstem_GUI()
Where install_folder is the project folder we just created to install scSTEM.
After analysis is done, you may deactivate the project environment for scSTEM, simiply by executing the following code:
renv::deactivate()- How to uninstall scSTEM
Thanks to
renv, uninstalling scSTEM is quite easy. The only thing you need to do is just removing the folder (in this tutorial, "/home/alex/scstem/"). This would not impact other packages you installed for R.
Make sure that you have 1) R version >= 4.1.0, download R here, 2) Java, download Java here installed and 3) internet access. We would recommend installing Rstudio to interact with R in an easy-to-use GUI. Execute the following code to install all R dependencies. If R asks "Do you want to install from sources the package which needs compilation?", it is recommended to select No (or N). If windows users are seeing "Rtools is required to build R packages but is not currently installed" during installation, you may instal Rtools from https://cran.r-project.org/bin/windows/Rtools/
# Install devtools
install.packages('devtools')

# Install Bioconductor (for R >= 4.1.0)
if (!requireNamespace("BiocManager", quietly = TRUE))
  install.packages("BiocManager")
BiocManager::install(version = "3.13", ask = FALSE)

# Install Bioconductor dependencies
BiocManager::install(c('BiocGenerics', 'DelayedArray', 'DelayedMatrixStats',
                       'limma', 'S4Vectors', 'SingleCellExperiment',
                       'SummarizedExperiment', 'batchelor', 'Matrix.utils'), ask = FALSE)

# Now, install monocle3 through the cole-trapnell-lab GitHub, execute:
install.packages("devtools")
devtools::install_github('cole-trapnell-lab/leidenbase', upgrade = "always")
devtools::install_github('cole-trapnell-lab/monocle3', upgrade = "always")

# Install biomaRt
BiocManager::install("biomaRt", ask = FALSE)

# Install ROGUE
devtools::install_github("PaulingLiu/ROGUE", upgrade = "always")

# Install Dynverse
devtools::install_github("dynverse/dyno", upgrade = "always")

# Install scSTEM
devtools::install_github("alexQiSong/scSTEM", upgrade = "always")make: gfortran: No such file or directory. MAC users may see the following error message:
make: gfortran: No such file or directory
make: *** [cigraph/src/AMD/Source/amd.o] Error 1
ERROR: compilation failed for package 'leidenbase'
The solutions are described below, quoted from https://cole-trapnell-lab.github.io/monocle3/docs/installation/
- The above error indicates that you need to install gfortran on your computer (for Mac users only). In order to do so,
- Make sure that you have Xcode command line tools installed on your computer.
- Remove other gfortran installations if they exist. For this, you can launch a terminal window and type "which gfortran". If you see a path returned (e.g. /usr/local/bin/gfortran) you have a previous installation of gfortran that needs to be removed.
- Download new gfortran binaries for your operating system from here and decompress the folder (eg: gunzip gfortran-8.3-bin.tar.gz).
- Then run, sudo tar -xvf gfortran-8.3-bin.tar -C / which will install everything in /usr/local/bin/gfortran.
API rate limit exceeded. This is because the dependent packages forscSTEMuseGitHubAPI, which has been limited 60 requests by default. To increase the limit, you can execute the following code in R:usethis::create_github_token(). This will take you to yourGitHubaccount page (you may register a new account if you haven't done so), where you can generate a new token. Once this new token has been created. You may run the following code in R:usethis::edit_r_environ(). This will take you to the R environment variable editor, where you can specify your token byGITHUB_PAT = 'your_token'. Replaceyour_tokenby the token you just created then close restart R and resume the installation steps.- If you encounter error message related to Xcode, open terminal and type xcode-select --install and then follow the prompts. This is required by Monocle 3.
- If you don't see the package installation information after running
renv::restore(prompt = F)but instead only see a message* The library is already synchronized with the lockfile.This is probably because your text editor (such as the default TextEdit in macOS) may automatically append file extension afterrenv.lockwhen you save the content by the text editor. This will causerenvto fail becauserenv.lockfile cannot be found. Double-check the file name and its extension. Remove any extensions afterrenv.lock(e.g..rtforRTF).
We have provided a sample data set for running the analysis. You may click Load sample data in the GUI to automatically load the sample data set. Alternatively, you may also download the sample data set (https://github.com/alexQiSong/scSTEM_sample_data) and load it manually.
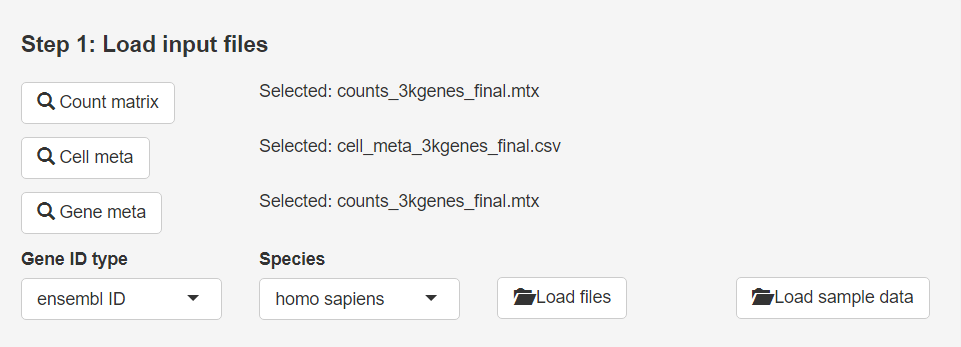
scSTEM uses three files as input (See also the sample data set in 3. Sample data sets):
- a expression count matrix in *.mtx format with rows representing genes andcolumns representing cells.
- a cell meta data table file in *.csv format, in which each row represents a cell. The file should contain at least two columns named ’cell_id’ and ’time_point’,where column ’timepoint’ contains time point information for each cell and should only include numeric data. Cells will be sorted by column ’time_point’ by ascending order and time point at the top is considered as the earliest time point. Cells and milestone nodes mapped to that time point are considered as starting cells and root node.
- a gene meta data table file in *.csv format, in which each row represents a gene.The file should contain at least a column named ’geneid’.
scSTEM output files:
- cluster gene table (table can be saved inside STEM java GUI)
- Enriched GO term table (table can be saved inside STEM java GUI)
scSTEM analysis involves running dimensionality reduction, cell clustering, trajectory inference, and gene clustering. While the functionality of dimensionality reduction and cell clustering is provided here to facilitate users to choose cells of interest, they are optional for the following steps. The steps of running analysis with GUI is described below. We will use the sample data set at https://github.com/alexQiSong/scSTEM_sample_data as an example showing the analysis functionality. This data set contains human fetal immune blood cells and was published with Cao et al., 2020. Note that internet connection is required as scSTEM may convert gene IDs using biomaRt which converts the gene IDs using ensembl database.
To launch the scSTEM GUI, execute the following code in R:
library(scSTEM)
run_scstem_GUI()- Step 1: Load input files. Click each of the three buttons on the top of the GUI to select corresponding input files. Click
Load filesto load all selected files. If files were successfully loaded, there will be a line of text showingAll files successfully loadedin the top panel. Once the sample data set is downloaded, select the path for each input file and select the gene ID type and species. For ID type, gene symbol and ensmebl ID are supported and for species, human and mouse are supported.
Alternatively, you may load sample data set by clicking the "Load sample data" button. It automatically loads the sample data set for this tutorial. This is the data set from a publised researchCao et el., 2020.
- Step 2: Visualizing and clustering cells. In the second panel, scSTEM can perform dimensionality reduction and cell clustering. This step can be optional for some trajectory inference methods but is required if
monocle3is selected as trajectory inference method. This step also provides 2D UMAP visualization that assists users to select cells of interest. If this step is skipped, scSTEM will take all cells from the input expression count matrix. To visualize dimensionality reduction results, first clickRun UMAP. Then there is an argumentPCA dim(default value 100) that may be provided by users before running UMAP.PCA dimspecifies the number of dimensions for principle component analysis, which is a preprocessing step to denoise and decorrelate input dimensions before running UMAP.
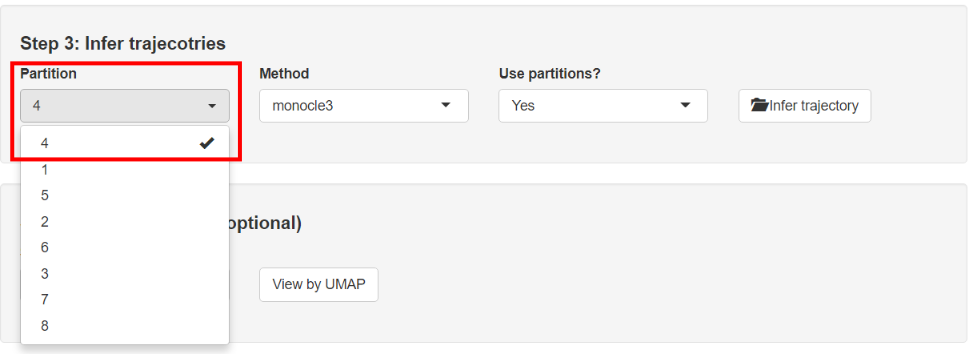
After UMAP is done, click Run Clustering and then Visualize Results. For the sample data set, we can see the cell partition number is displayed along with the cells. Let's focus on partition 4 highlited by green color here. For the sample data set, partitions may bi numbered differently on different OS. You may find the partition shown in the figure below numbered by a different number.
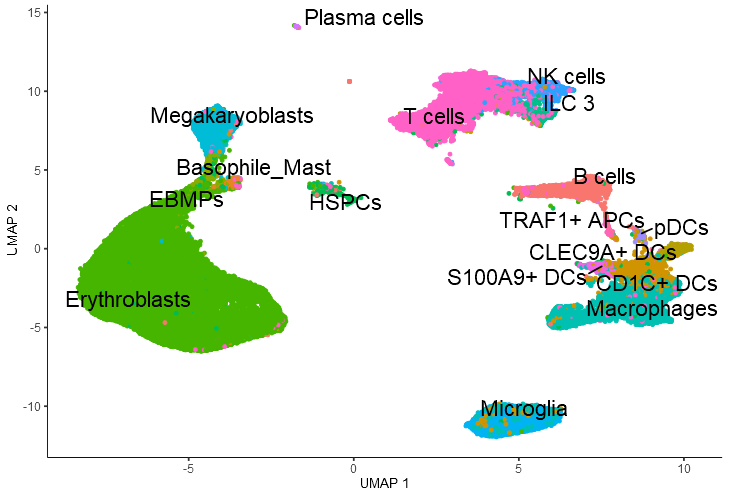
Further, scSTEM also allows for coloring the cell clusters using different column information from the cell_meta_data file other than the cell partition numbers from clustering. This would allow you to view the cells by cell type or experimental batches or other meta data information. But make sure the number of unique labels to visualize is not too many otherwise the application may crash. In this tutorial, we visualize the cell cluster by selecting Blood_cell_name from the column_to_visualize dropdown list.
Now you will see that instead of showing cell partition number (default option), the UMAP plot is colored and labeled by blood cell type name.
- Step 3: Infer trajectories. In the third panel, scSTEM can perform trajectory inference. To infer trajectories for the input data, simply select cell partitions of interest from the
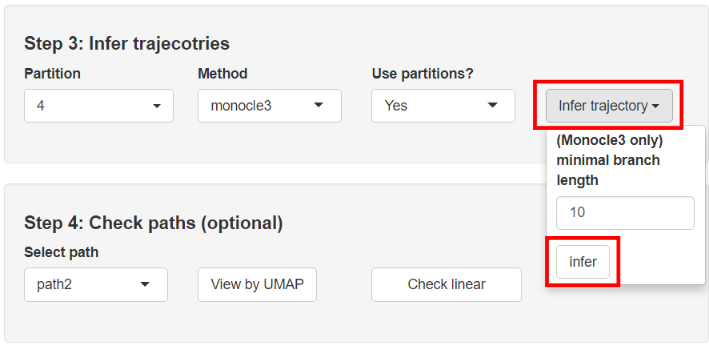
partitiondrop-down list (generated from the second step) and then select trajectory inference method from theMethoddrop-down list. Once partition andMethodwere selected, users can clickinfer trajectoryto infer trajectories. For this sample data set, let's select partition 4 andmonocle3from theMethodlist to infer trajectoryies. Theuse partitionoption is only valid formonocle3as inference method. Once selected, monocle3 will infer disjoint trajectory graph separately for each cell partition.
Note that for monocle3, you may prune the trajectory to avoid having too may small branches. You could do this by tunning the parameter in the Infer trajectory dropdown list, where you can enter a value of minimal branch length (Larger value will result in less small branches, default value = 10, only effective when Monocle3 is the inference method). After this is done, you may click infer button to infer the trajectory.
- Step 4: Check paths. In the fourth panel, users may 1) visualize the paths inferred by the previous step and 2) check linear fit for each path. For visualization, the selected path is highlighted by red color and cells mapped to the path is marked by yellow color. Let's select
path1to visualize. Selected path will be shown on the right part of the GUI.
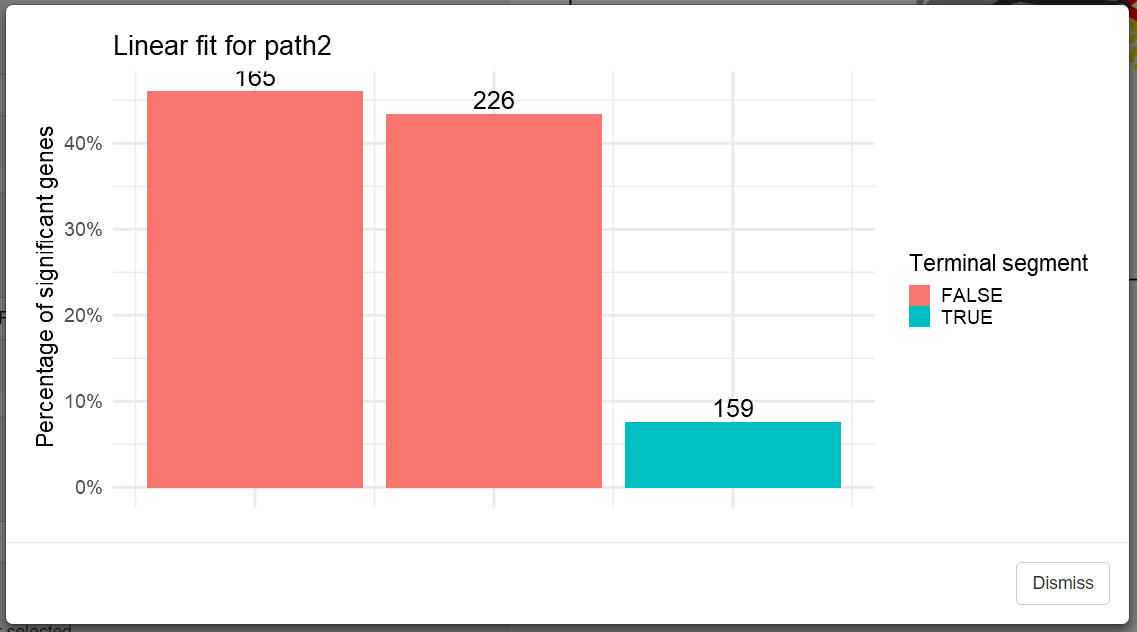
In addition, we may also be interested in testing whether the change of expression is linear for each gene along the trajectory path. scSTEM can do a quick check by fitting linear models using expression of each gene to predict cell pseudtime on each segment of a selected path in Step 4 panel. Users may do this by clicking on the check linear button in the Step 4 panel. After fitting is completed, a plot will appear in a pop-up window showing the percentage of genes which has significant "good fit" from F test. As shown below, Terminal segment represents the segment located at the end of a trajecotry path and otherwise not.
- Step 5: Run STEM analysis. In the fifth panel, users can perform scSTEM analysis. Currently there are two parameters
metricandpathto be specified for scSTEM.metricspecifies the method to summarize expression data from trajectories. Users can selectmean,entropy_reduction, orchange_ratefrom themetricdrop-down list. In theselect a pathdrop-down list, users can specify a path of interest to run scSTEM clustering (which can be visualized in step 4). Users will need to provide an output folder where output files and temporary files can be saved. Click theoutput folderbutton to specify an output folder. In this sample data set, let's selectpath2andpath3in theselect a pathdrop-down list, andmeanin themetricdrop-down list to run the STEM analysis.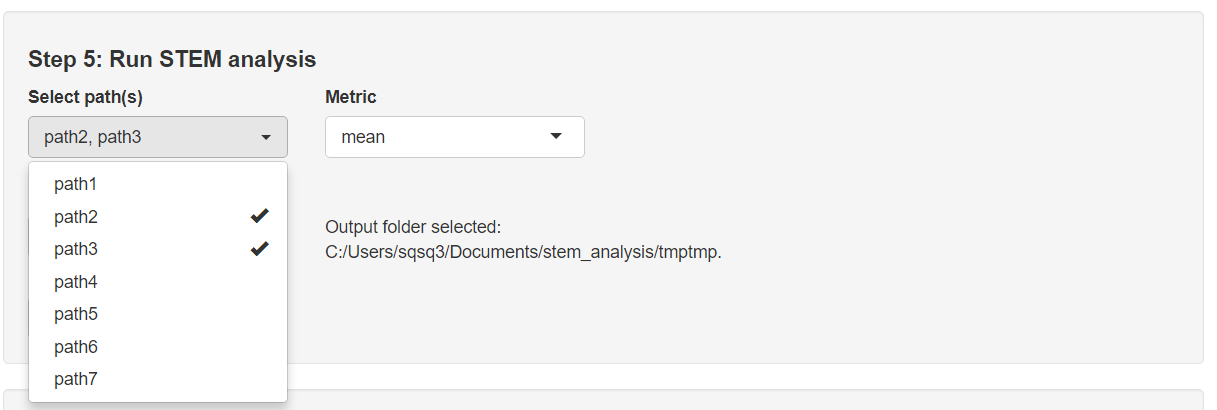
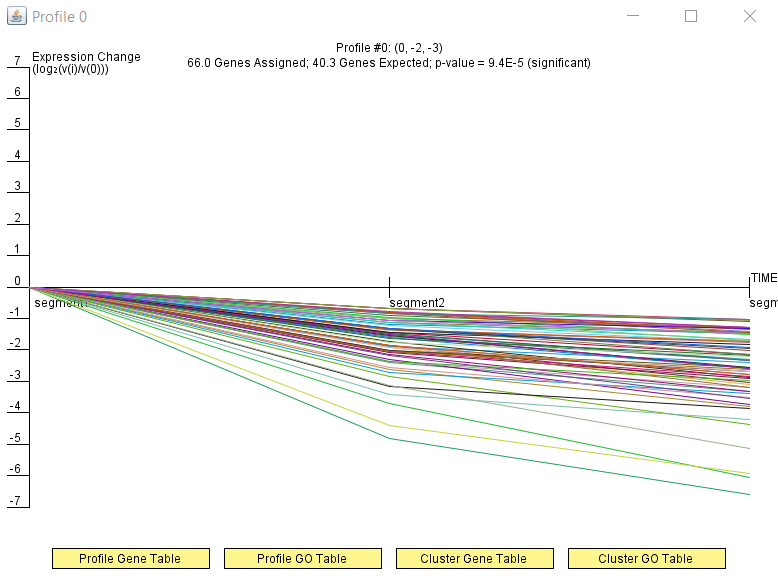
scSTEM will iterate through the selected paths and generate clusters for each of the path. This is done by calling the STEM java program. The STEM java GUI will show the profile plots after clustering is finished. In the screenshot shown below, profiles with the same color together represent a gene cluster.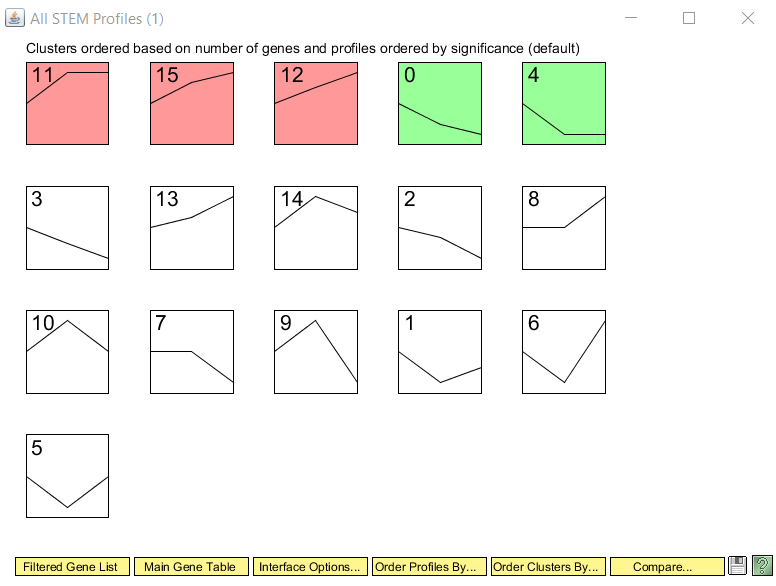
Users may further click the profile to have a detailed view of gene expression pattern in the pop-up window, in which users may also view and save the cluster gene and GO annotations by clickingCluster Gene TableandCluster GO Table, respectively.
- Step 6: Run comparative analysis. In the sixth panel, users can perform comparison of gene clustering results from different trajectory paths. To do this, first select the two paths to be compared in the two drop-down lists
Path name 1andPath name 2, then click theRun comparisonbutton. scSTEM will call STEM java program to run gene clustering and comparison of clustering results for the selected paths. For this sample data set, let's selectpath2andpath3from the drop-down lists to compare. After clustering is done, STEM java program will show a cluster comparison plot with each row representing the matched clusters from the two paths.
To zoom-in the plot, you may hold and drag the right mouse. To move the plot in the window, you may hold and drag the left mouse.
Upgrade existing version of scSTEM is quite easy with a single line of code in R:
devtools::install_github("alexQiSong/scSTEM", upgrade = "always")Note that you will need to activate the corresponding environment before upgrading scSTEM if you installed it by renv (See 2.1, 5):
renv::activate(install_folder)Code for the analyses performed in scSTEM publication can be found under /analysis. The results presented in the publication were generated with R 4.1.0 on Windows10. Other OS may yield slightly different results. For other figures and results not produced by the scripts here, they can be generated by the scSTEM GUI.
We have made changes to original STEM Java prgram as in https://github.com/jernst98/STEM_DREM. The modified version of STEM, along with its source code, can be downloaded from: https://github.com/alexQiSong/scSTEM-STEM-java
Contact us if you have any questions:
Qi (Alex) Song: qisong@andrew.cmu.edu; sqsq3178@gmail.com
Ziv Bar-Joseph: zivbj@andrew.cmu.edu
Please cite the following paper if you used scSTEM in your research.
Qi Song, Jingtao Wang, Ziv Bar-Joseph. scSTEM: Clustering pseudo-time ordered single cell data. Genome Biology. 2022;23(1):150.
©2021 Qi Song, Ziv Bar-Joseph. Systems Biology Group at Carnegie Mellon University. All rights reserved.

