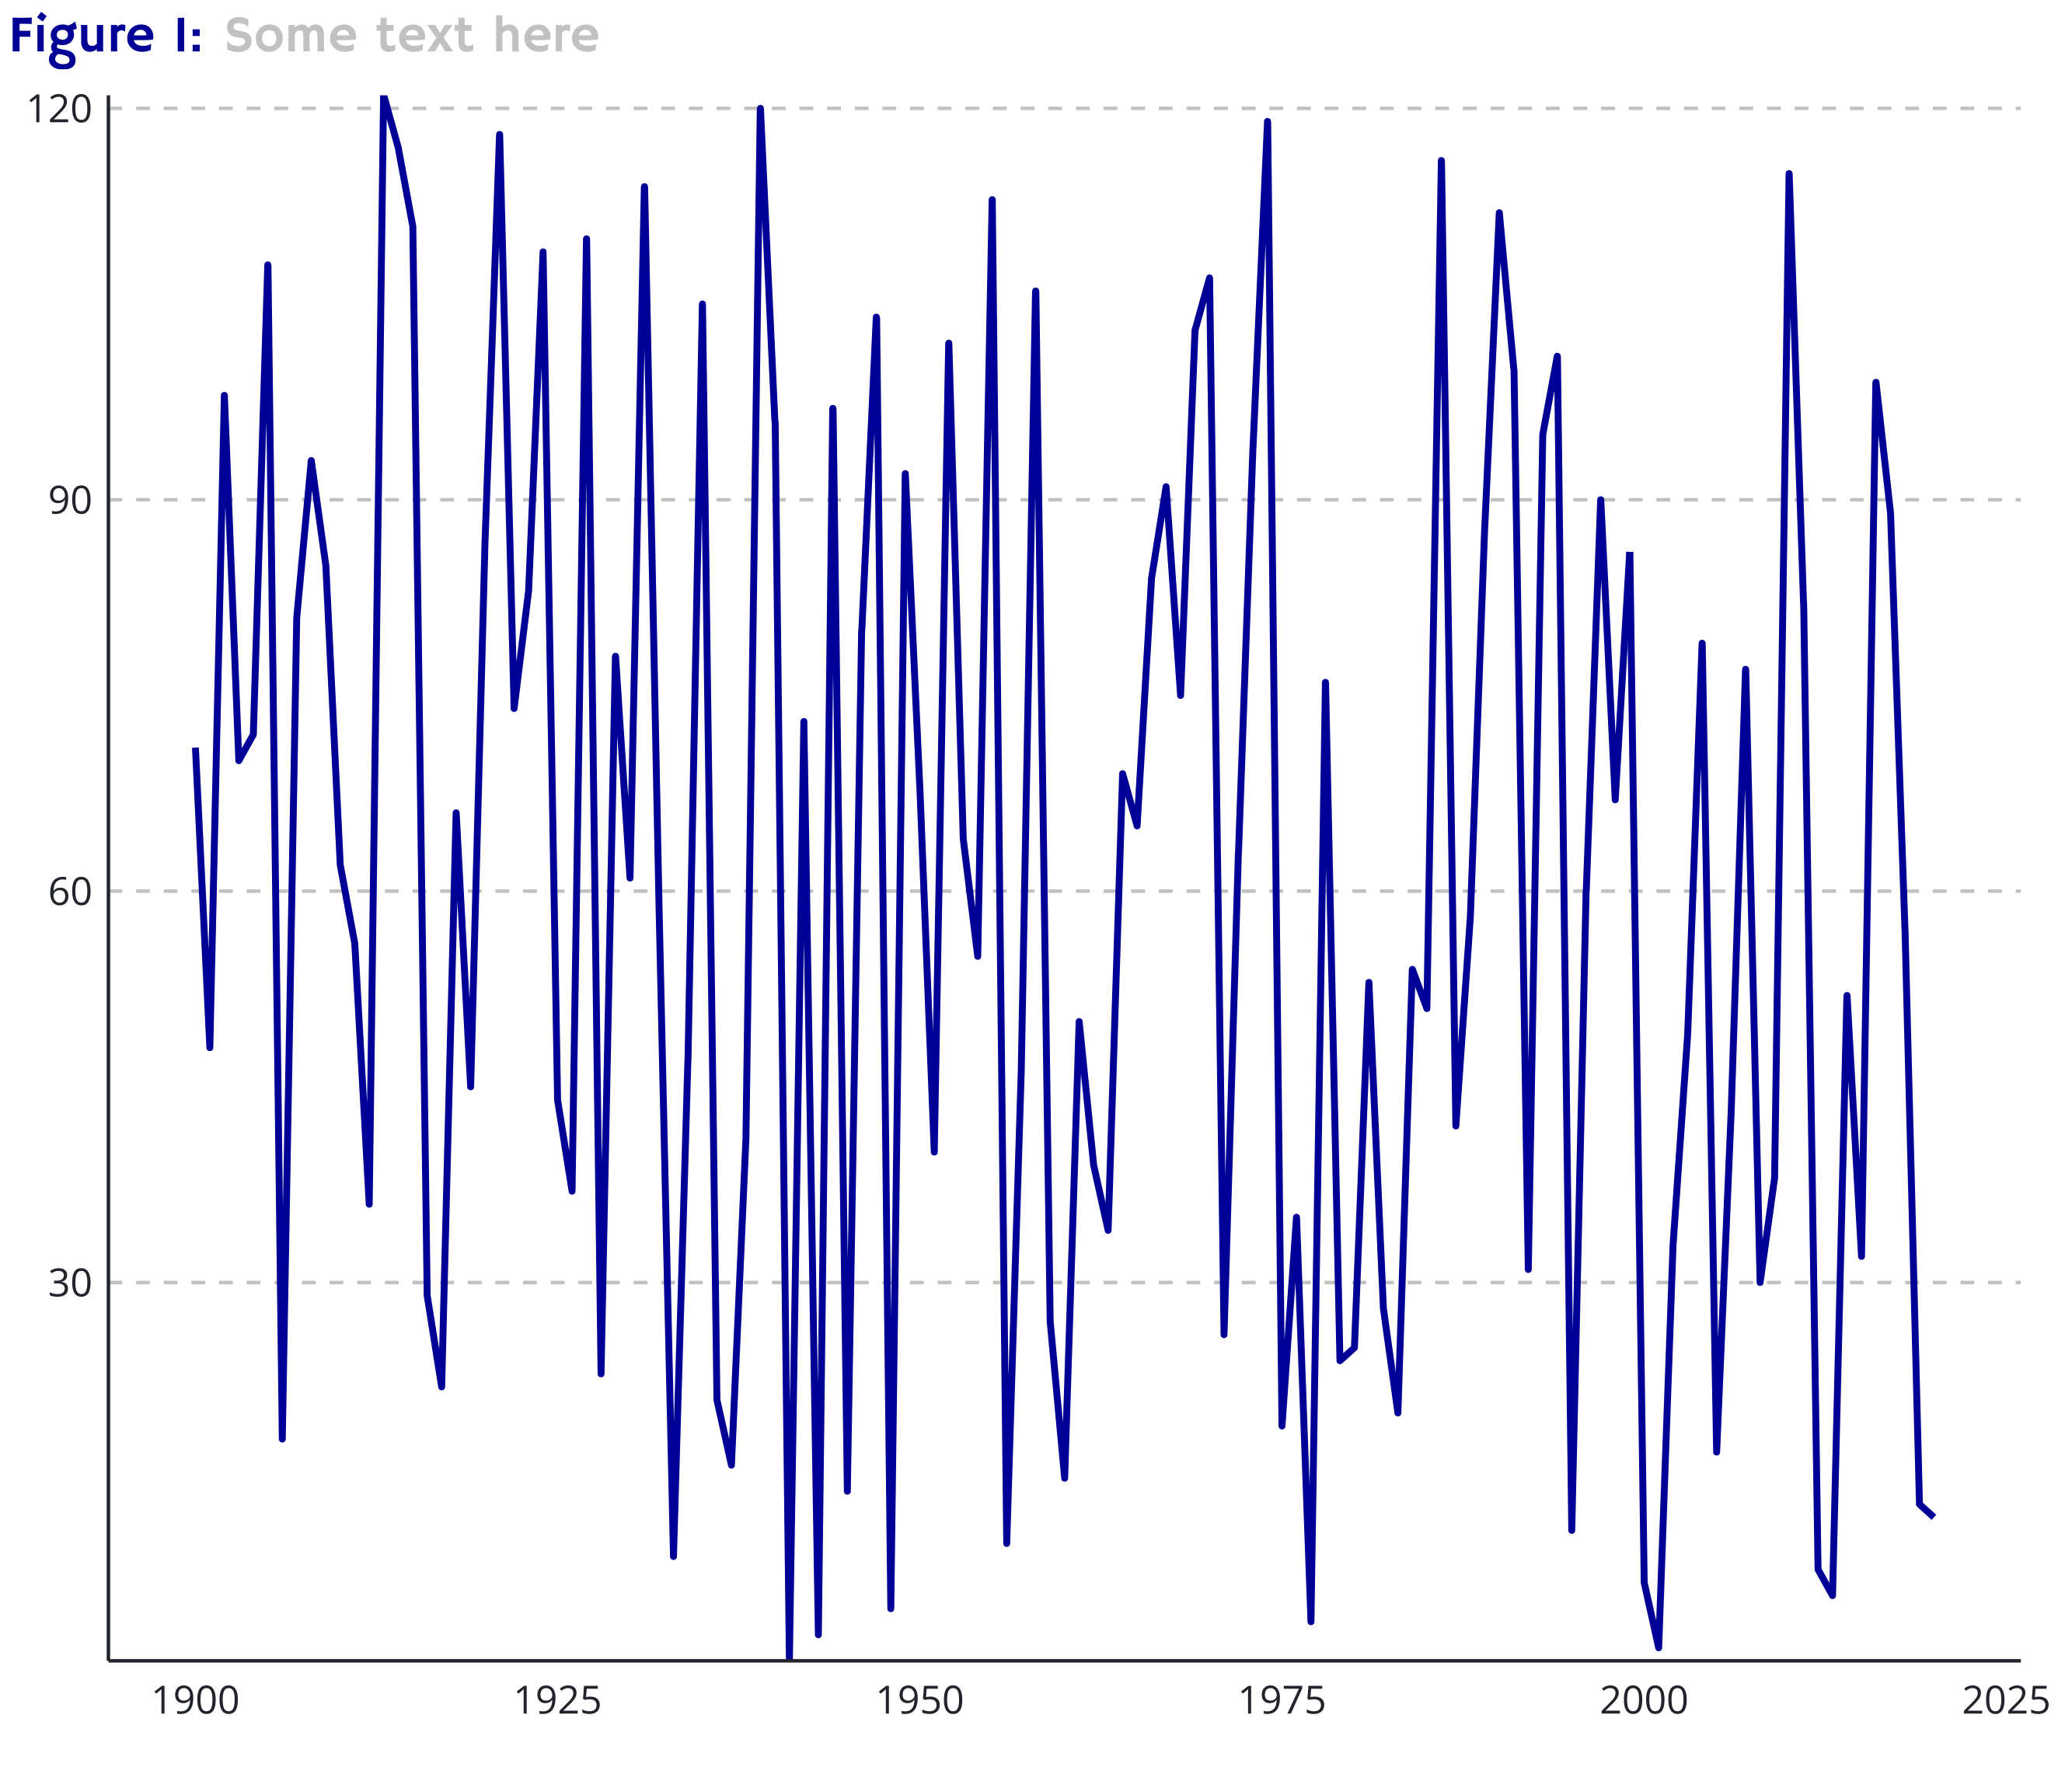
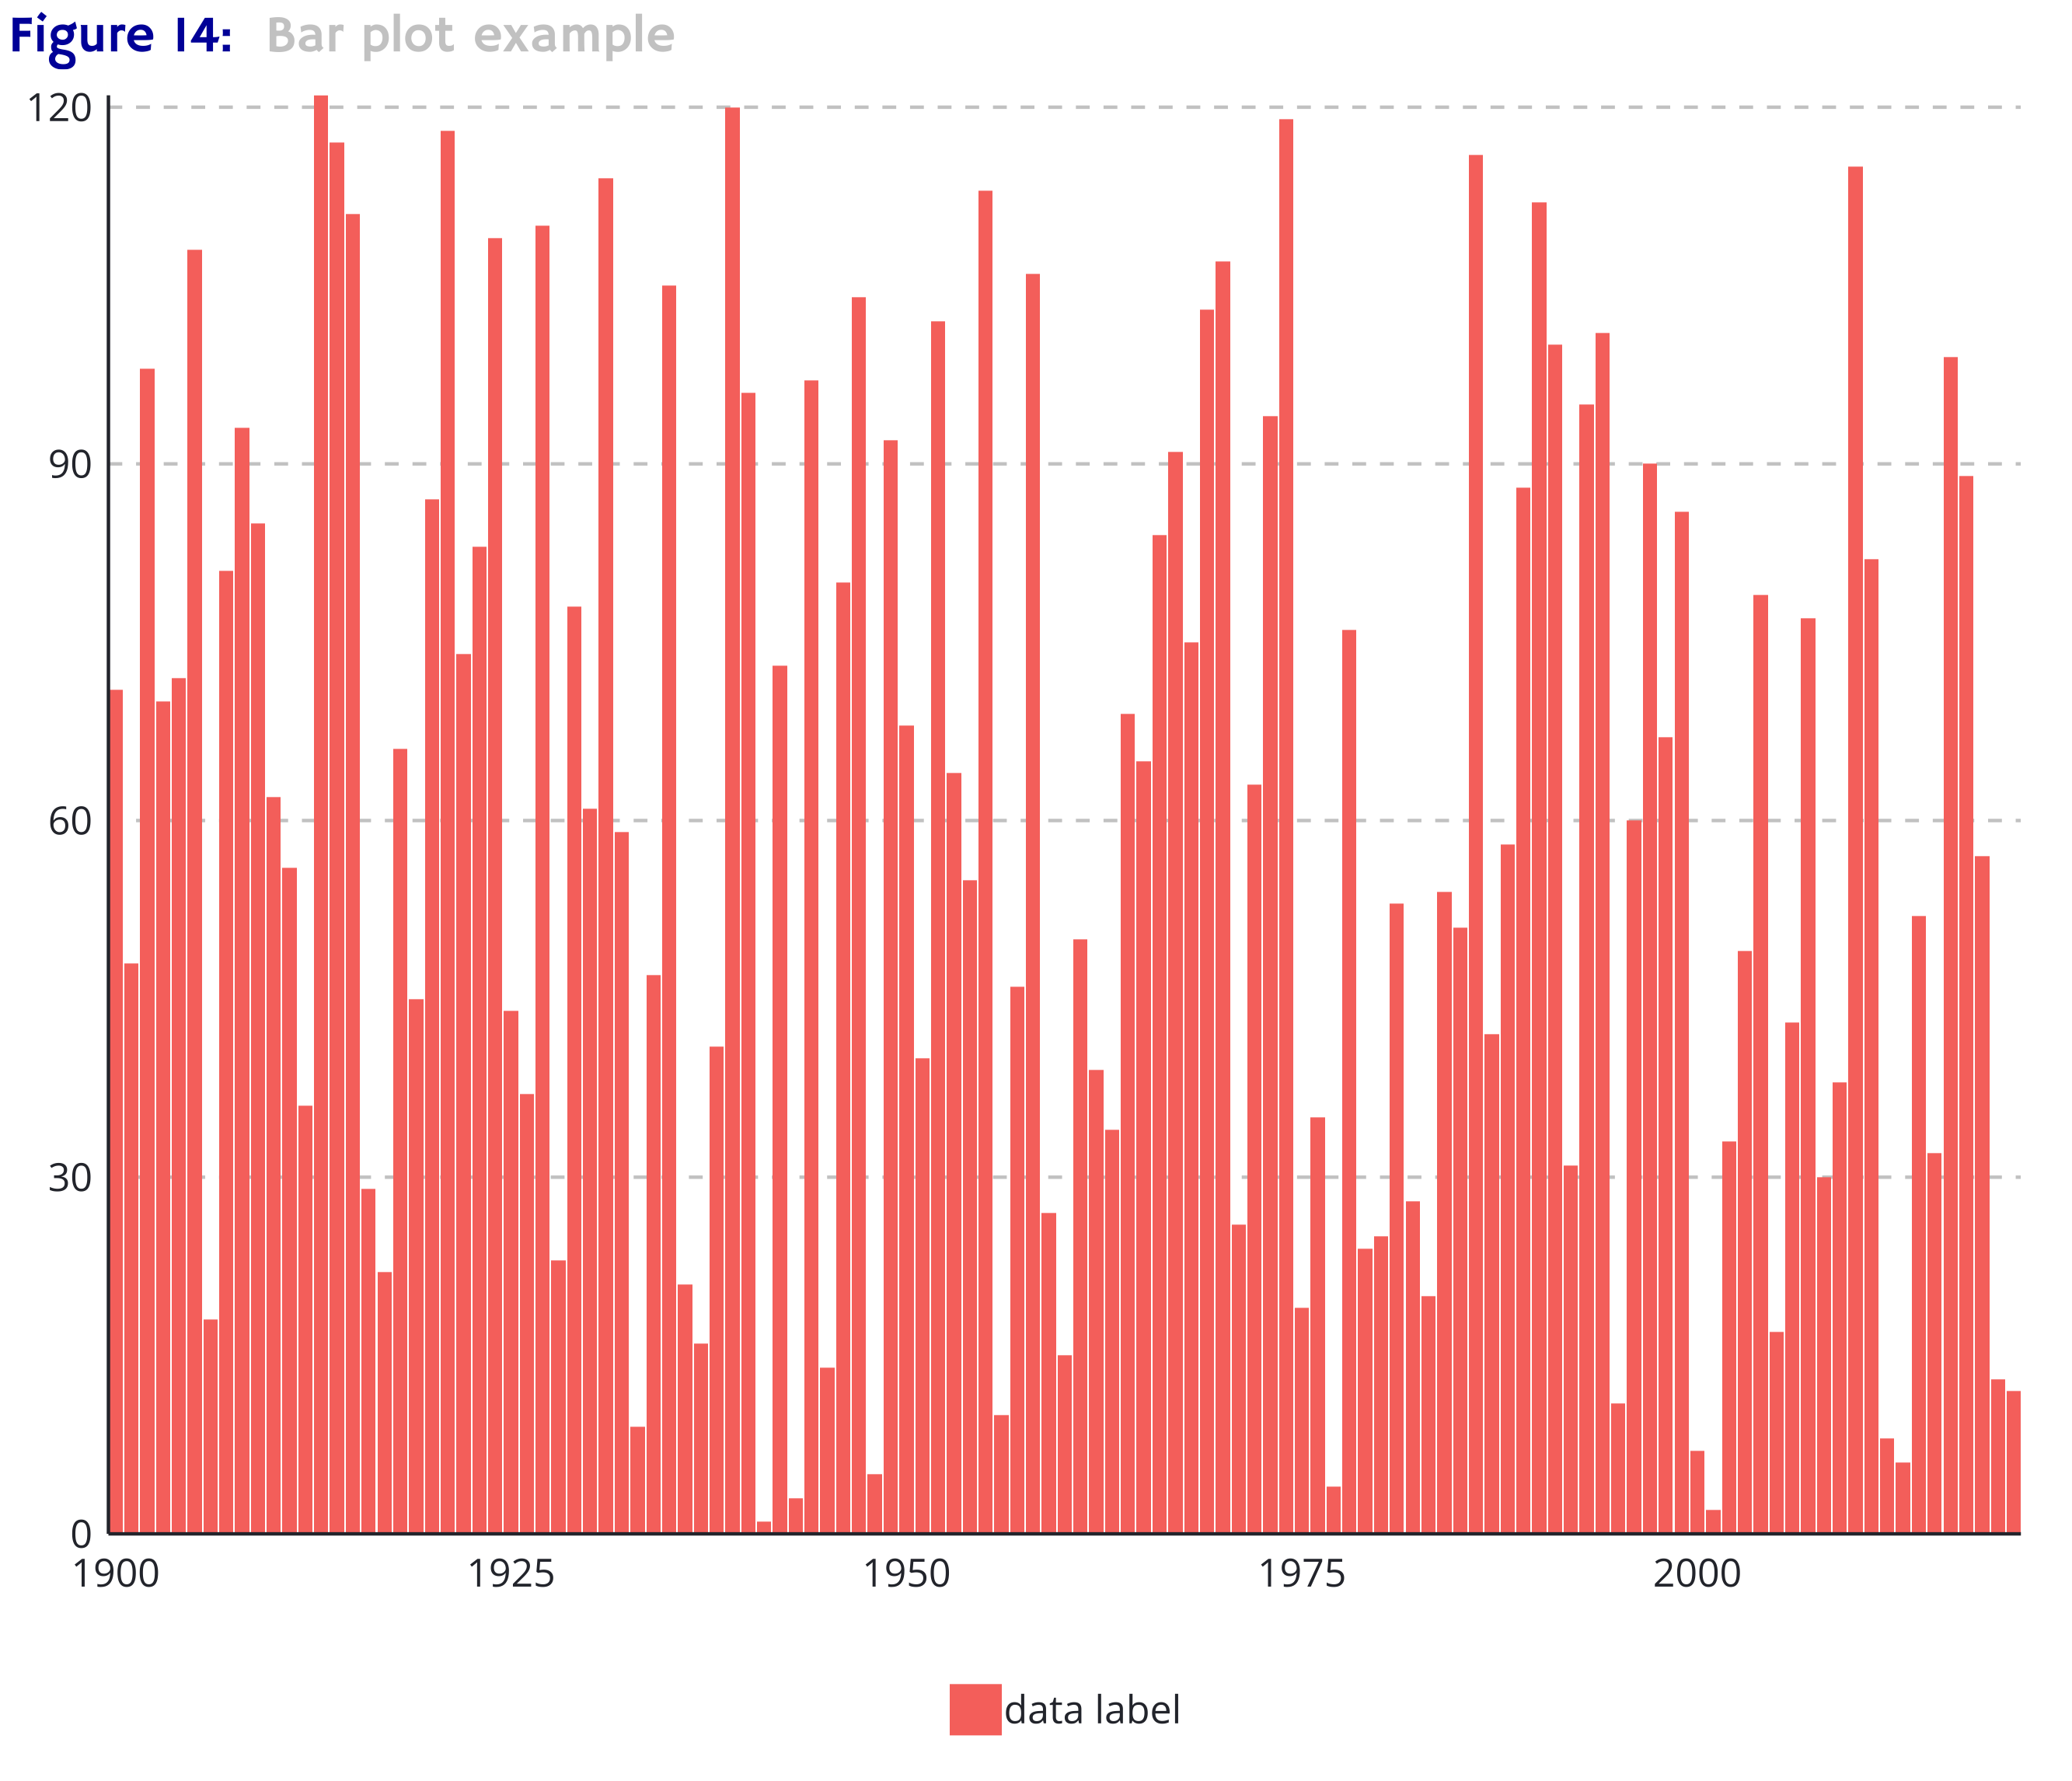
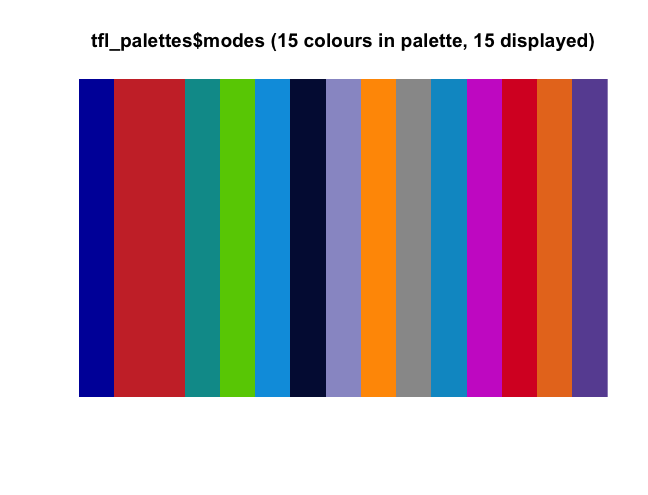
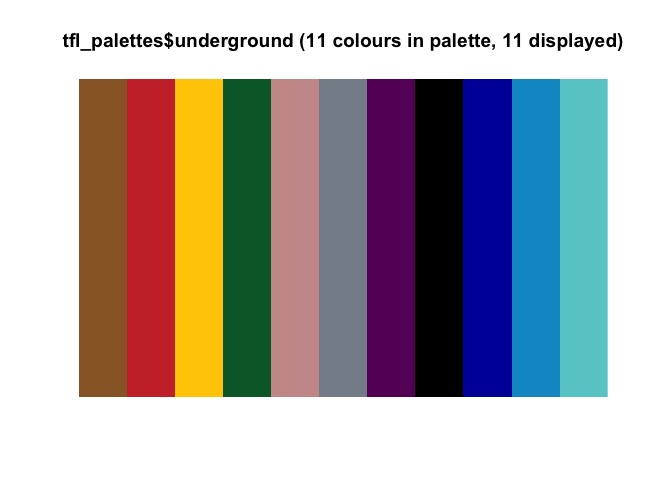
This repo is inspired by the excellent BBC bbplot package, and aims to provide helpful functions to produce graphics made using ggplot2 with colours used by Transport for London (TfL). These colours used in this package can be found in the TfL Digital Design Guide. Please note that this is not endorsed by Transport for London and is a personal project to learn how to create packages in R.
This package is not available on CRAN and as such must be installed using the devtools package.
devtools::install_github('alex-drake/tflplot')
tfl_style() has no arguements. Add it to the ggplot chain after you have created a plot. It adds a theme similar to that seen on charts published on the TfL website. You would use it in your workflow like so:
p <- ggplot(data=df, aes(x=year, y=vals)) +
  geom_path(size=1, color = tfl_cols("lu blue")) +
  tfl_style()
tfl_cols() is a list of named colours as defined in the TfL Digital Design Style Guide. It can be called to get the HEX code for a particular mode, or can be called without arguements to see all availabe colours. For example, you could request the HEX code for London Buses by using tfl_cols("buses") or the London Underground line "Bakerloo" by calling tfl_cols("bakerloo").
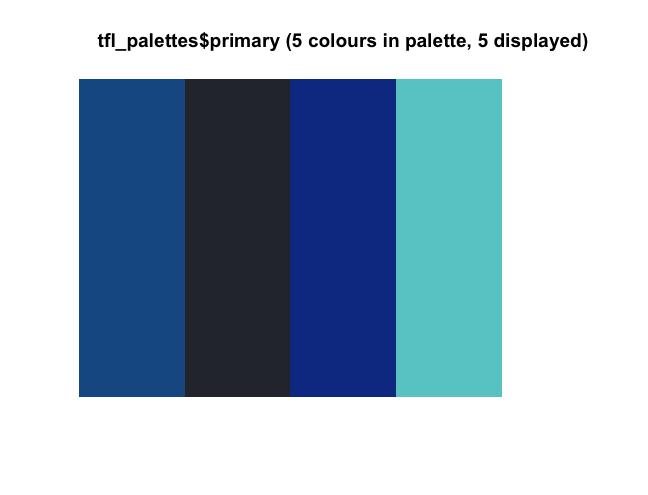
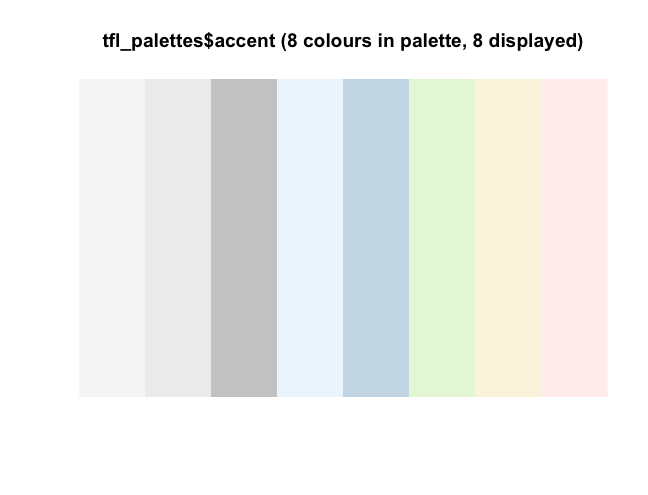
tfl_pal() can be used to extract n colours from a named palette (eg "underground") if discrete colours are required. It can also be used to interpolate colours if you are displaying continous data.
view_palette() is a utility function that allows you to view the colours in your requested palette eg view_palette(tfl_pal(palette="underground", n=8, type="discrete"))
finalise_plot() will save your plot, ready for publication (or whatever you want to do with it). It will add a caption to the top left of the chart, along with figure number/reference. It will then be saved using the specified filepath.
finalise_plot(plot_name = p,
              caption = "Smart Caption",
              figure_number = 14,
              save_filepath = "filename.png",
              width_pixels = 640,
              height_pixels = 550)
- Option to merge palettes (modes and underground?) to use unique colours in discrete scales where originally requested palette doesn't have enough colours
- Using GoogleFonts (Hammersmith One + Open Sans?) as an alternative but can't render them in RStudio at the moment - must view outputs post-export. Would like to use Johnston100 for official font but requires appropriate license to use
