akshataupadhye / Analysis-of-world-CO2-emissions

Analysis of world CO2 emissions : A Data Visualization project to manifest the power of data visualization in the process of understanding and exploring data. πŸ“Š

Home Page:https://public.tableau.com/app/profile/akshata.upadhye/viz/CO2Emissions_16303731687290/Dashboard1

Geek Repo:Geek Repo

Github PK Tool:Github PK Tool

Analysis of world CO2 emissions : A Data Visualization project.

CO2 Emissions Data Viz

About the project

β€’ This is a Data Visualization project to manifest the ✨ power of data visualization in the process of understanding and exploring data.
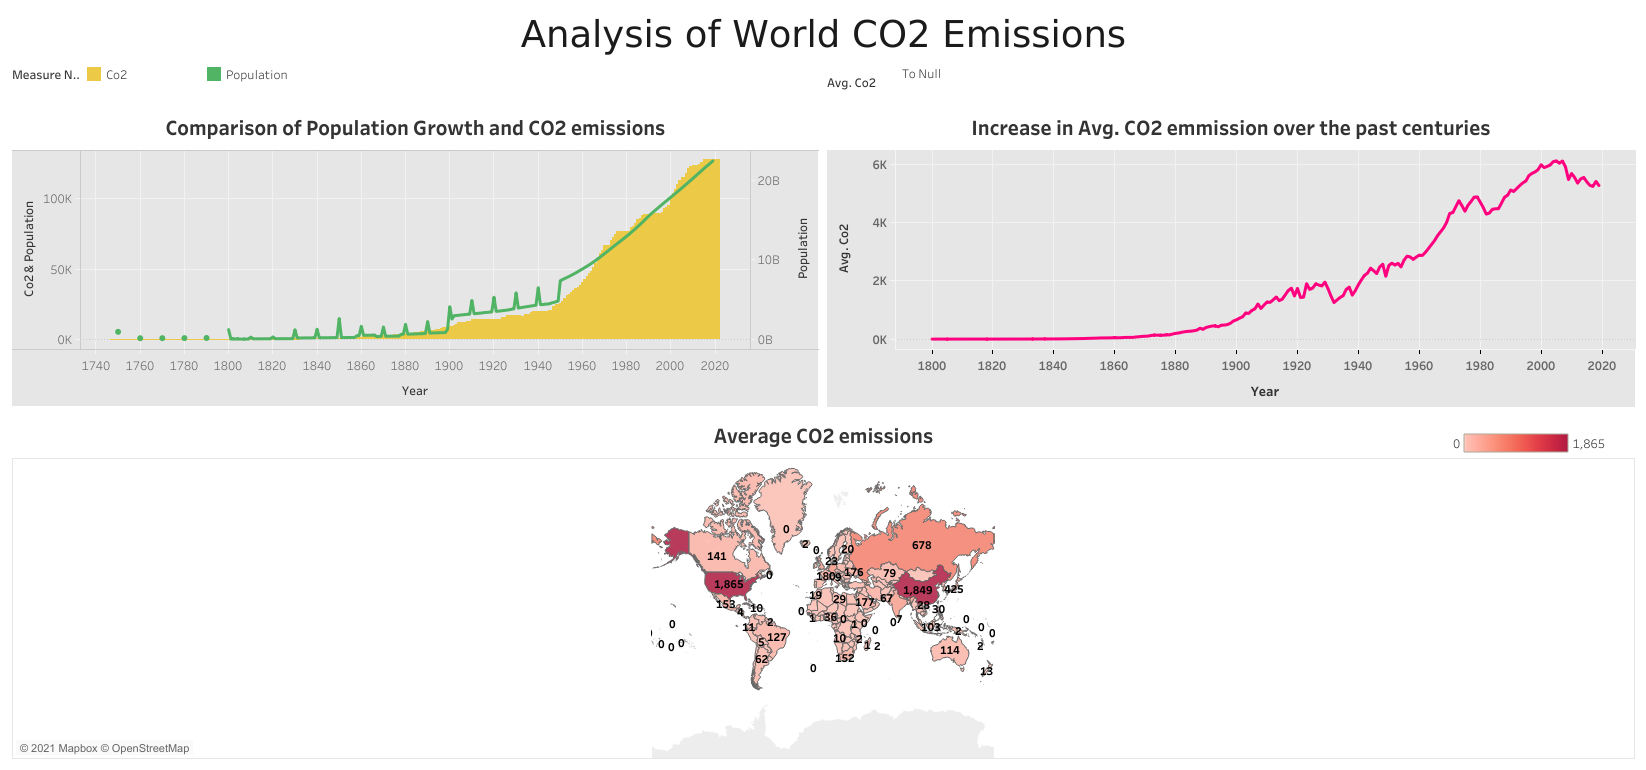
β€’ This project showcases lucid visualizations in Tableau to analyze 6.5 million records to unlock insights about the increasing CO2 emissions over the past centuries leading to the global warming in order to create awareness among the people.

β€’ The visualizations are created to analyze the average contribution made by different countries towards the CO2 emissions beginning from early 1800's and compared the growth in population versus the increasing CO2 emissions.

This tableau dashboard is available to view publicly here .

About

Analysis of world CO2 emissions : A Data Visualization project to manifest the power of data visualization in the process of understanding and exploring data. πŸ“Š

https://public.tableau.com/app/profile/akshata.upadhye/viz/CO2Emissions_16303731687290/Dashboard1