![]()
Independent effort of providing up-to-the-minute time-series reports in JSON and CSV format for analytical purposes.
The data are automatically scheduled to refresh every hour at the 11th minute as specified in the Action workflow of this repo including the below chart, however if there is no update from the data sources then the data on this repo will not change.
The data files are stored in the data folder categorised in tabular format (CSV) and JSON respectively.
| Folder | Filename | Description |
| 📁data/csv | 📄arcgis.natl.csv | ArcGIS version of national level time-series data |
| 📁data/json | 📜arcgis.natl.json | |
| 📁data/csv | 📄basic.csv | Basic version of national and state/provincial level time-series data |
| 📁data/json | 📜basic.minified.json | |
| 📁data/csv | 📄ext.natl.csv | BNPB version of national level time-series data |
| 📁data/json | 📜ext.natl.json | |
| 📁data/csv | 📄ext.prov.csv | BNPB version of state/provincial level time-series data |
| 📁data/json | 📜ext.prov.json | |
| 📁data/csv | 📄hospitals.csv | Local hospital contacts and addresses |
| 📁data/json | 📜hospitals.json | |
| *BNPB (Badan Nasional Penanggulangan Bencana) is the Indonesian government/national institution for disaster recovery | ||
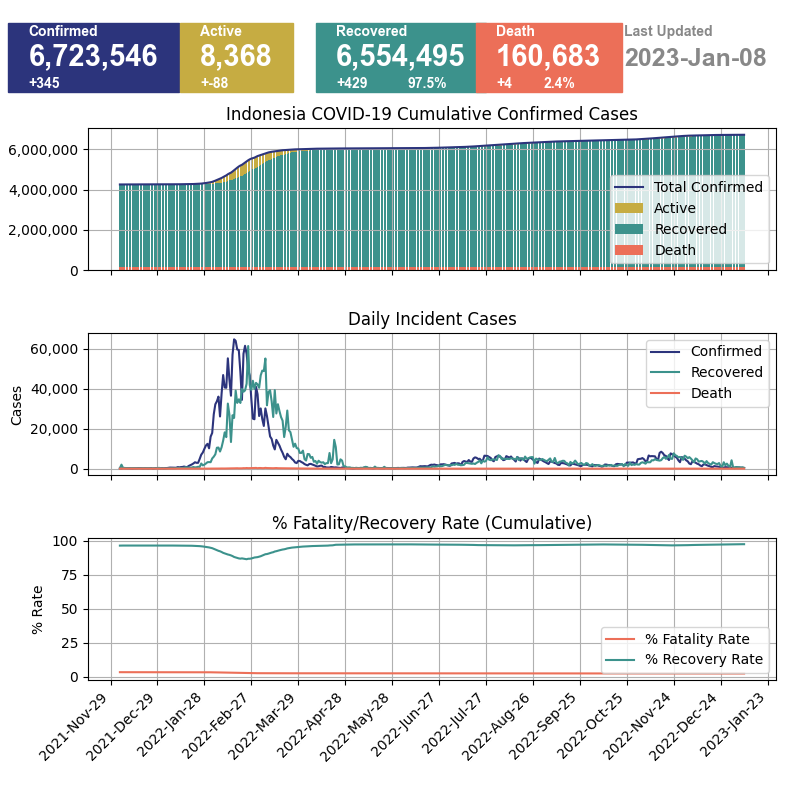
These charts are plotted regularly based on the scraped data. You can find some .py files to generate the charts in the 📁ActionRunner folder.
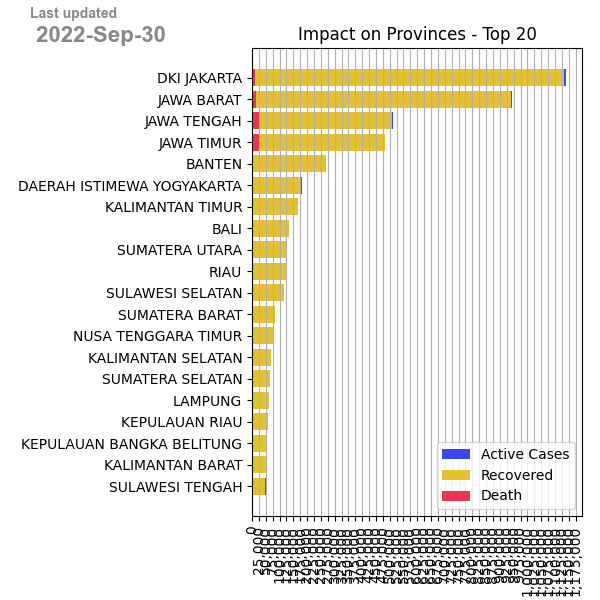
Script: CreatePlot-Provinces.py
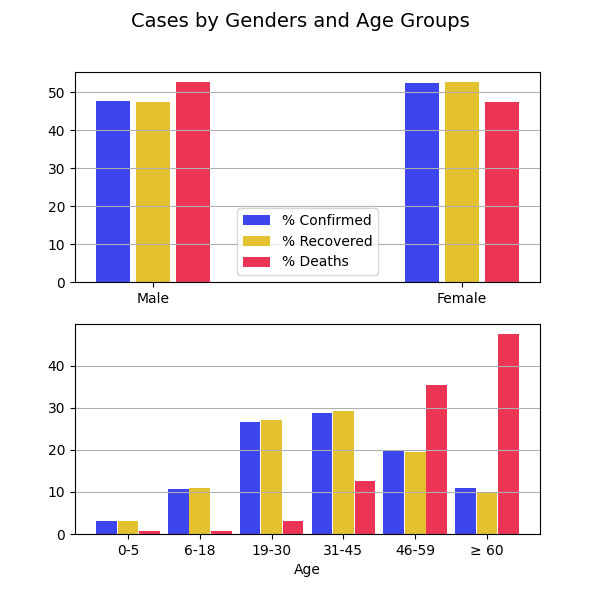
Script: CreatePlot-Age.py
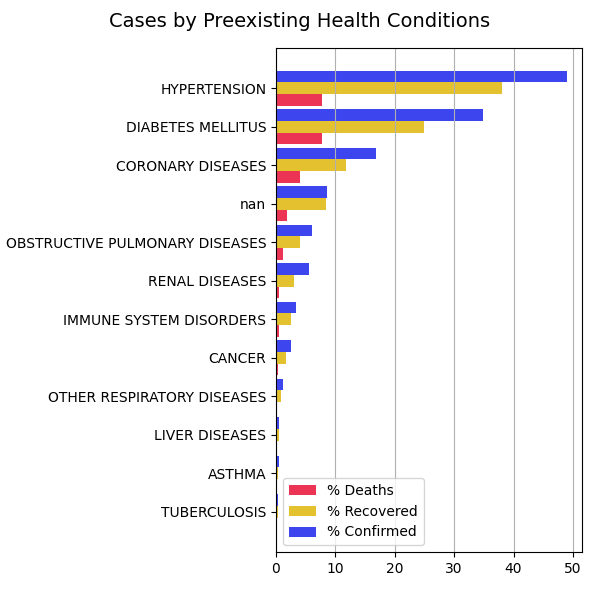
Script: CreatePlot-Comorbid.py
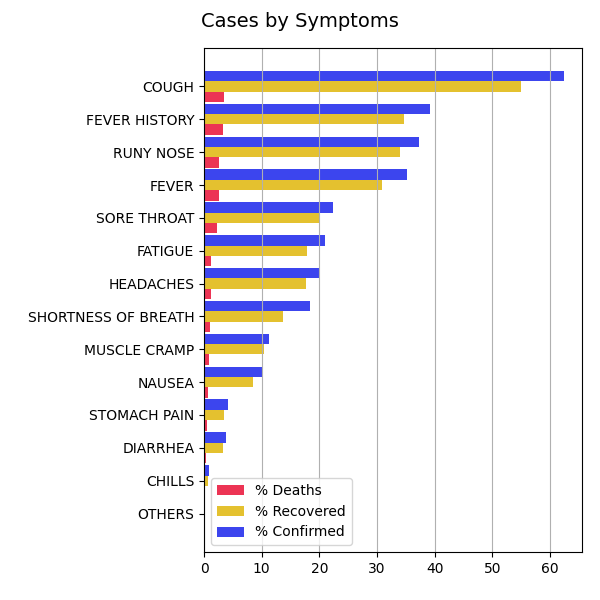
Script: CreatePlot-Symptoms.py
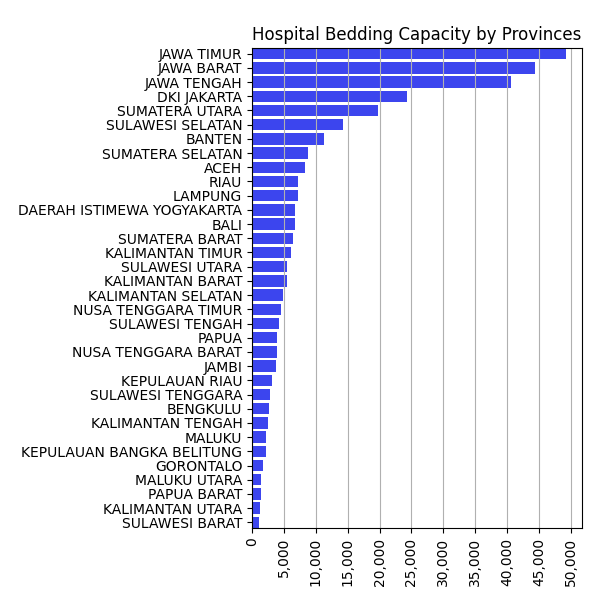
Script: CreatePlot-Hospitals.py
The scripts to gather the data are all in the 📁ActionRunner folder, written mostly in C# designed to run on the latest version .NET Core. Some files however are in .py python format to plot the chart.
All the data scraping processes are located in the 📁.github/workflows folder automated by this repo Actions.
The data sources are from the Official Government Site and the ArcGIS Covid dashboard of Indonesia.
Just open an issue here. All contributions and inputs are welcome.