chaos @ scale
- 1.0 Introduction
- 1.1 Tech Stack
- 2.0 Data Pipeline
- 2.1 Overview - Scale
- 3.0 DevOps Pipeline
- 3.1 Containerize Data Pipeline
- 3.2 Deployment Architecture and Flow
- 3.3 Monitoring
- 3.4 Chaos Testing
- 3.5 Pipeline Limitations
- 4.0 Engineering Challenges
- 4.1 Deployment of Kubernetes cluster
- 4.2 Deployment of Spark on Kubernetes cluster
- 4.3 Deployment of Postgres on Kubernetes cluster
- 5.0 Future Work
- 5.1 Remove Tiller dependency from Helm
- 6.0 Development
- 6.1 Build and Deploy Data Pipeline
- 7.0 Miscellaneous
Having a resilient data pipeline for your business is becoming a necessity to stay competitive in times where vast amounts of data are generated and consumed. Containers allow you to focus on a single area of concern, whether it is application data capture, storage, analysis, or visualization. Container orchestrators like Kubernetes can help deploy, manage, and scale containerized components of modern cloud native data pipelines. So how do we test for resiliency?
My project focuses on taking a data pipeline, Scale, containerizing each component of the pipeline, utilizing container orchestration to create a highly resilient pipeline, and testing for resiliency by running a set of chaos experiments.
| Technology | Use Case |
|---|---|
| Terraform | automate infrastructure |
| AWS EKS | Kubernetess cluster deployment |
| Helm | Kubernetes configs in the form of charts |
| Prometheus / Grafana | monitoring setup through Kubernetes Operator |
| Kube Monkey | chaos testing tool to terminate pods |
| Spark | data extraction for pipeline |
| Postgres | data storage for pipeline |
| Flask | data visualization for pipeline |
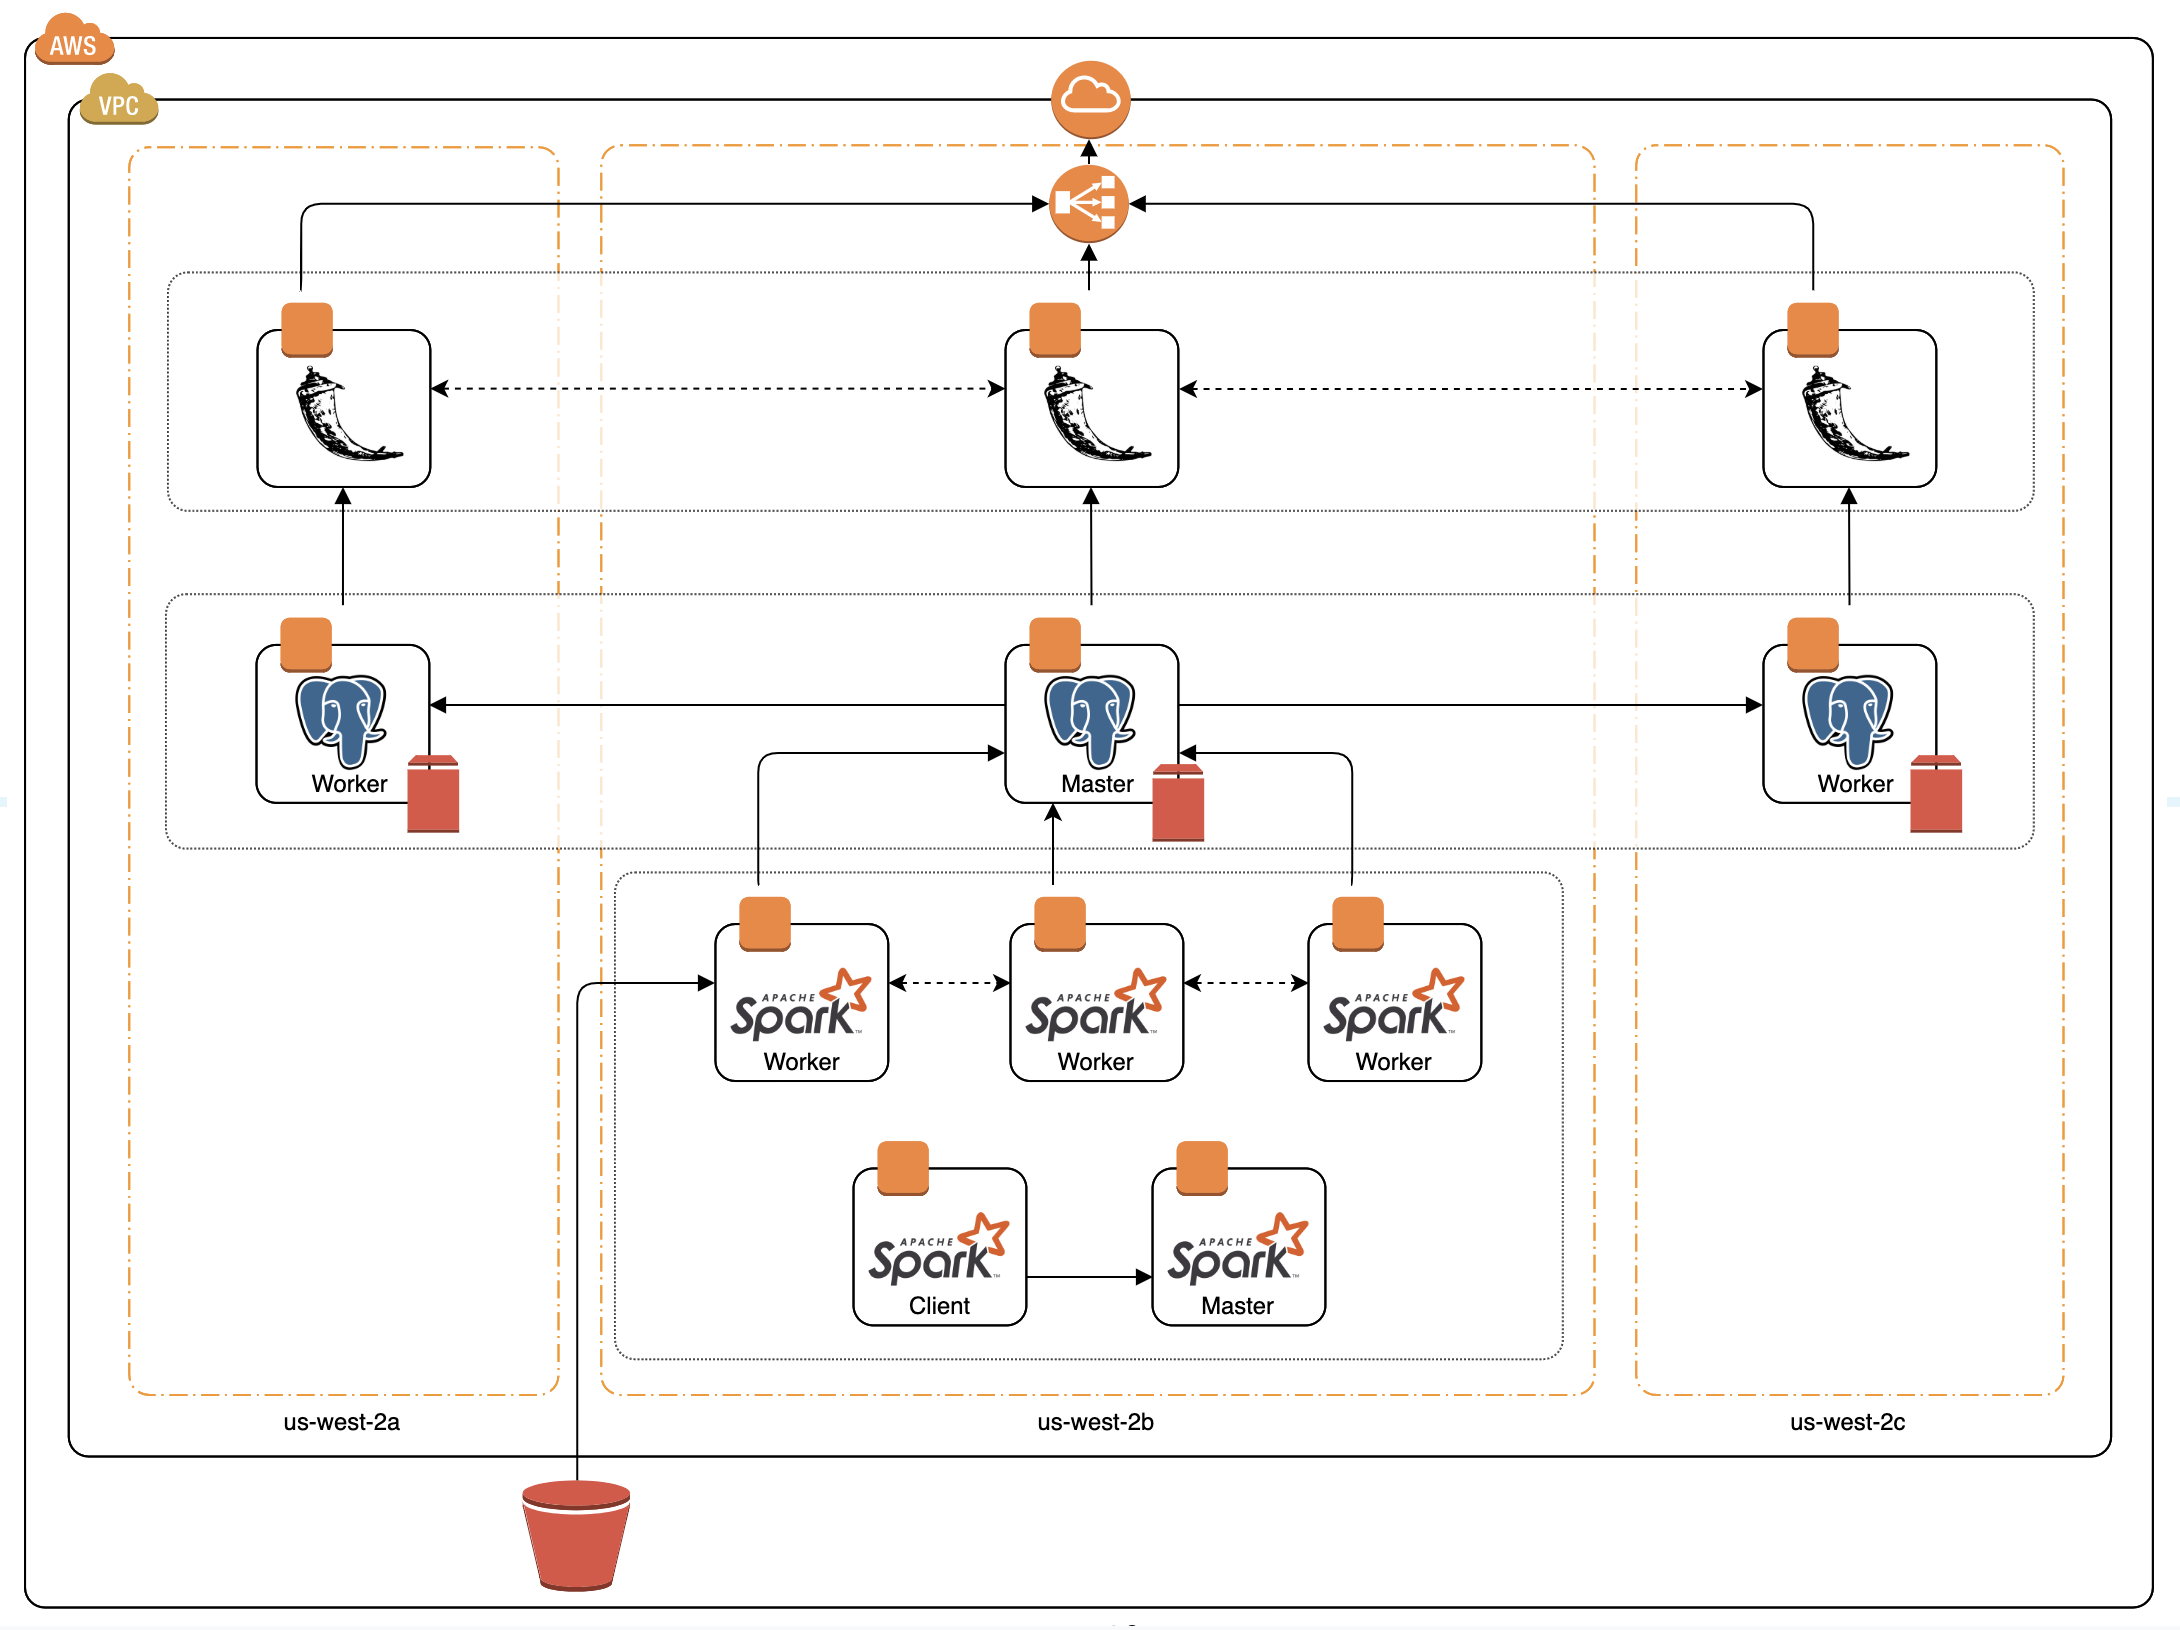
The existing batch data pipeline is called Scale. It is a music recommendation engine that finds similar songs based on shared instruments. The original application can be found here. The data pipeline is shown below:
- S3: storage of midi files
- Spark: extract data about instruments from midi files
- Postgres: store results
- Flask: view results
The Flask, Postgres, and Spark components of the data pipeline have all been containerized. You can find the containers used for my deployment on Docker Hub or you can build your own containers by following the instructions in the development section.
| Container | Description |
|---|---|
ajgrande924/scale-app |
scale flask application |
ajgrande924/spark-base |
custom spark base image |
ajgrande924/spark-master |
spark master built from spark base |
ajgrande924/spark-worker |
spark worker built from spark base |
ajgrande924/spark-client |
spark client built from spark base |
The data pipeline flow is as follows:
- The Lakh MIDI data set is loaded into an S3 bucket using the aws cli
- The Spark Client submits a job to the spark cluster.
- The Spark Master delegates to the Spark Workers where the MIDI files are taken from the S3 bucket and instrument information is extracted.
- Once instrument extraction is complete, the results are written by the Postgres Master.
- Data is replicated from the Postgres Master to the Postgres Slaves.
- The Flask app reads the data from the Postgres Cluster to enable the user to visualize the results.
In order to monitor the Kubernetes cluster and the components within it, I decided to use the Kubernetes Operator for Prometheus through Helm. The Prometheus Operator includes:
- prometheus-operator
- prometheus
- alertmanager
- node-exporter
- kube-state-metrics
- grafana
Steady State Testing
In order to start testing, I need to figure out what is the steady state of the application. The tool I will use to simulate steady state is the loadtest command line tool. I will hit the application with a command like this:
# time(s) = 300, concurrency = 500 users, rps = 500
loadtest -t 300 -c 500 --rps 500 http://scale.practicedevops.xyz/test_db
http://scale.practicedevops.xyz (home route only hits flask application)
| Time (t) | Concurrency (c) | Requests Per Second (rps) | Mean Latency | % Error |
|---|---|---|---|---|
| 60 s | 500 | 500 | 114 ms | 0% (0/16824) |
| 60 s | 1000 | 1000 | 1151.8 ms | 51% (18014/35374) |
| 60 s | 750 | 750 | 179.3 ms | 42% (12379/29496) |
http://scale.practicedevops.xyz/test_db (test_db route hits both flask application and postgres database)
| Time (t) | Concurrency (c) | Requests Per Second (rps) | Mean Latency | % Error |
|---|---|---|---|---|
| 60 s | 100 | 100 | 106.7 ms | 0% (0/5991) |
| 60 s | 500 | 500 | 3555.8 ms | 9.6% (1617/16855) |
| 60 s | 150 | 150 | 101.5 ms | 0% (0/8986) |
| 60 s | 200 | 200 | 106.1 ms | 0% (0/11973) |
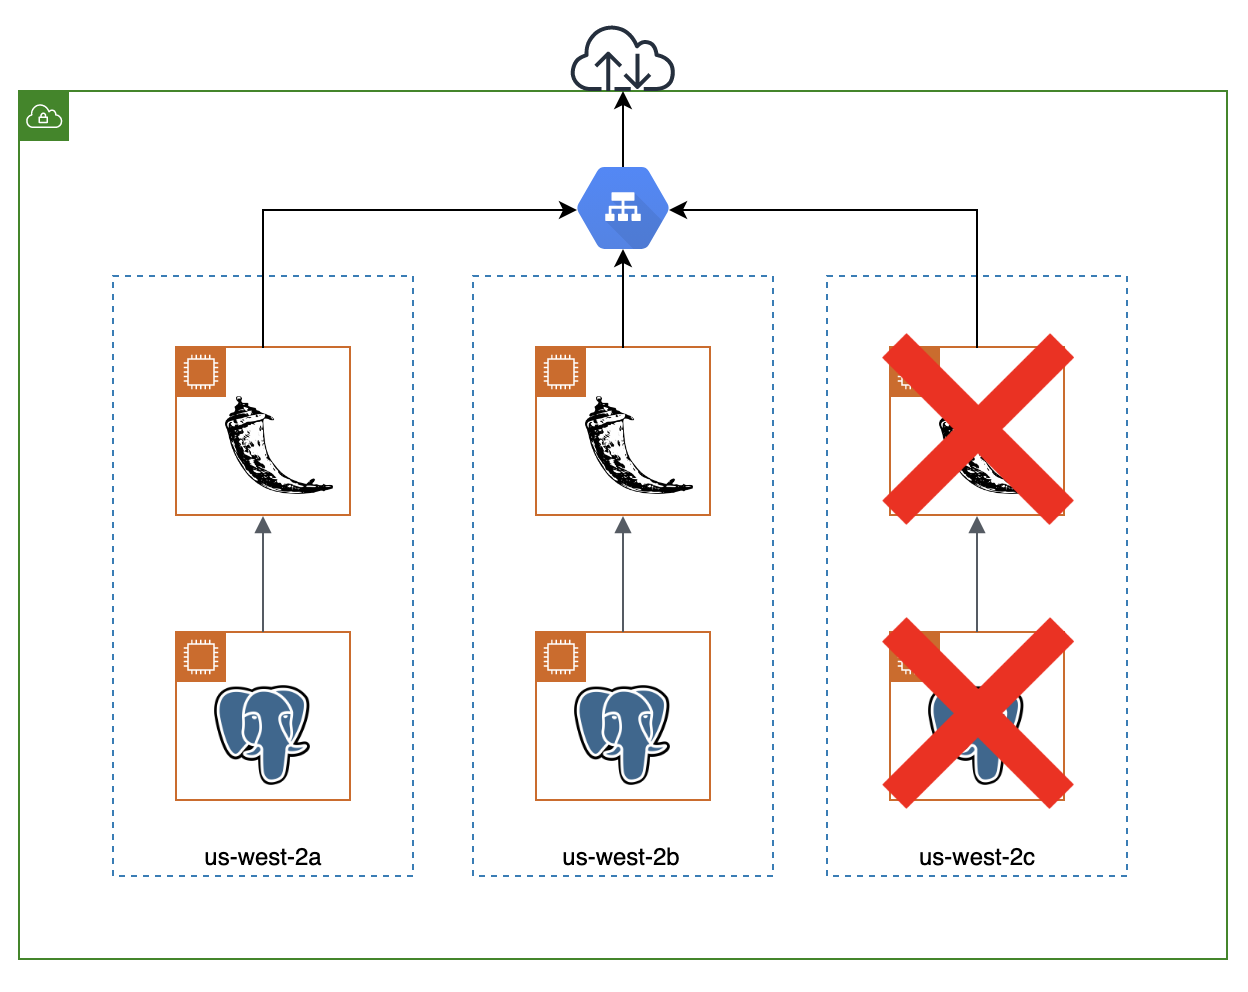
Experiment #1: Terminate Pods in Availability Zone
The first experiment I will run is to terminate pods in an availability zone, specifically the flask and postgres pods under steady state conditions. The steady state condition for this application is to handle x concurrent users and I will simulate this on the /test_db route of the application. This route will not only test the load of the flask application but also the load of the postgres database by performing 2 queries per request.
My hypothesis for this experiment is that the system deployed will:
- reroute traffic away from the terminated pods in the availability zone after termination
- increased latency per request right after termination
- pods will self heal after x amount of time
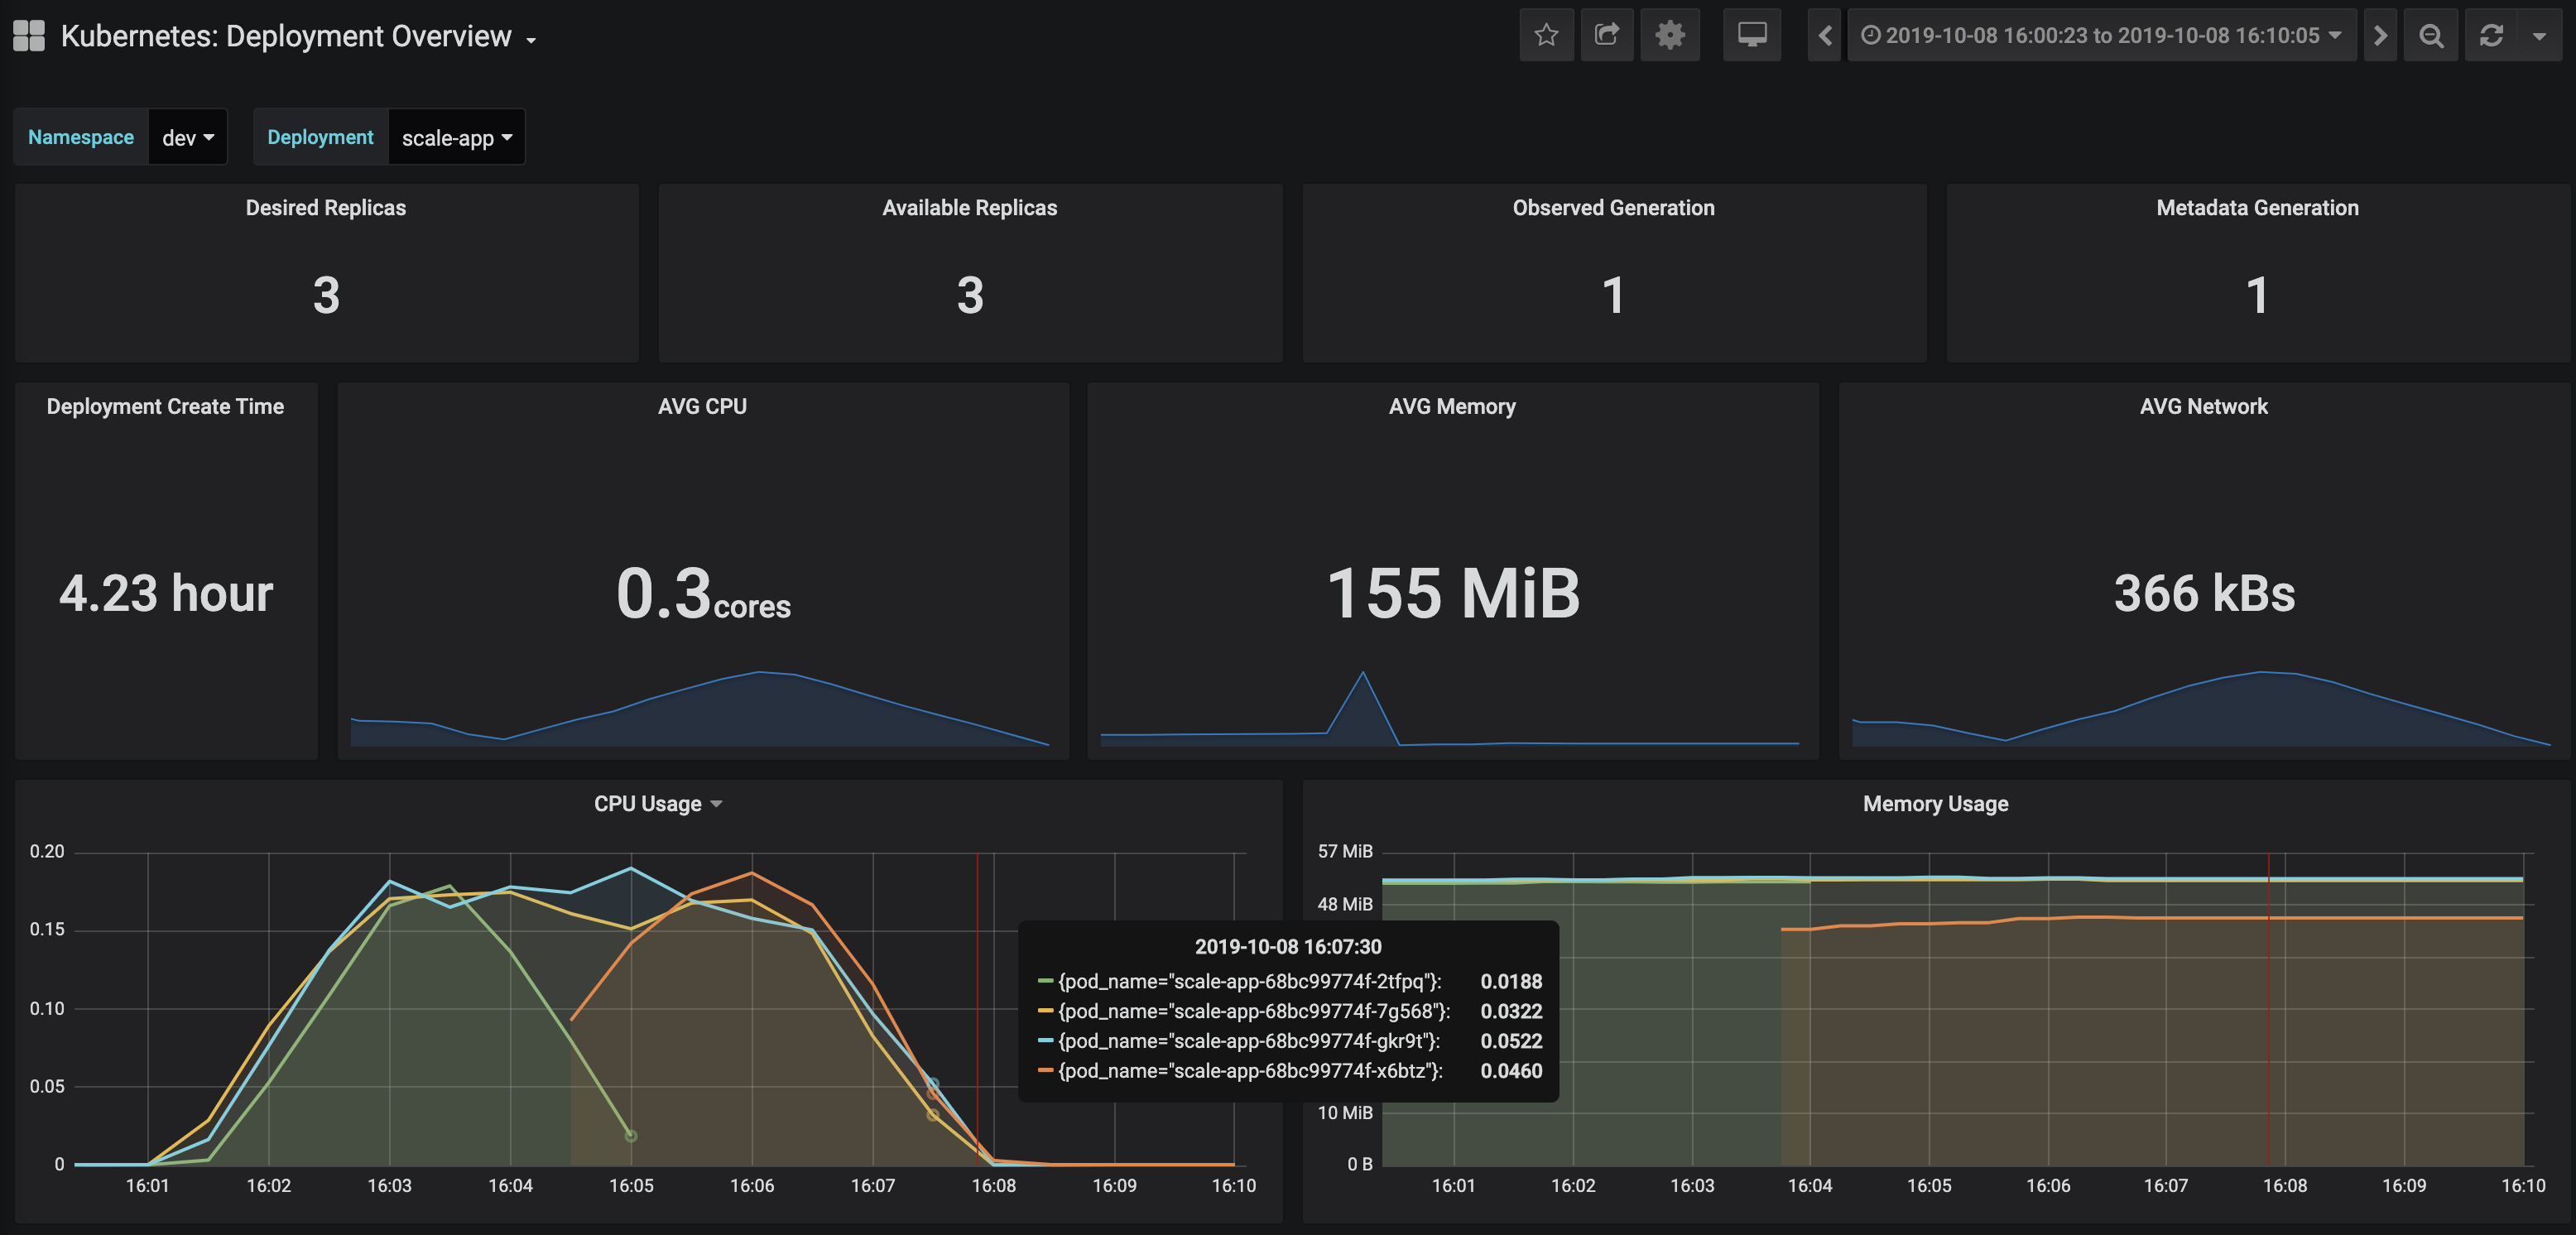
I ran @ steady state (c=100, rps=100) and terminated an instance of the flask and postgres pods in the same availability zone @ about 16:02. In the first screenshot, you can see metrics for the flask application deployment, specifically CPU percentage. Notice that when the flask pod was terminated, another pod/replica was created almost instantaneously.
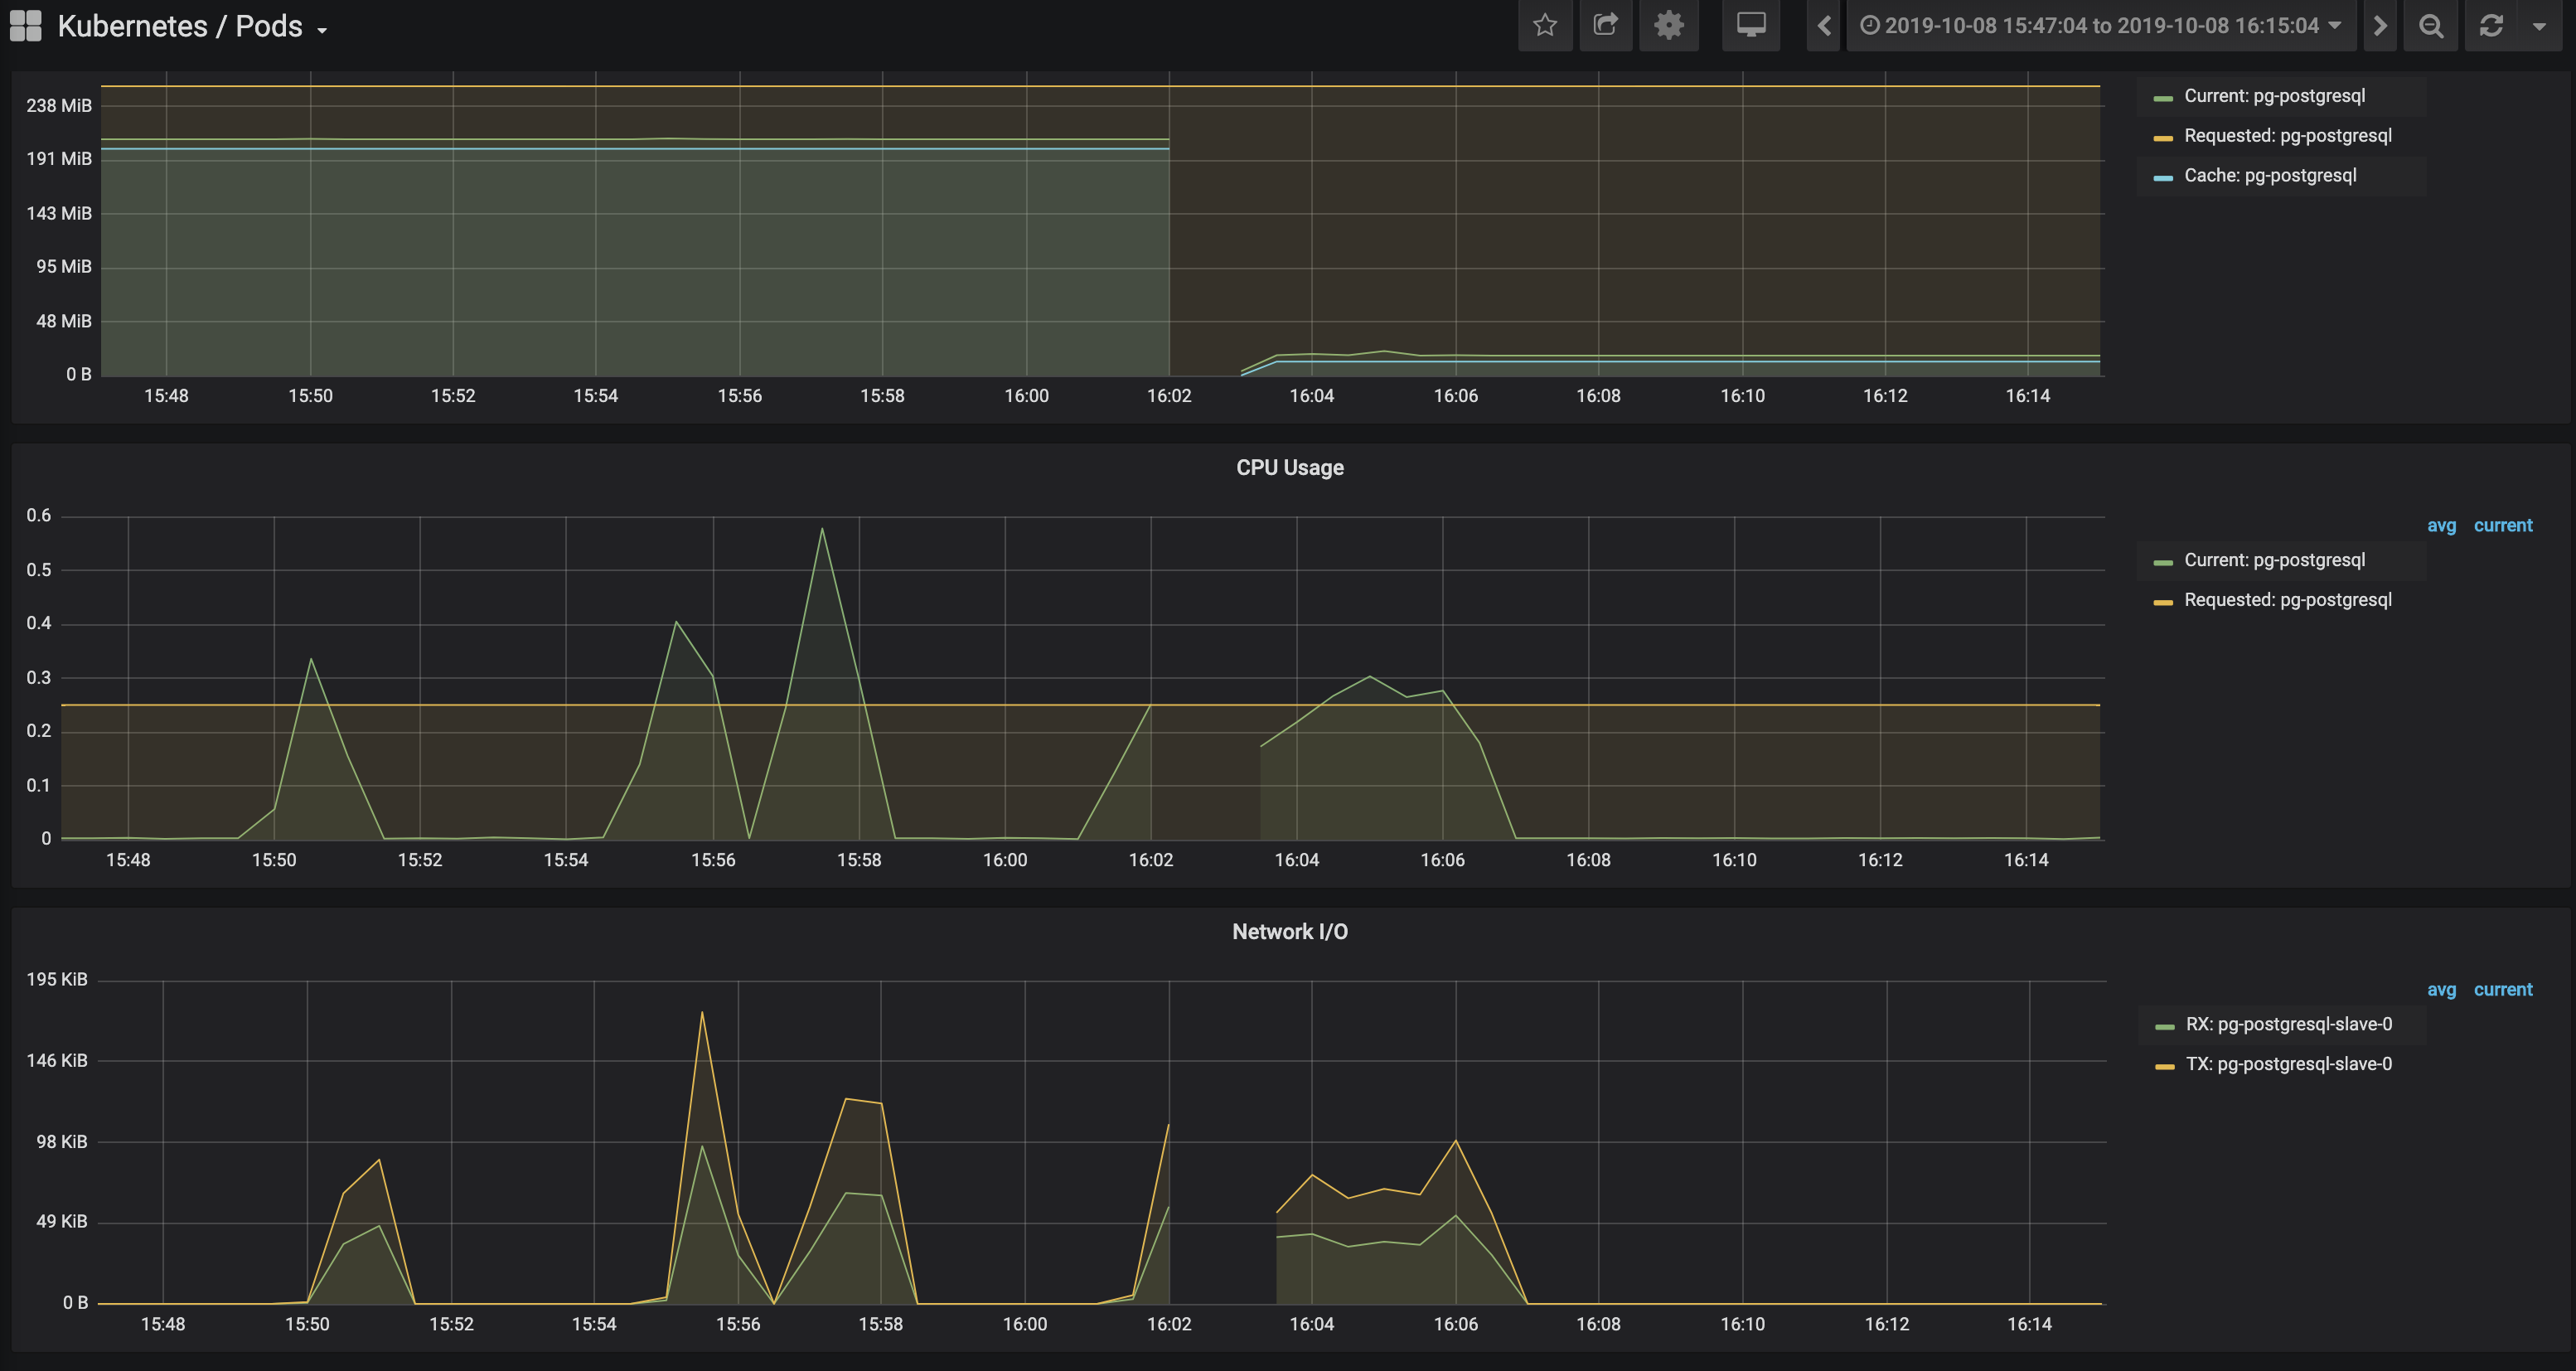
In the second screenshot, you can see the metrics for the postgres slave pod. Notice that the postgres slave pod was unreachable before it self healed after 90 seconds.
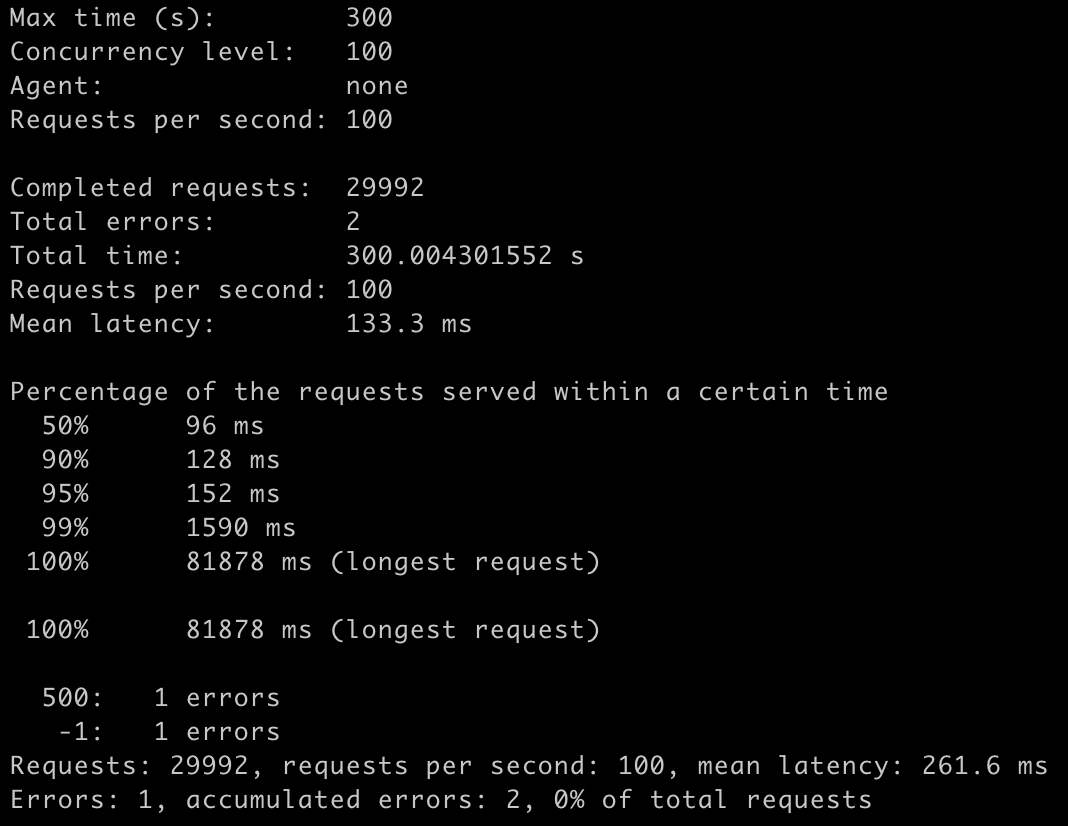
But how did this affect the incoming requests send to the application during this period of time? The sceenshot below shows the results of the load test during pod termination. There were only 2 errors during this time period resulting in a <0.01% error rate.
Base off of thes results, I would try to:
- minimize the time it takes for the postgres slave pod to self heal
- increase the amount of concurrent users the application can handle
To increase the amount of concurrent users I can add a Horizontal Pod Autoscaler (HPA) to both my flask deployment and Postgres StatefulSet. The kubectl commands would look something like this:
# flask deployment
kubectl autoscale deployment scale-app --cpu-percent=50 --min=3 --max=9
The yaml to autoscale the Postgres StatefulSet would look something like this:
# postgres statefulset
apiVersion: autoscaling/v1
kind: HorizontalPodAutoscaler
metadata:
  name: YOUR_HPA_NAME
spec:
  maxReplicas: 9
  minReplicas: 3
  scaleTargetRef:
    apiVersion: apps/v1
    kind: StatefulSet
    name: YOUR_STATEFUL_SET_NAME
  targetCPUUtilizationPercentage: 80
To protect application from disruptions, a PodDisruptionBudget (PDB) can also be implemented, defining minAvailable and/or maxUnavailable:
apiVersion: policy/v1beta1
kind: PodDisruptionBudget
metadata:
  name: sa-pdb
spec:
  minAvailable: 2
  selector:
    matchLabels:
app: scale-appapiVersion: policy/v1beta1
kind: PodDisruptionBudget
metadata:
name: sa-pdb
spec:
maxUnavailable: 1
selector:
matchLabels:
app: scale-appPostgres SQL queries from Flask
One of the limitations I noticed when I tried th deploy the data pipeline was that there was a limitation on the flask application to perform the necessary queries for the instrument dropdown. The query for the flask app route, /get_songs_for_instruments, does not work for the full set of 0 hash midi files:
SELECT fi.filename, hn.song_name,\
  COUNT(DISTINCT fi.instrument) num_of_instruments,\
  COUNT(fs.distance) / COUNT(DISTINCT fi.instrument) AS num_of_simSongs\
  FROM (SELECT filename FROM filename_instrument_run3 WHERE instrument = '0' ) tbl\
  JOIN hash_name hn ON hn.hash = tbl.filename\
  JOIN filename_instrument_run3 fi ON fi.filename = tbl.filename\
  JOIN filepair_similarity_run3 fs ON (fs."filename_A" = tbl.filename OR fs."filename_B" = tbl.filename )\
  GROUP BY fi.filename, hn.song_name;
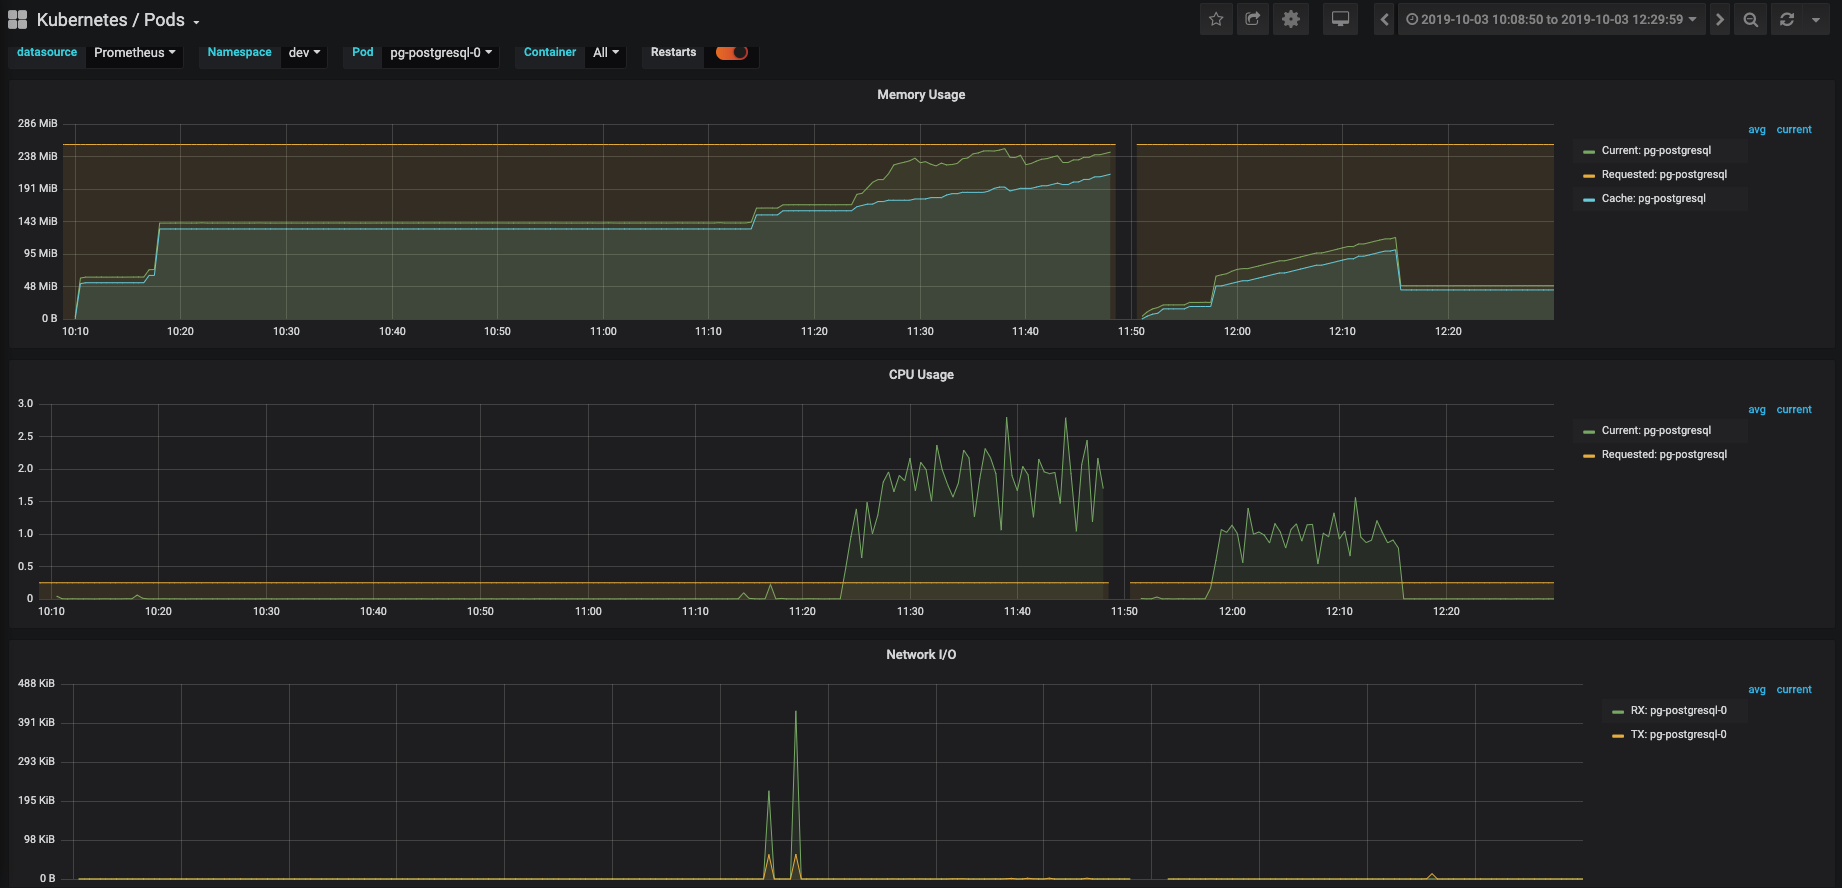
Clicking multiple options in the instrument drop down caused the postgres database to increase in cpu as show below:
The information of the run is listed below:
- 395MB
- 11,133 files
midi_instrument: 128 entrieshash_name: 178,561 entriesfilename_instrument: 69,262 entriesfilepair_similarity: 51,878 entries
When a subset of the 0 hash midi files was processed, the flask app was able to work fine. You can see the information below:
- 1,000 files
midi_instrument: 128 entrieshash_name: 178,561 entriesfilename_instrument: 6,205 entriesfilepair_similarity: 447 entries
I went through a few iterations when deploying my Kubernetes cluster to the cloud. I tried using both KOPS and AWS EKS. I decided to choose AWS EKS for a few reasons. The current data pipeline was also deployed on AWS with EC2 instances and the storage in which we will pull the data is also in AWS S3 which provides a much easier migration. AWS EKS is extremely simple to set up especially in conjunction with Terraform. There is actually a great module on the Terraform registry which allows you to use the base setup and spin up a cluster in 10 minutes. For time's sake, when you compare with KOPS, you do not have to provision anything in your control plane, you are only specifying your worker nodes. Also, one current downside to KOPS is that the terraform files generated for your cluster do not support terraform>=0.12. Since my terraform files are using the most up to date version of terraform, I did not want switch between versions to manage my infrastucture.
Spark is an open source, scalable, massively parallel, in-memory execution engine for analytics applications. It includes prebuilt machine learning algorithms which the scale application utilizes. Why should we use the Kubernetes cluster manager as opposed to the Standalone Scheduler?
- Are you using data analytical pipeline which is containerized? Are different pieces of your application containerized utilizing modern application patterns? It may make sense to use Kubernetes to manage your entire pipeline.
- Resource sharing is better optimized b/c instead of running your pipeline on a dedicated hardware for each component, it is more efficient and optimal to run on a Kubernetes cluster so you can share resources between components.
- Utilizing the kubernetes ecosystem (multitenancy)
- Limitations to the standalone scheduler still allow you to utilized Kubernetes features such as resource management, a variety of persistent storage options, and logging integrations.
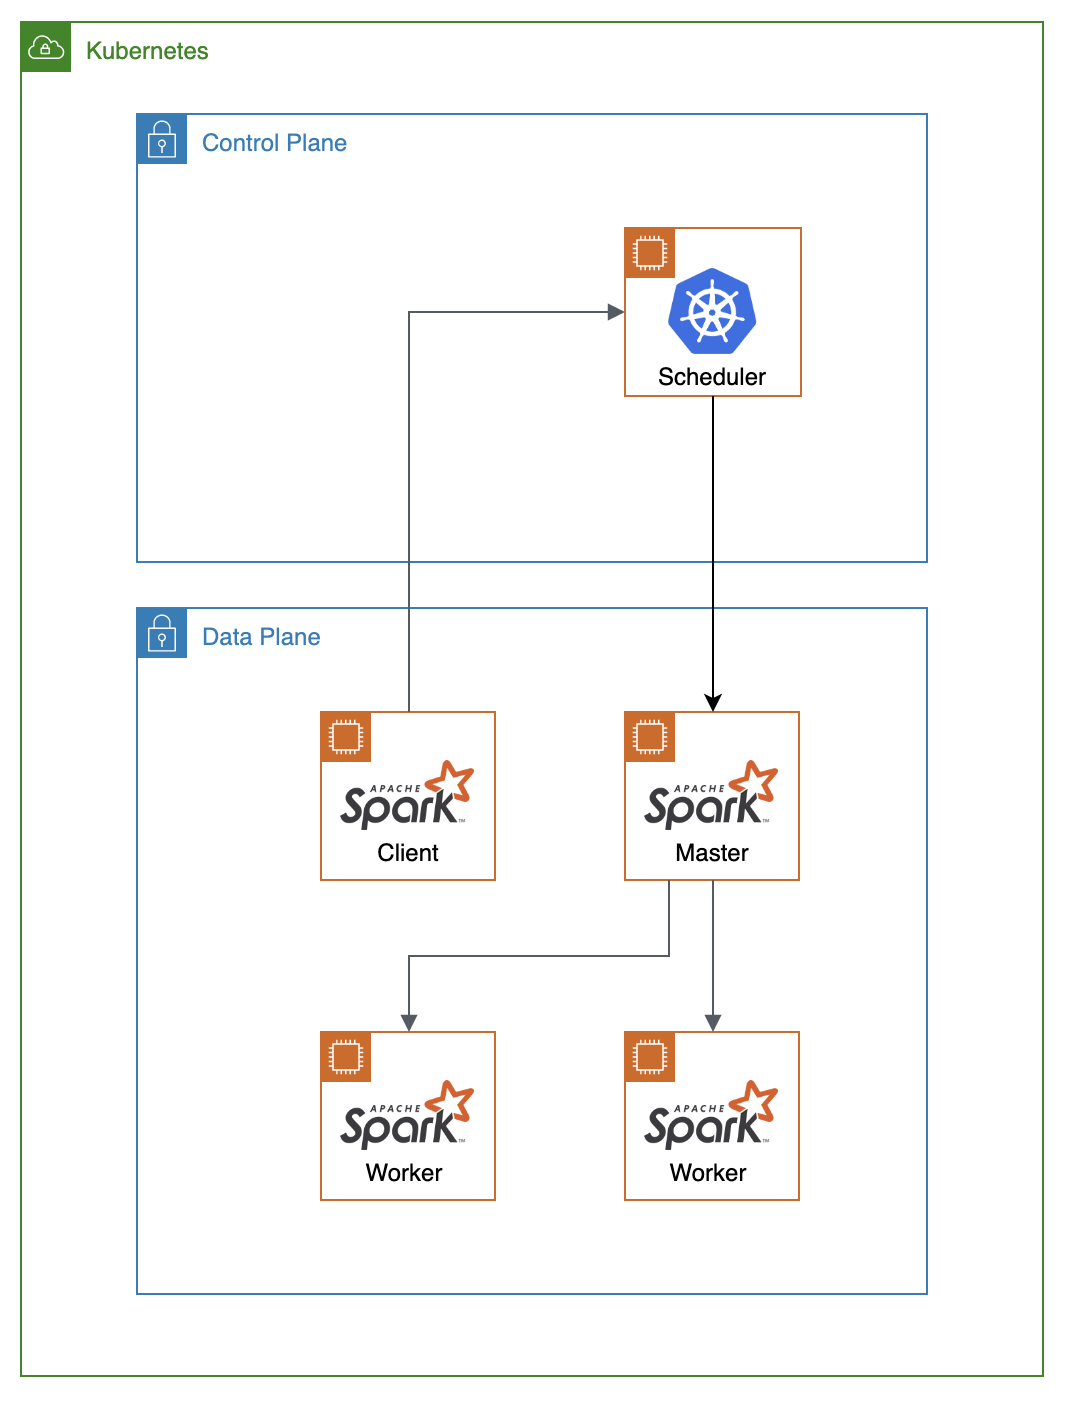
Currently as of spark=2.4.4, Kubernetes integration with Spark is still experimental. There are patches to the current version of Spark that can be added to make communication with the spark client and the kubernetes api server to work properly. Kubernetes scheduler will dynamically create pods for the spark cluster once the client submits the job. Communication with the spark cluster directly from the spark client is similar to the standalone scheduler but with utilization of some Kubernetes features such as resource management. It requires that the spark cluster is already up and running before you send the job.
Another challenge that I encountered was deploying Postgres on Kubernetes. During the initial testing phase, I created my own Kubernetes configurations for the StatefulSet but realized that I was missing a few things:
- once my Spark job completed, the data was sent to a Postgres pod but was not replicated to the other pods in the StatefulSet
- the data did not persist when I restarted the Postgres cluster
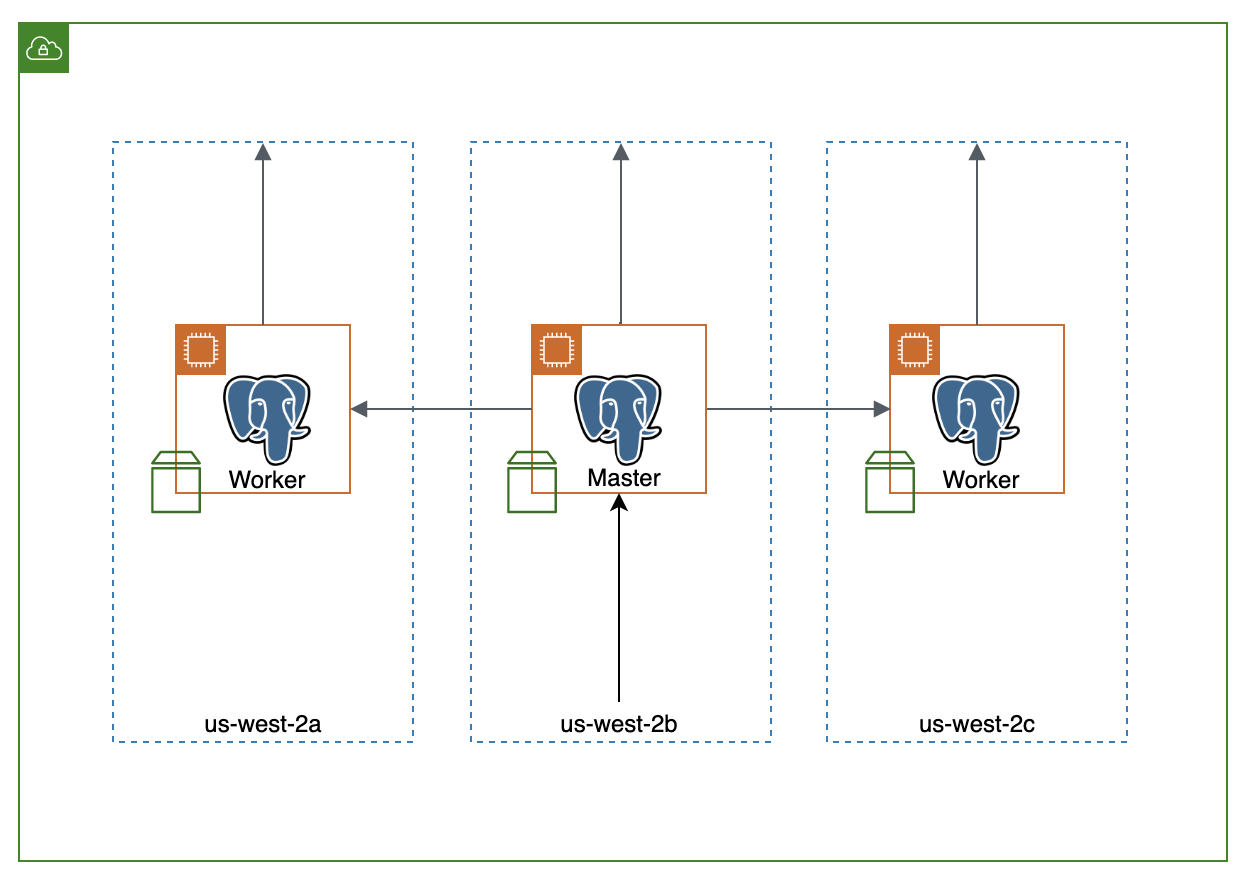
I ended up using the stable/postgresql Helm chart which deployed the StatefulSet with master/slave replication. The default configurations on Helm Github had a bug that caused write requests to hang, so I used a workaround to get it working, which was identified in the bug report. There is a single master replica in the same availability zone as the spark cluster and worker replicas on each availability zone. Each replica has a PVC, with an EBS volume attached to each pod.
As of this writing, Helm 3 is currently still in beta. The new release of Helm removes the dependency of the server side component, Tiller, which poses a potential security vulnerability. By default, Tiller runs with admin priviledges to do a manual port-forward to a pod. To remove the dependency from Tiller with Helm 2, there is the option of using helm client side templating by generating yaml templates using helm charts and executing with kubectl.
- move from AWS EKS to KOPS for more flexibility
- convert deployment of instances within Kubernetes cluster to terraform
- create one click deploy and destroy of entire infrastructure
- break up huge spark jobs into smaller ones to increase resiliency
- update Spark deployment to communicate with Kubernetes scheduler to submit jobs instead of communicating with Spark master directly
I've seperated each piece of my build, deployment, and destroy steps into seperate subcommands for debugging purposes.
To build and deploy the data pipeline, you will need the following dependencies:
jqawsclidockerkubetclhelm @ = 2.x.xaws-iam-authenticatorterraform @ >= 0.12
Before deploying the data pipeline, these are the steps to build / containerize the application:
| Step | Command | Description |
|---|---|---|
| 1 | ./run_kube create_scale_app |
containerize flask app |
| 2 | ./run_kube create_spark_base |
create spark base image |
| 3 | ./run_kube create_from_spark_base |
create spark master and worker images from base |
| 4 | ./run_kube push_to_docker_hub |
push images to docker hub |
| 5 | ./run_kube gen_pg_assets |
generate hash_names.csv w/ md5_to_paths.json as intermediate |
To deploy the data pipeline to a Kubernetes cluster, you can run the following steps:
| Step | Command | Description |
|---|---|---|
| 1 | ./run_kube setup_eks |
setup vpc + eks cluster |
| 2 | ./run_kube helm_init |
instantiate helm + tiller |
| 3 | ./run_kube setup_monitoring |
setup monitoring |
| 4 | ./run_kube setup_dashboards |
load custom grafana dashboards |
| 5 | ./run_kube setup_scale_app |
setup scale data pipeline |
| 6 | ./run_kube load_pg |
load postgres w/ tables and data |
| 7 | ./run_kube submit_spark_job |
submit spark job through spark client pod |
To destroy the data pipeline, you can run the following steps:
| Step | Command | Description |
|---|---|---|
| 1 | ./run_kube cleanup_scale_app |
cleanup scale data pipeline |
| 2 | ./run_kube cleanup_dashboards |
delete custom grafana dashboards |
| 3 | ./run_kube cleanup_monitoring |
cleanup monitoring |
| 4 | ./run_kube cleanup_tiller |
cleanup tiller |
| 5 | ./run_kube cleanup_eks |
destroy eks cluster + vpc |

