 Sentinel Dashboard
Overview
Welcome to sentinel-dashboard!
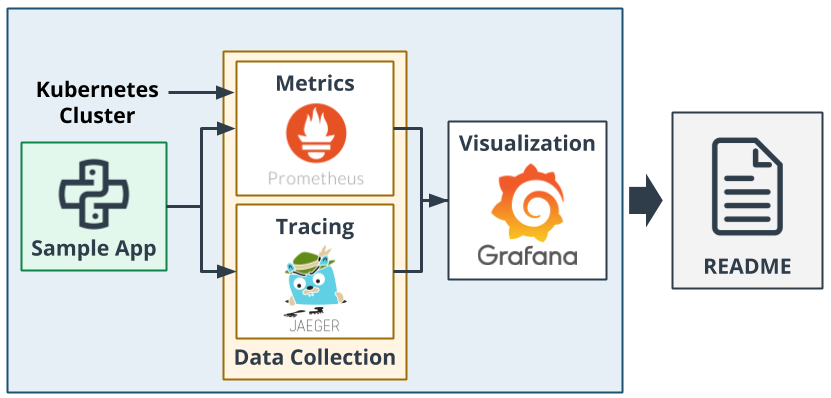
sentinel-dashboard is a simple metrics dashboard used to apply Observability course content from Udacity Cloud Native Applications Architecture Nano Degree program.
You are given a simple Python application written with Flask and you need to apply basic SLOs and SLIs to achieve observability by creating dashboards that use multiple graphs to monitor our sample application that is deployed on a Kubernetes cluster.
What is Observability?
Observability is described as the ability of a business to gain valuable insights about the internal state or condition of a system just by analyzing data from its external outputs. If a system is said to be highly observable then it means that businesses can promptly analyze the root cause of an identified performance issue, without any need for testing or coding.
In DevOps, observability is referred to the software tools and methodologies that help Dev and Ops teams to log, collect, correlate, and analyze massive amounts of performance data from a distributed application and glean real-time insights. This empowers teams to effectively monitor, revamp, and enhance the application to deliver a better customer experience.
Technologies
- Prometheus: Monitoring tool.
- Grafana: Visualization tool.
- Jaeger: Tracing tool.
- Flask: Python webserver.
- Vagrant: Virtual machines management tool.
- VirtualBox: Hypervisor allowing you to run multiple operating systems.
- K3s: Lightweight distribution of K8s to easily develop against a local cluster.
- Ingress NGINX: An application that runs in a cluster and configures an HTTP load balancer according to Ingress resources.
Getting Started
1. Prerequisites
We will be installing the tools that we'll need to use for getting our environment set up properly.
- Set up
kubectl - Install VirtualBox with at least version
6.0.x - Install Vagrant with at least version
2.0.x - Install OpenSSH
- Install sshpass
2. Environment Setup
To run the application, you will need a K8s cluster running locally and to interface with it via kubectl. We will be using Vagrant with VirtualBox to run K3s.
Initialize K3s
In this project's root directory, run:
vagrant upNote:
- Don't run this command until you read this section
- The environment setup can take up to
20 minutesdepending on your network bandwidth so be patient. Grab a coffee or something. If the installation fails runvagrant destroyand rerunvagrant upagain but there is a slim chance you might need to do this, this setup has been tested numerous of times. Remember good things come to those who wait patiently = )- You can run
vagrant suspendto conserve some of your system's resources andvagrant resumewhen you want to bring our resources back up. Some useful vagrant commands can be found in this cheatsheet.
The previous command will leverage VirtualBox to load an openSUSE OS and provision the following for you:
k3s v1.25.7+k3s1kubernetes cluster.ingress-nginxHelm chart installed iningress-nginxnamespace.jetstack/cert-manager v1.9.0Helm chart installed incert-managernamespace.prometheus-community/kube-prometheus-stackHelm chart installed inmonitoringnamespace.jaeger-operator v1.34.1installed inobservabilitynamespace.jaeger-all-in-oneinstance installed indefaultnamespace.- hotrod application to discover Jaeger capabilities and test around.
Additionally, the setup will out-of-the-box configure the following for you:
- Expose:
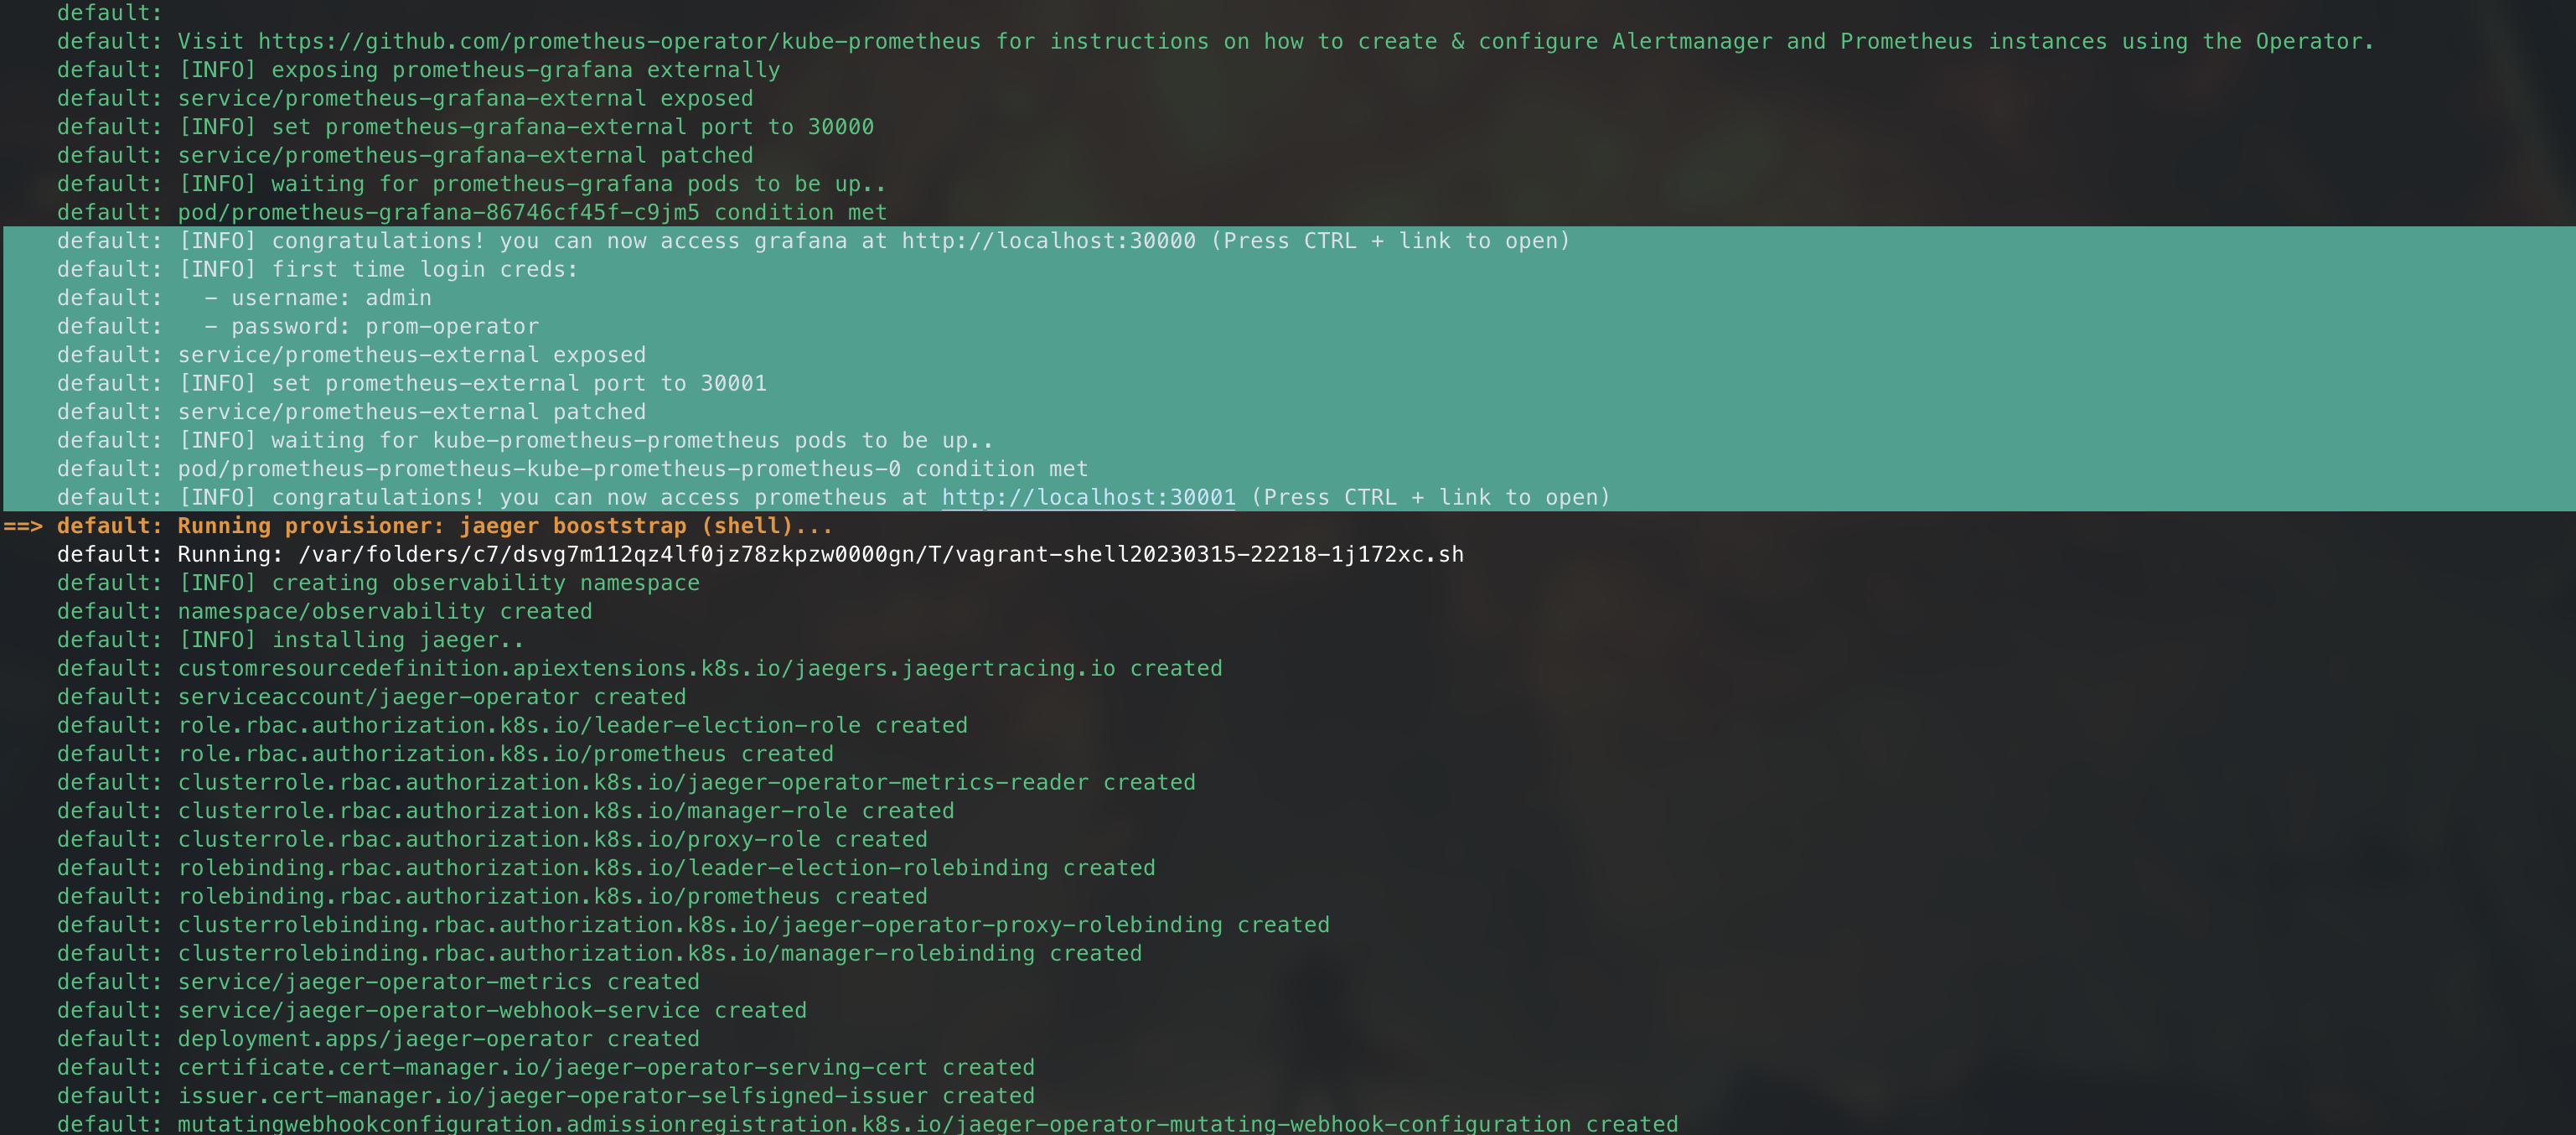
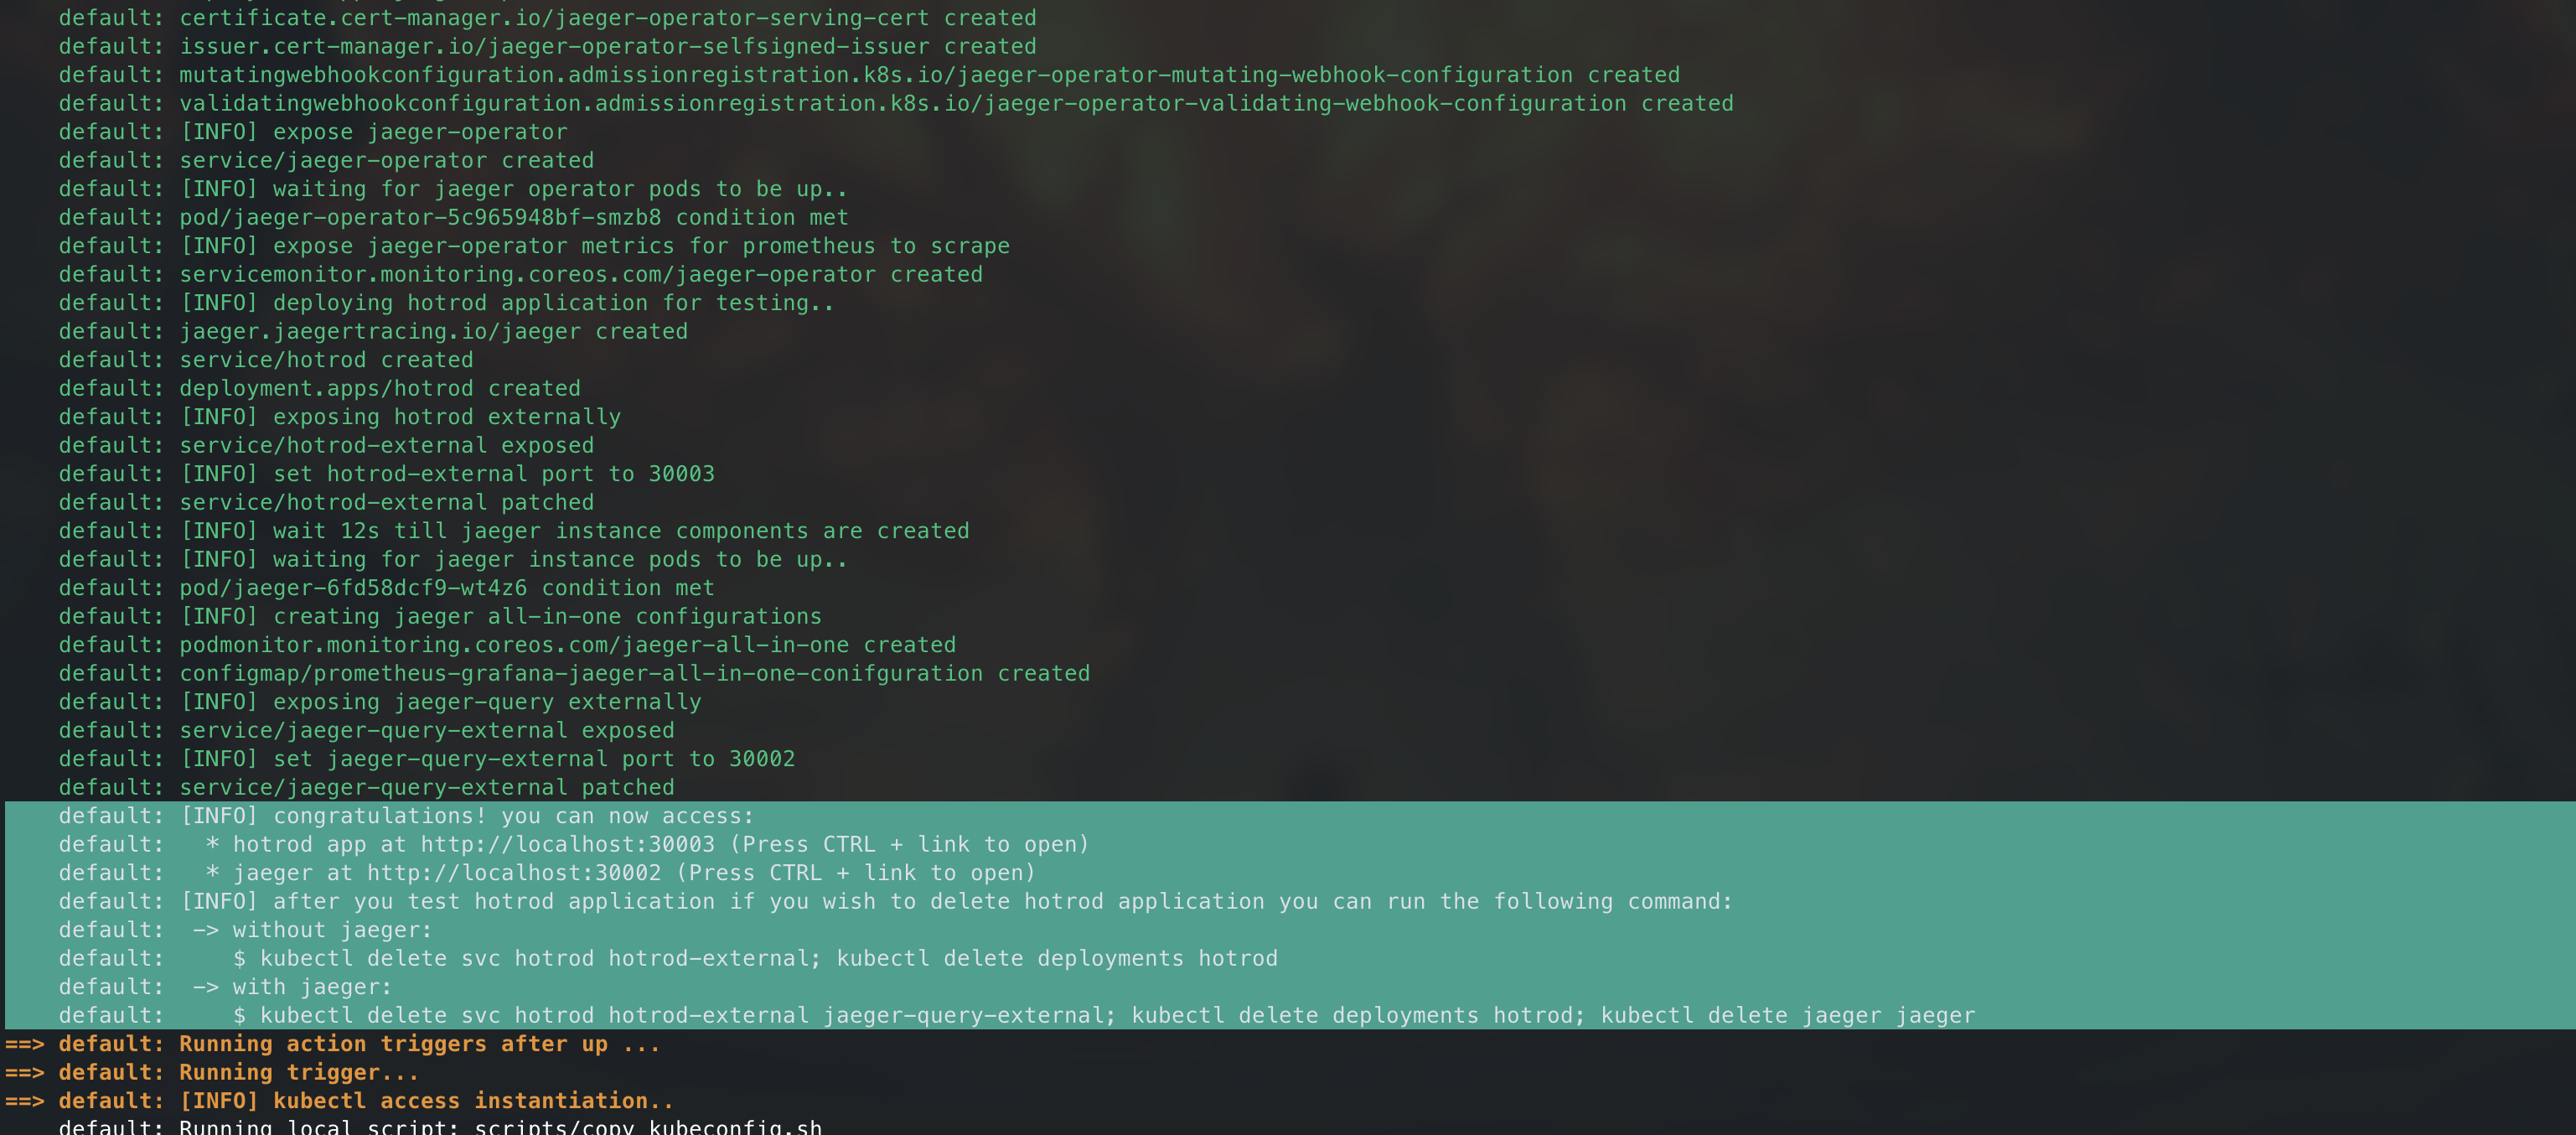
Grafana Serveron your local machine athttp://localhost:30000.Prometheus Serveron your local machine athttp://localhost:30001.Jaeger UIon your local machine athttp://localhost:30002.hotrod app UIon your local machine athttp://localhost:30003.
📝 Note: the installation will expose ports
30000 to 30010where you can easily expose any service you want usingNodePortservice and access it locally, you can conifgure the range you want from you Vagrantfile.
-
Automatically configure
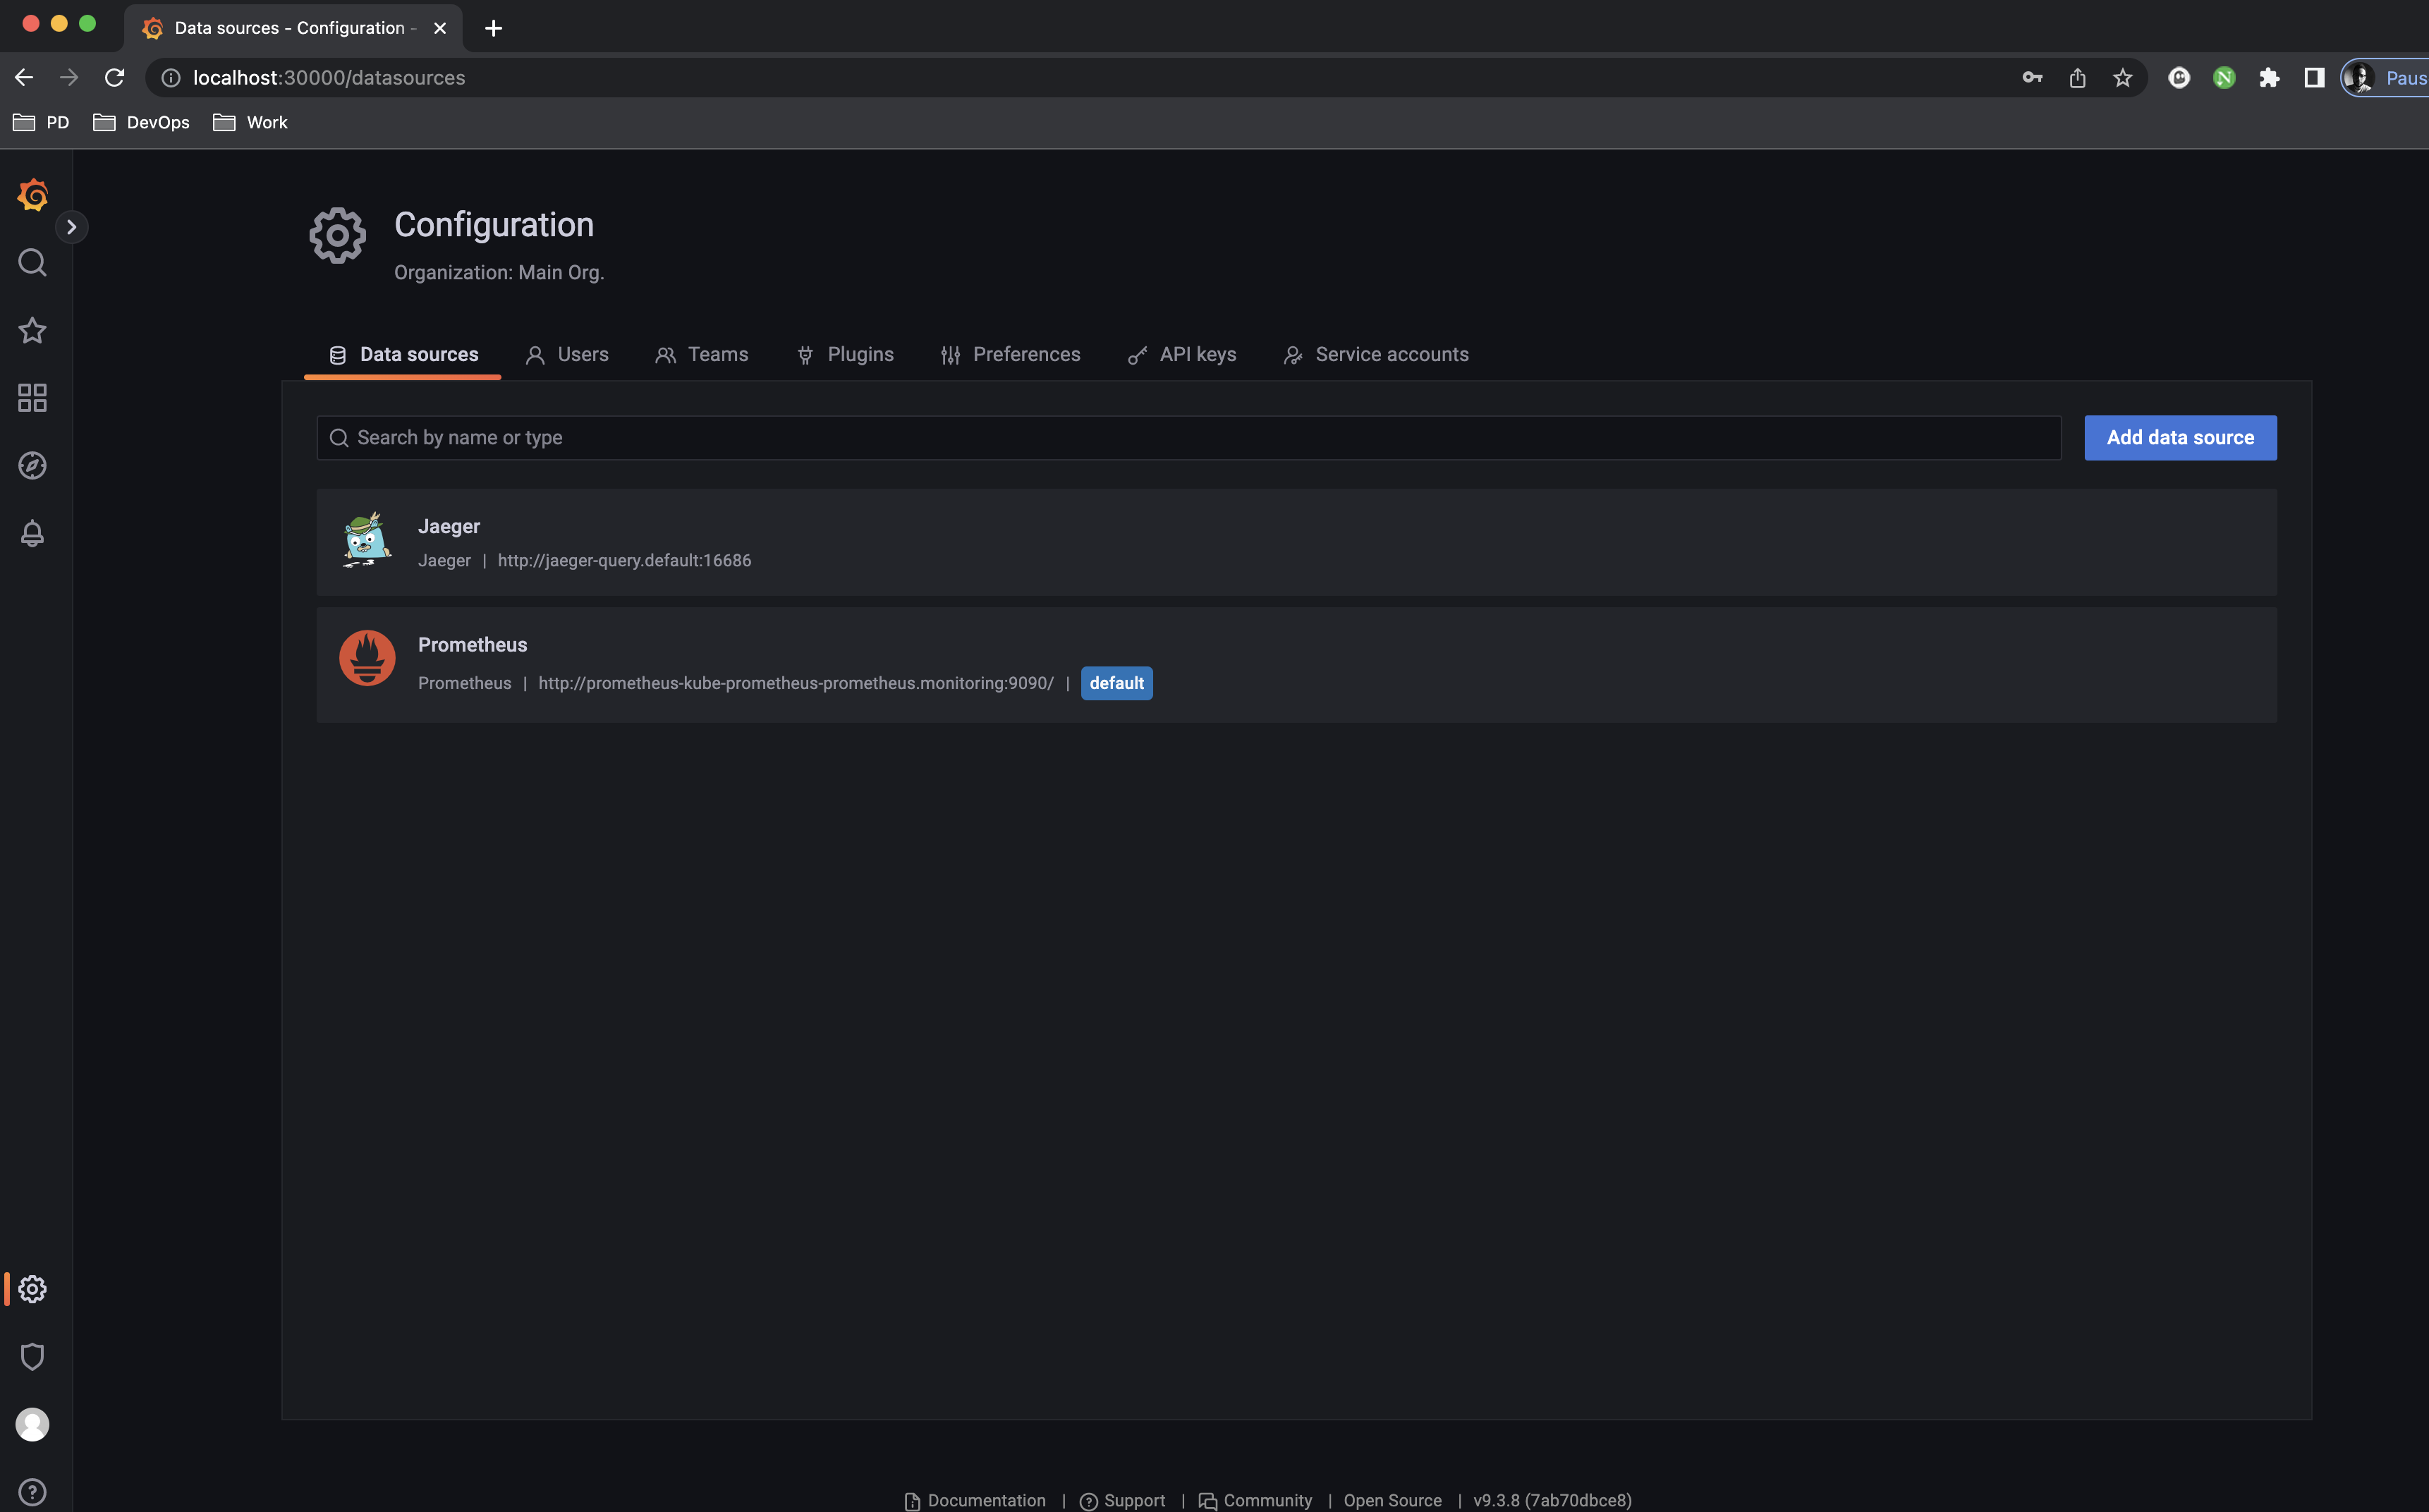
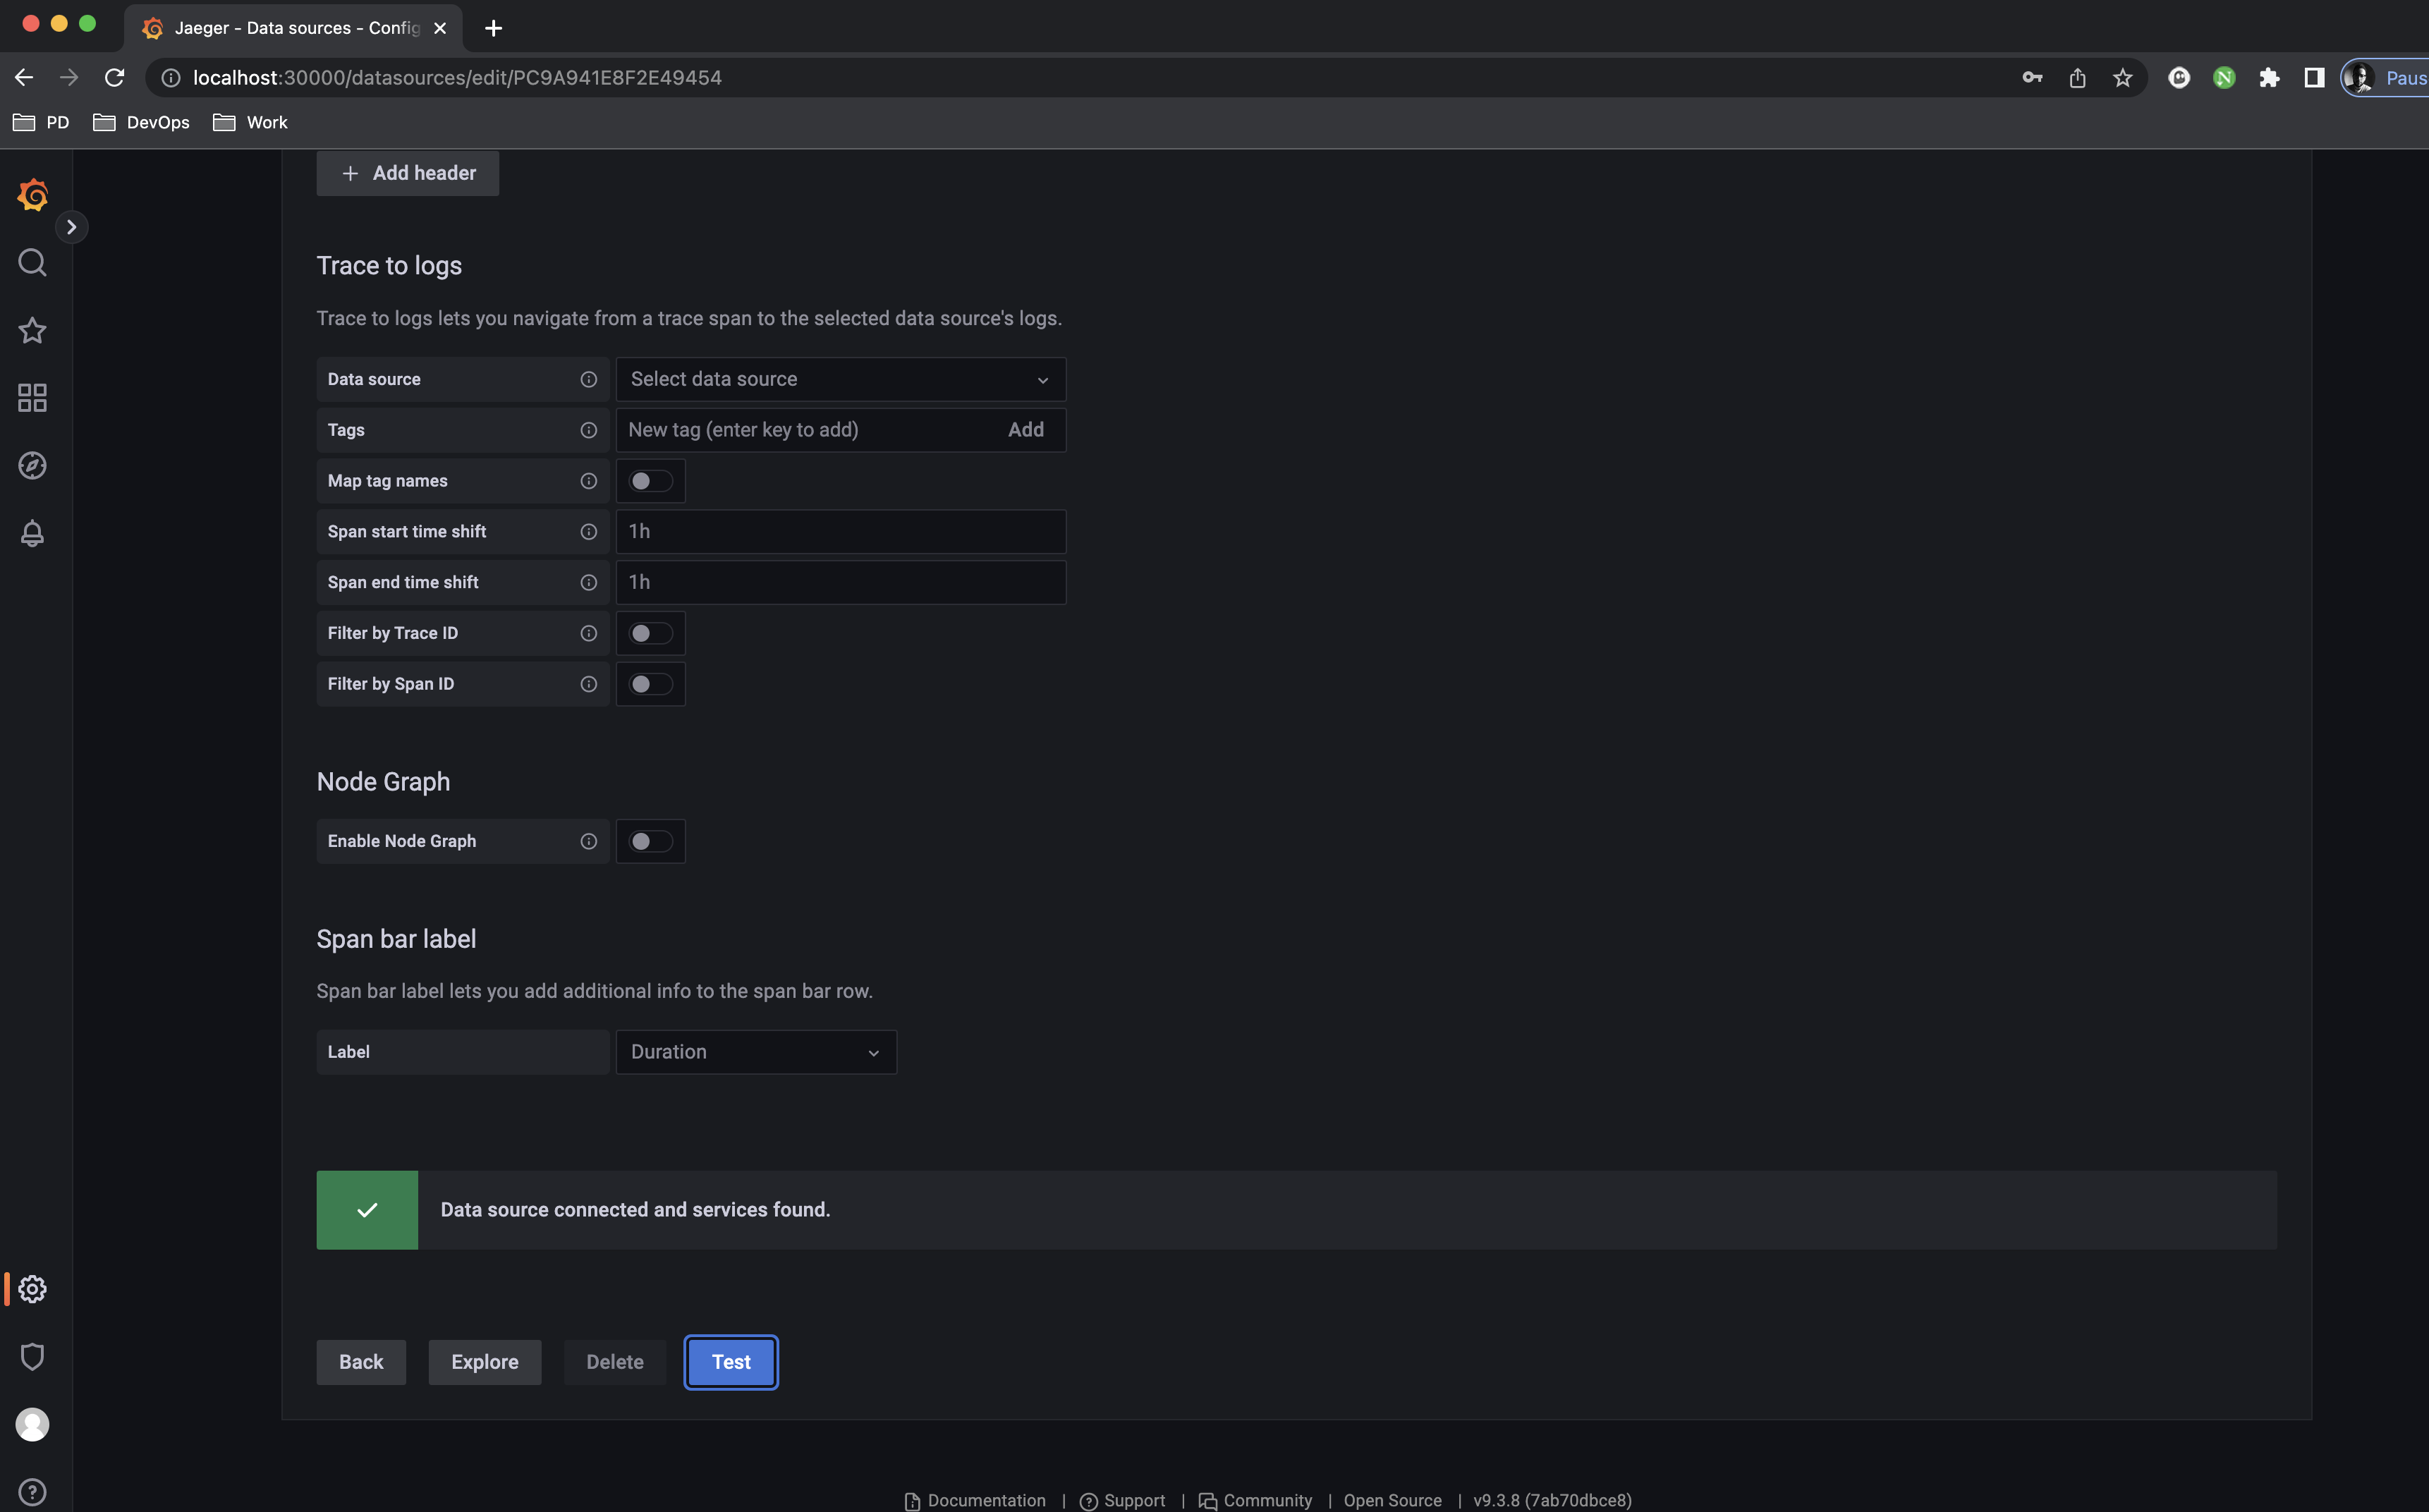
jaeger-all-in-oneinstance located indefaultnamespace as a datasource inGrafana Server. -
Automatic scraping of:
jaeger-operatormetrics located inobservabilitynamespace.jaeger-all-in-oneinstance metrics located indefaultnamespace.
-
Create
Jaeger-all-in-one / Overviewdashboard automatically to provide observability for your Jaeger instance which can be further customized. -
Configure local access to your provisioned
k3scluster, have no worries the setup will backup yourkubeconfigfile if exists and add it to yourHOMEdirectory with the current timestamp.Warning: This requires for you to have Linux or MacOS machine with
kubectlinstalled locally otherwise please comment lines 109-112 in Vagrantfile before runvagrant up.
After running vagrant up, you can use scripts/copy_kubeconfig.sh script independently to install /etc/rancher/k3s/k3s.yaml file onto your local machine.
Warning: You need to run the script from the project's root directory where
Vagrantfileresides otherwise, it will fail.
Execute the following:
$ bash scripts/copy_kubeconfig.sh

[INFO] connecting to vagrant@127.0.0.1:2222..
[INFO] connection success..
[WARNING] /Users/shehabeldeen/.kube/config already exists
[INFO] backing up /Users/shehabeldeen/.kube/config to /Users/shehabeldeen/config.backup.1678907724..
[INFO] copying k3s kubeconfig to /Users/shehabeldeen/.kube/config
[INFO] you can now access k3s cluster locally, run:
    $ kubectl version
📝 Note:
copy_kubbeconfig.shaccepts one argument;config_pathwhich is the destination path of thek3s.yamlto be installed in. By default it is equal to"${HOME}/.kube/config"copy_kubbeconfig.shneeds 4 environment variables:
SSH_USER: remote user accessed by vagrant ssh, by default is,vagrant.SSH_USER_PASS: remote user password, by default isvagrant.SSH_PORT: ssh port, by default is2222which is forwarded from host machine to guest machine at22.SSH_HOST: ssh server hostname, by default islocalhost
3. Validate Installation
As mentioned in the previous section, the installation can take up to 20 minutes and these are some logs that you can validate your installation with from vagrant up command:
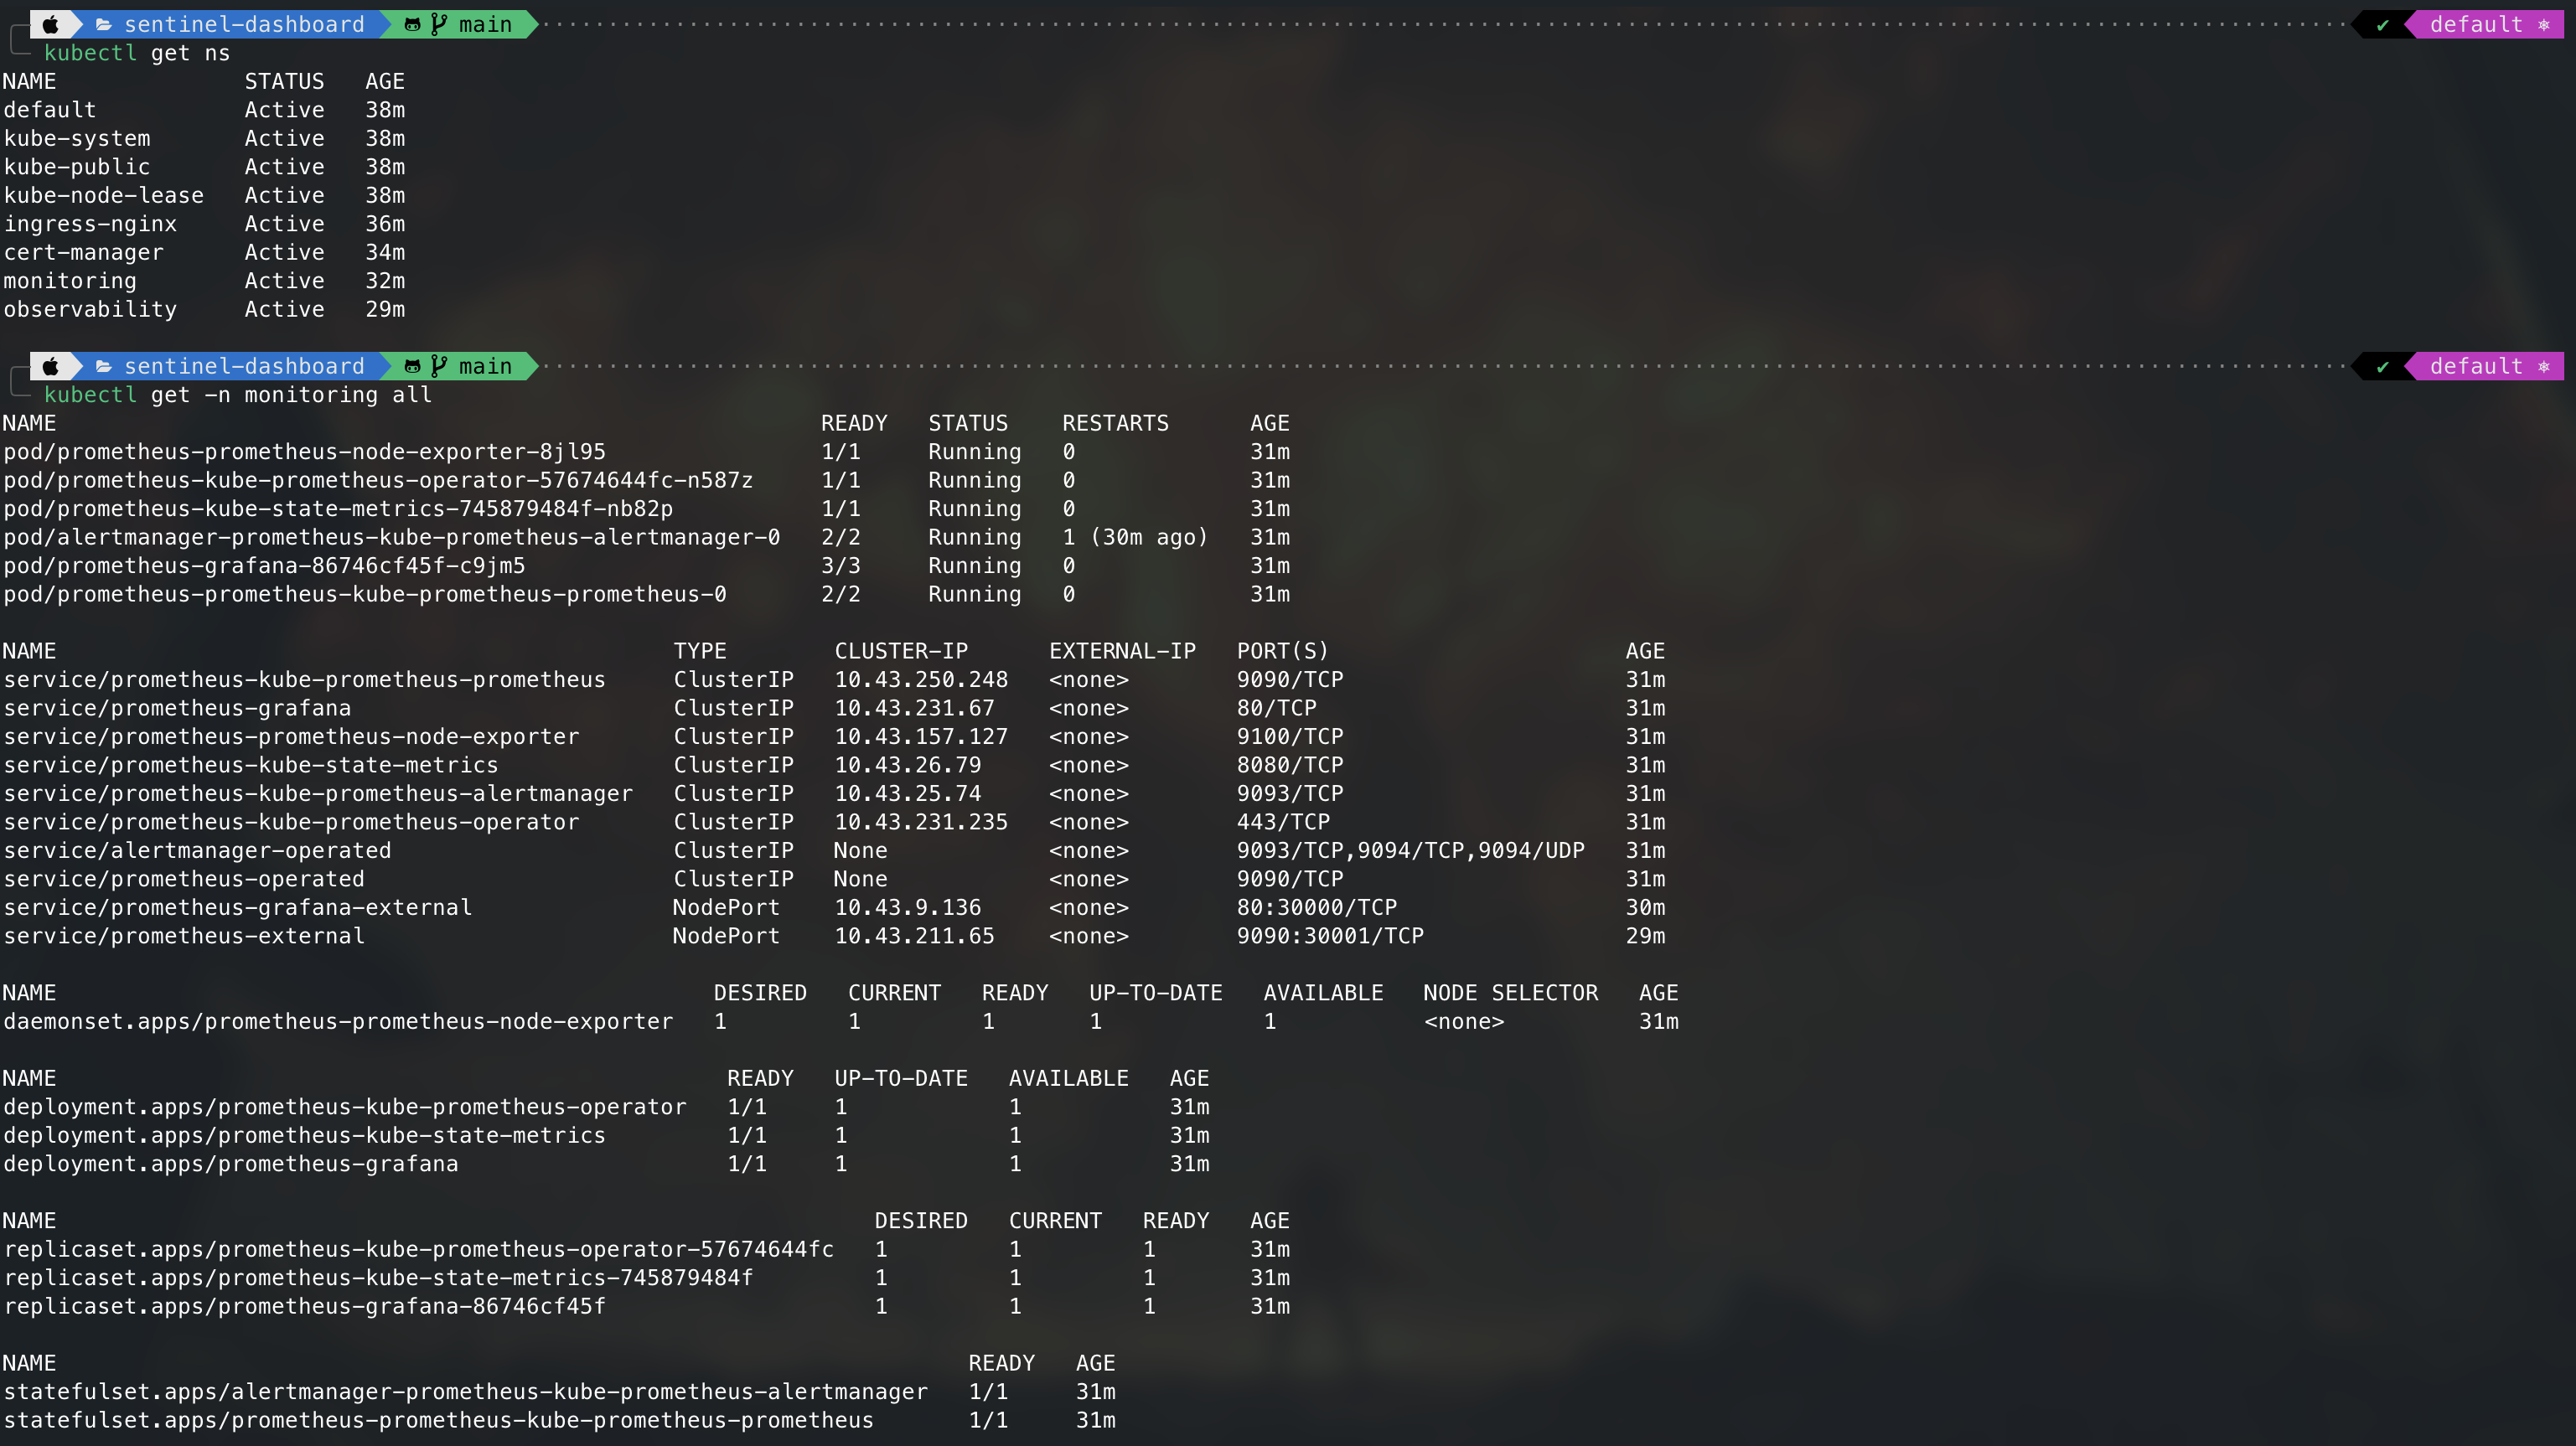
3.1 Workloads Check
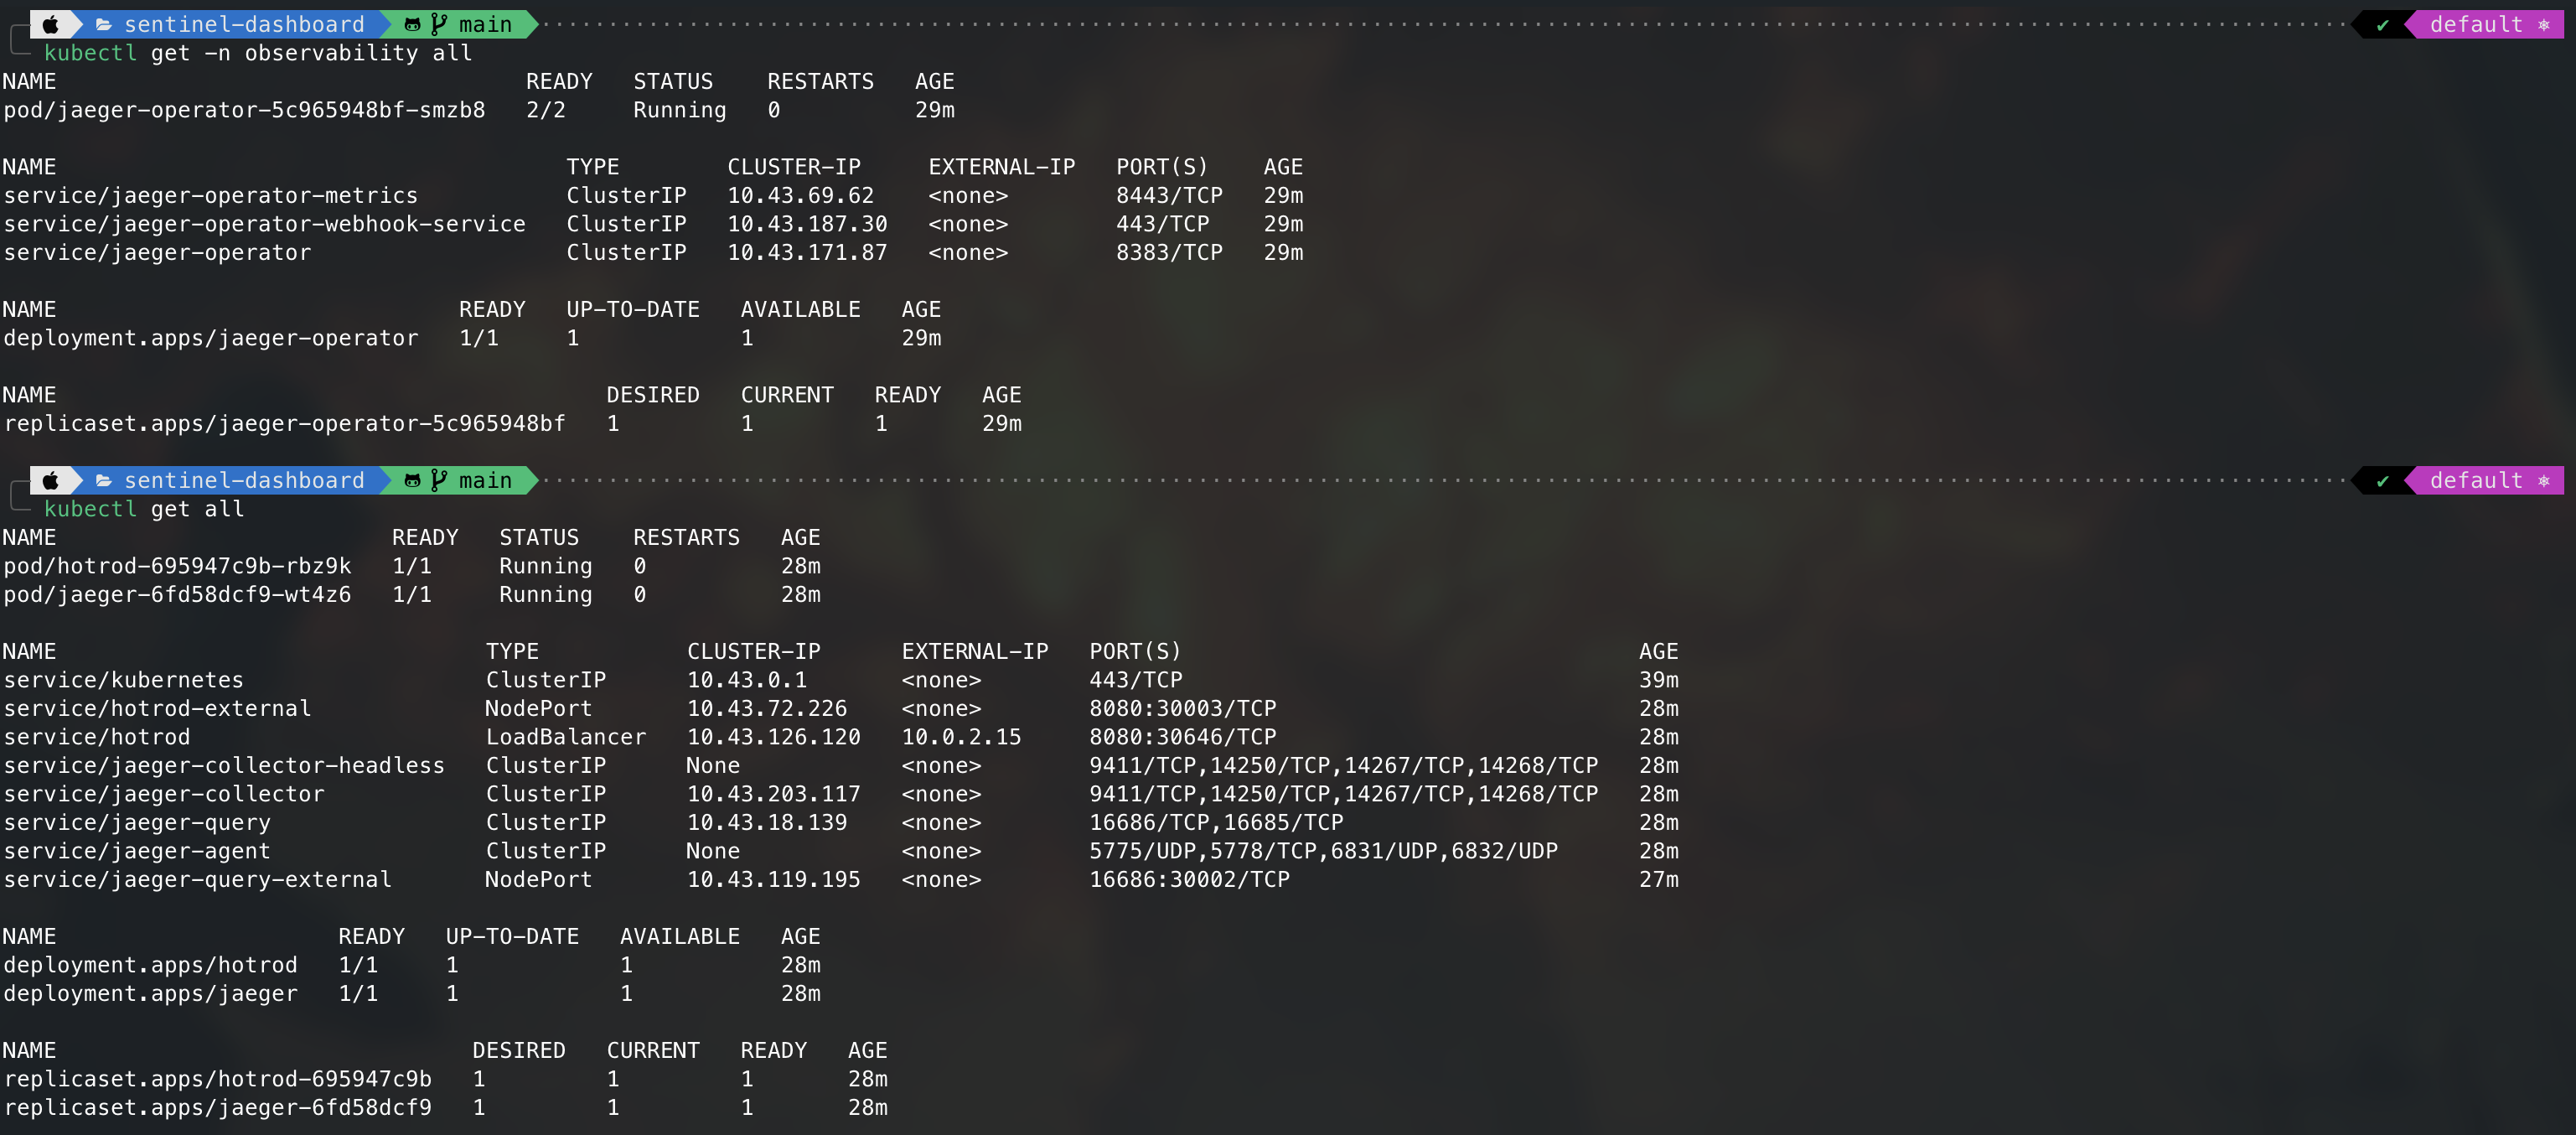
Use kubectl to check the workloads, you should be able to find the following:
3.2 Functionality Check
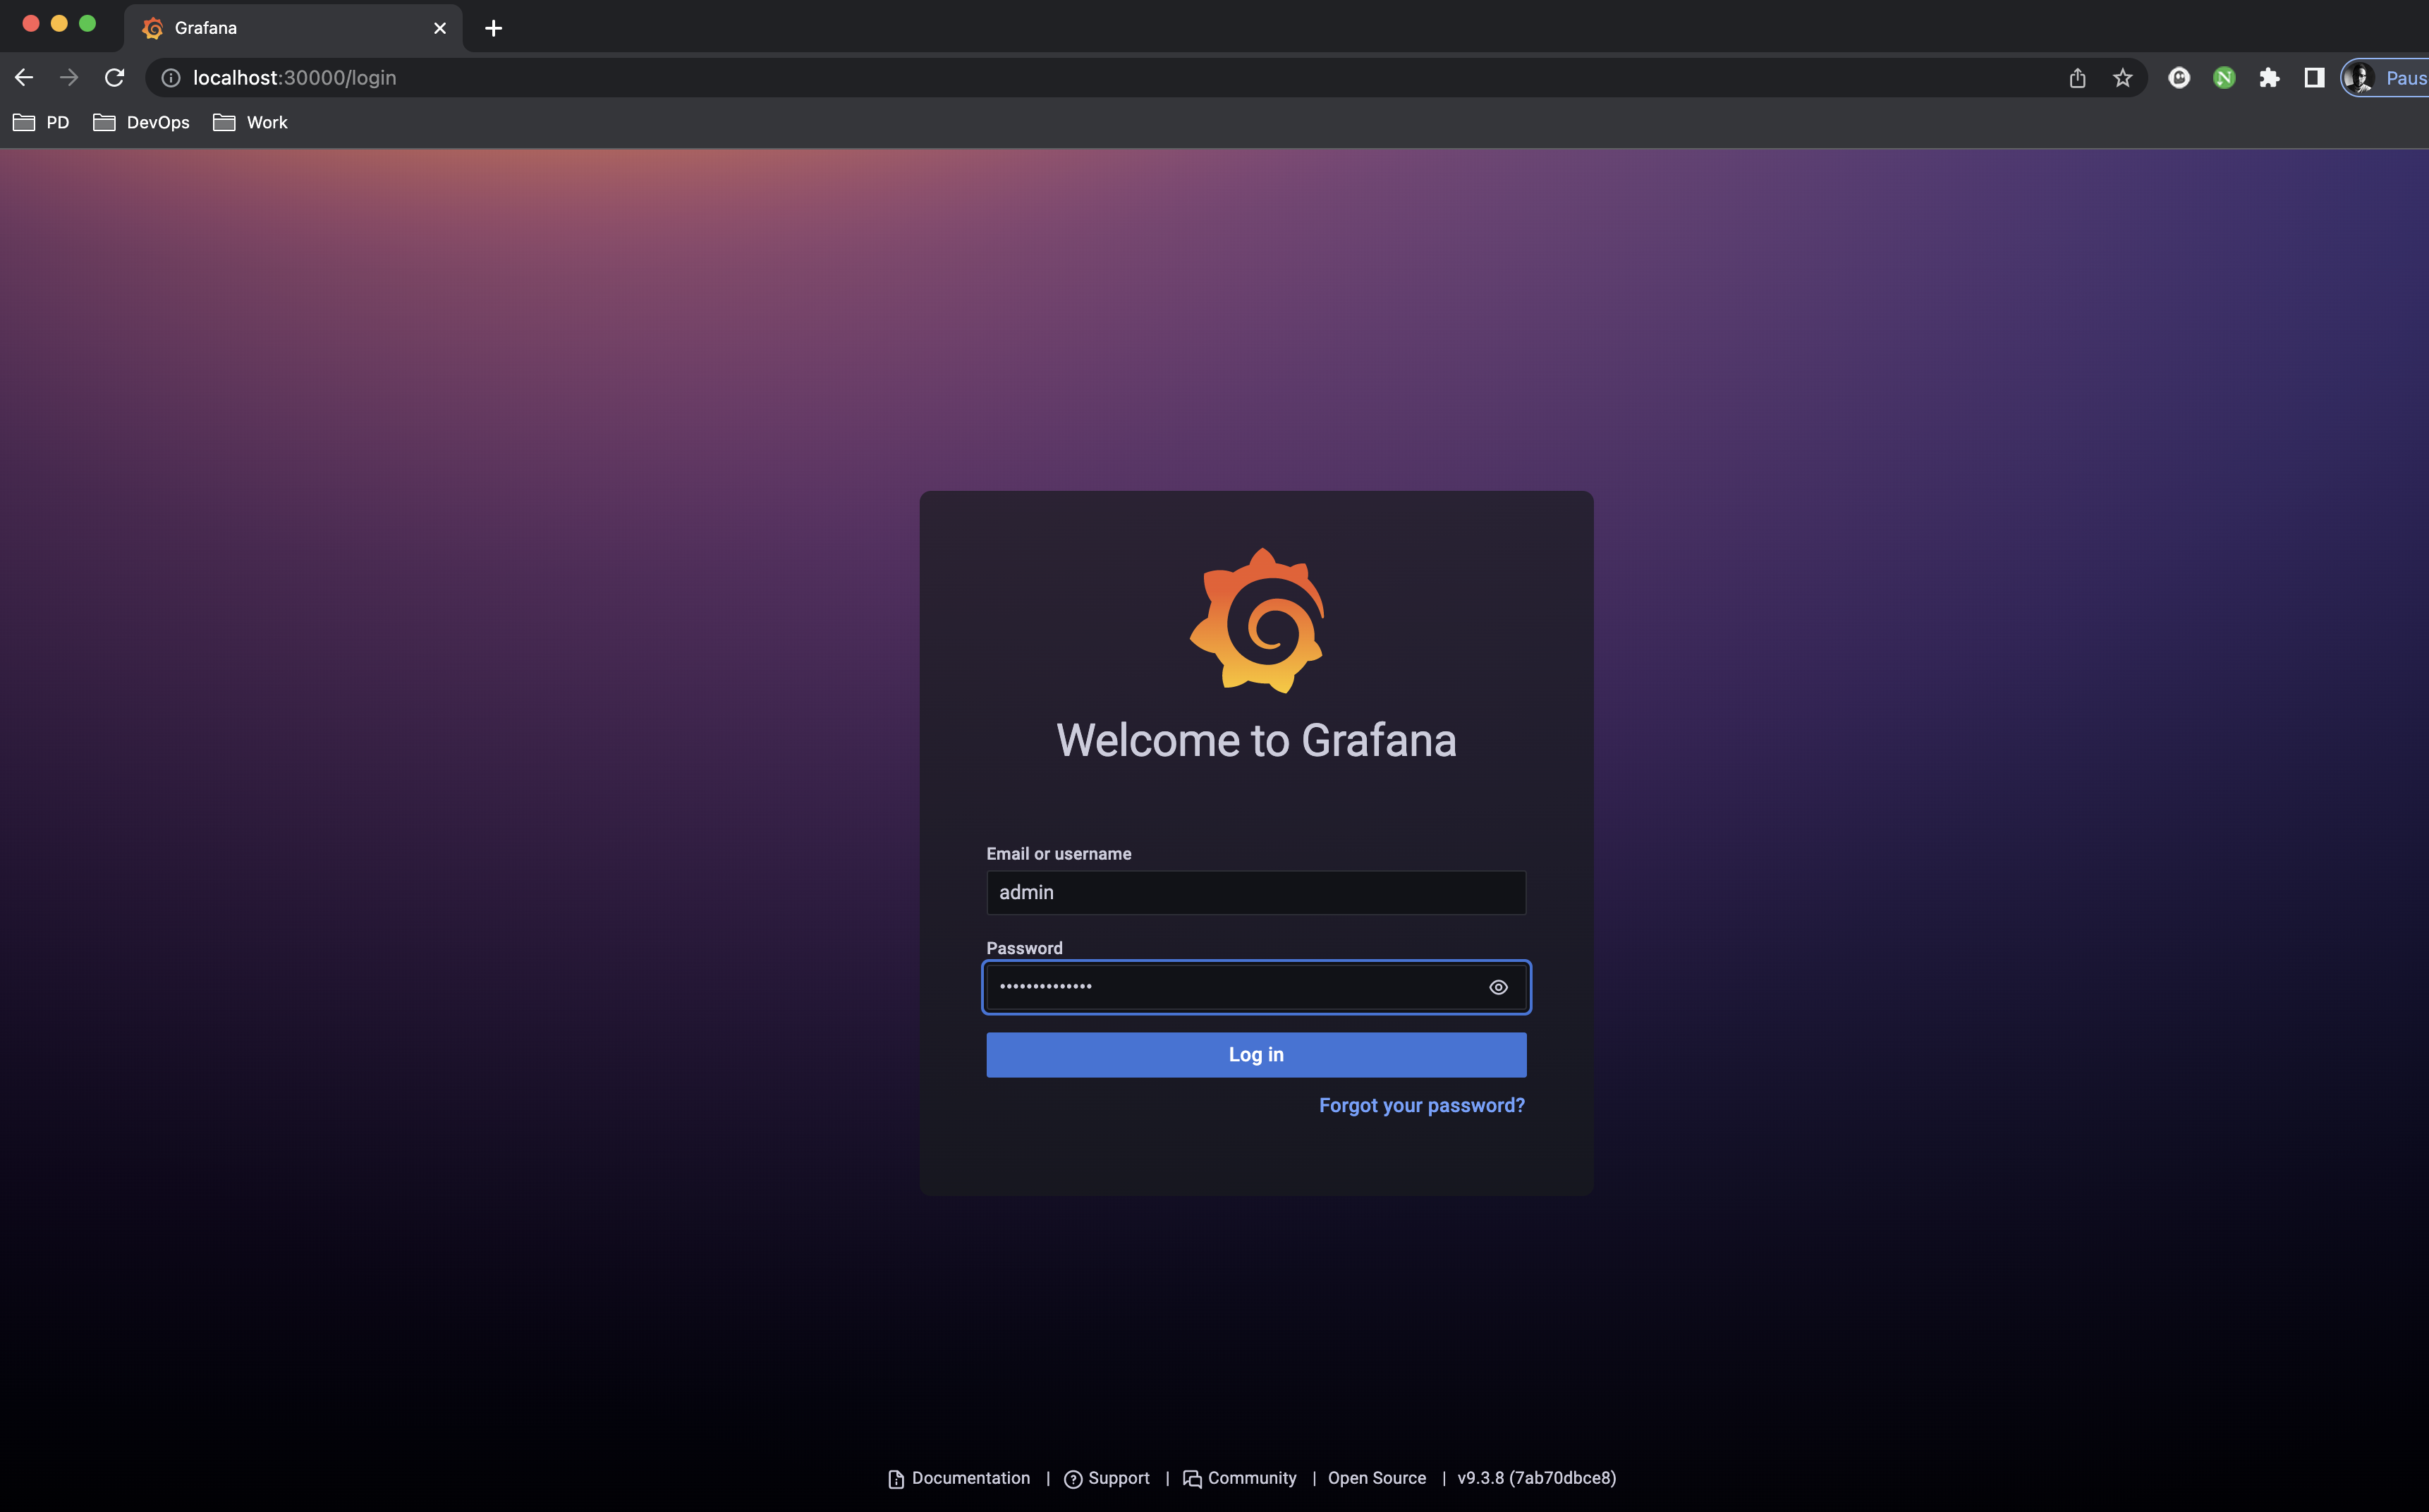
Now go to http://localhost:30000 on your local browser and you should see Grafana Login Page:
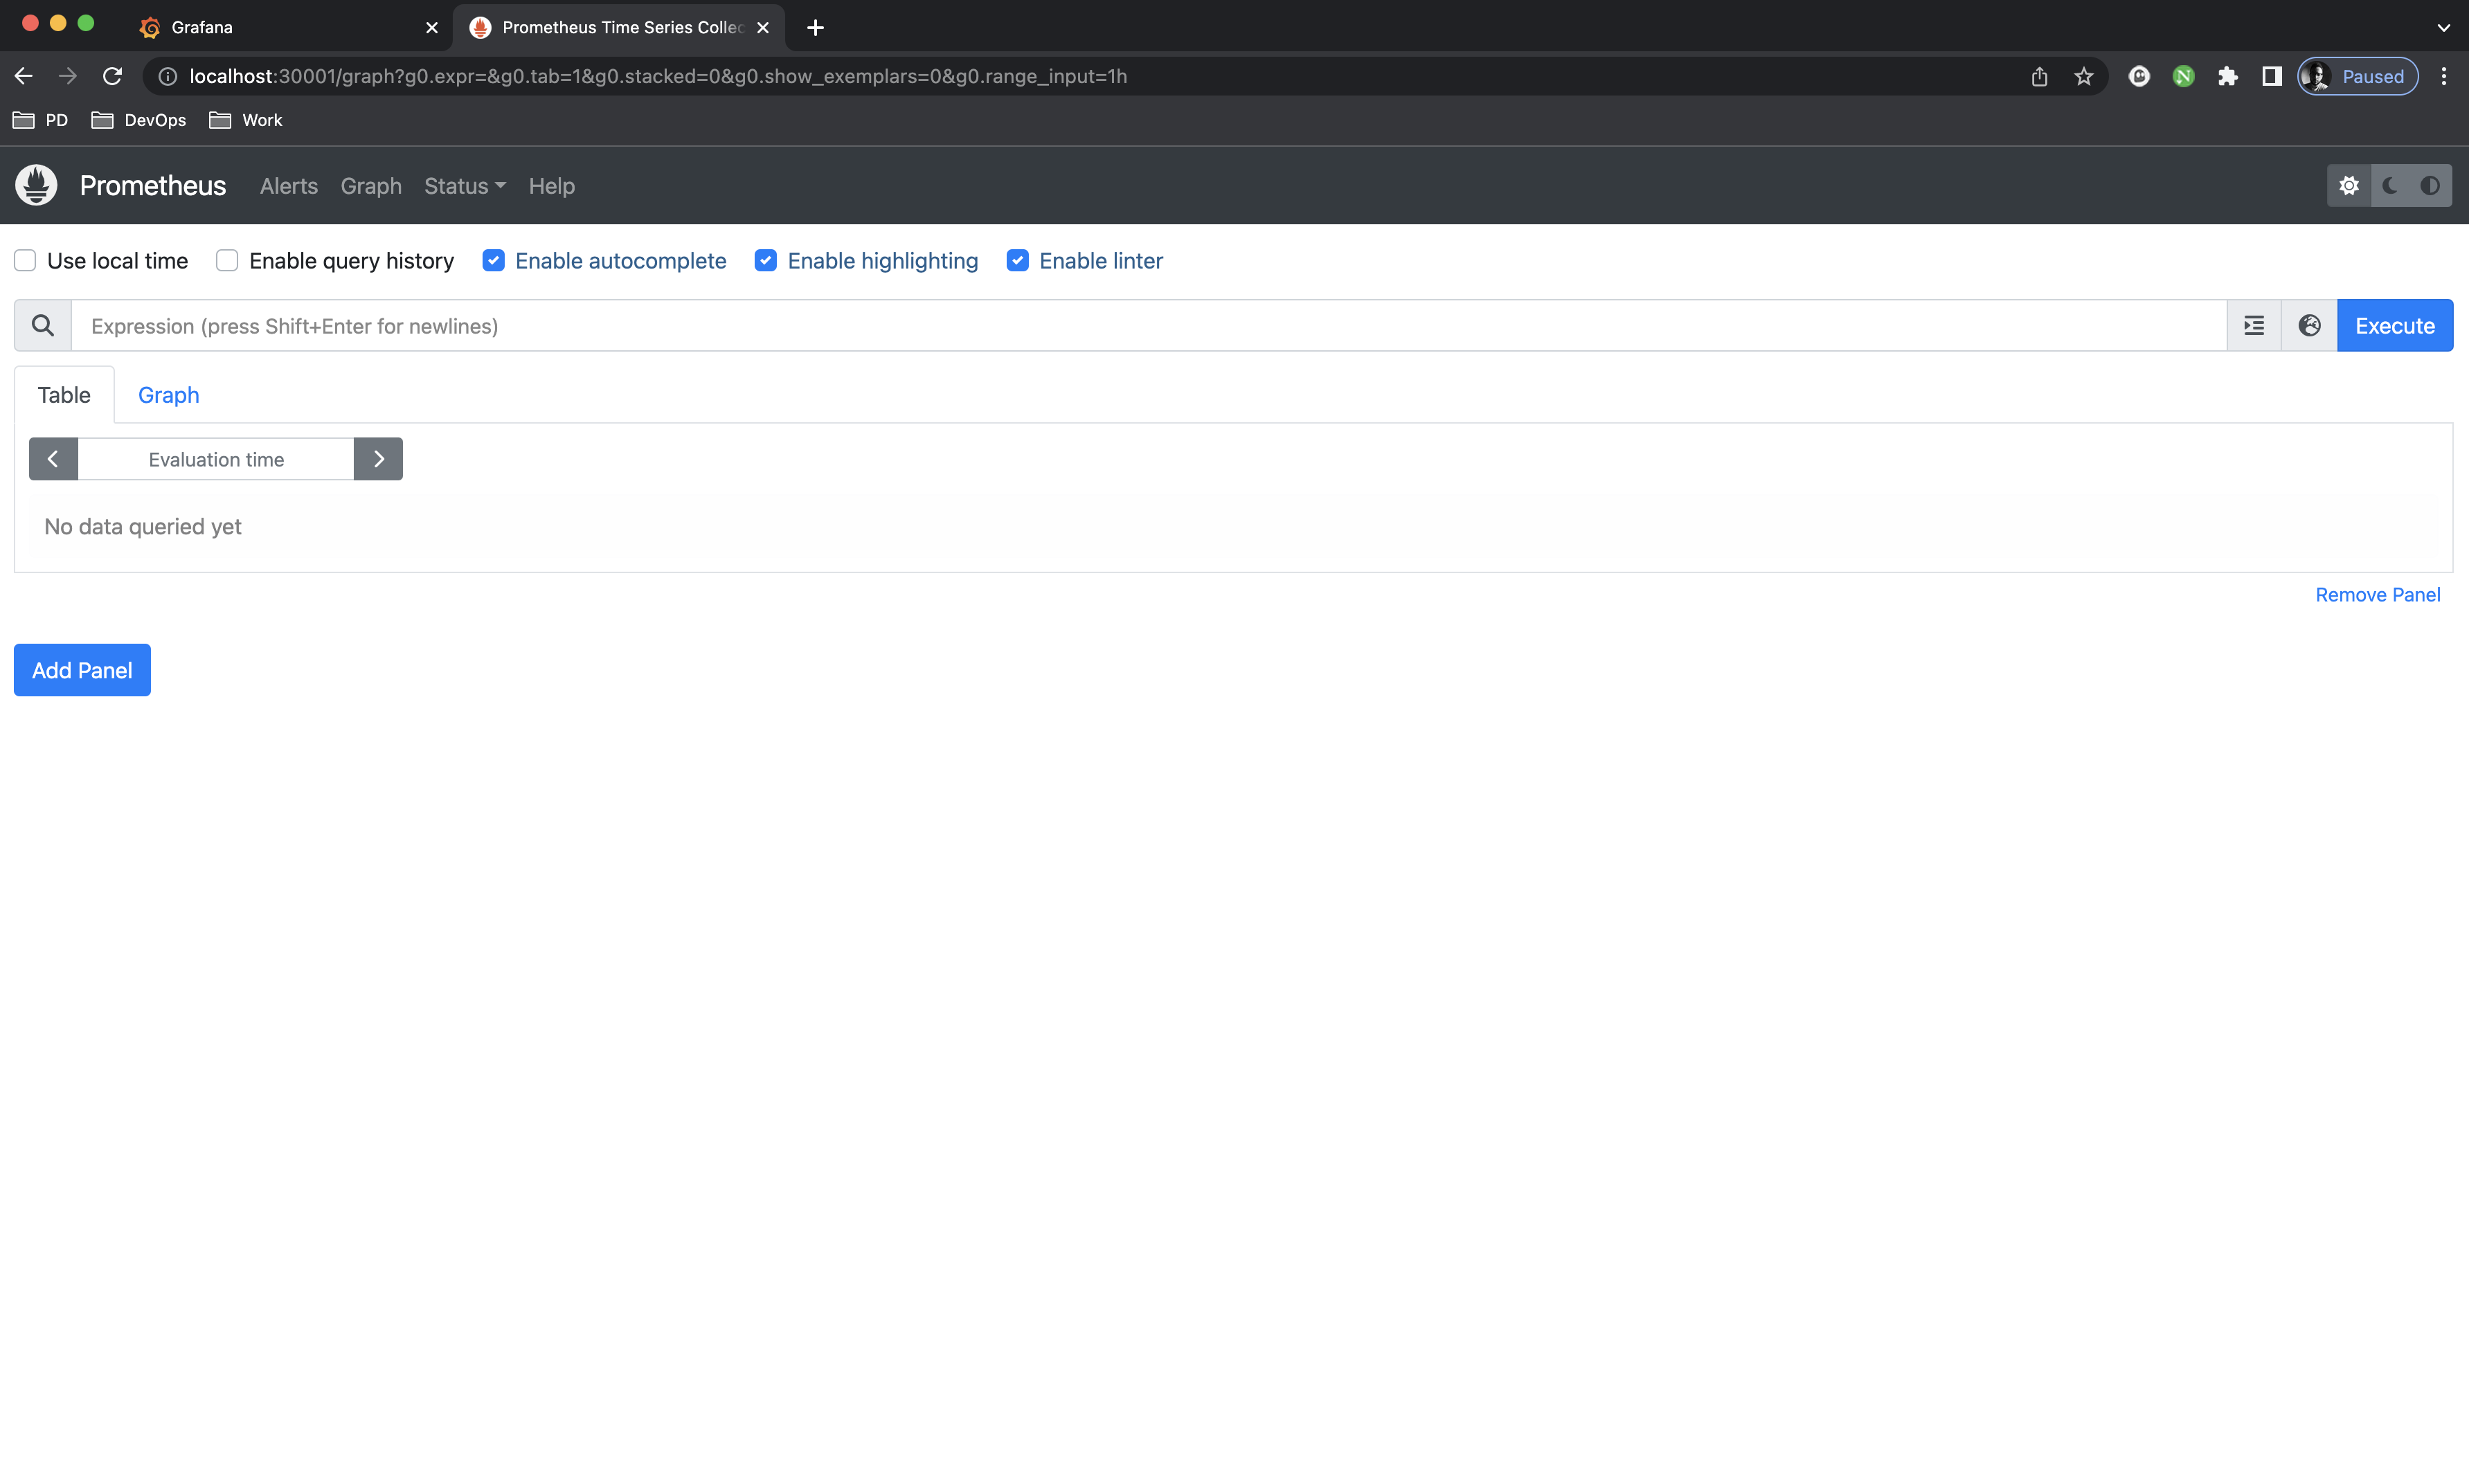
Go to http://localhost:30001 and you should see Prometheus Server Home Page:
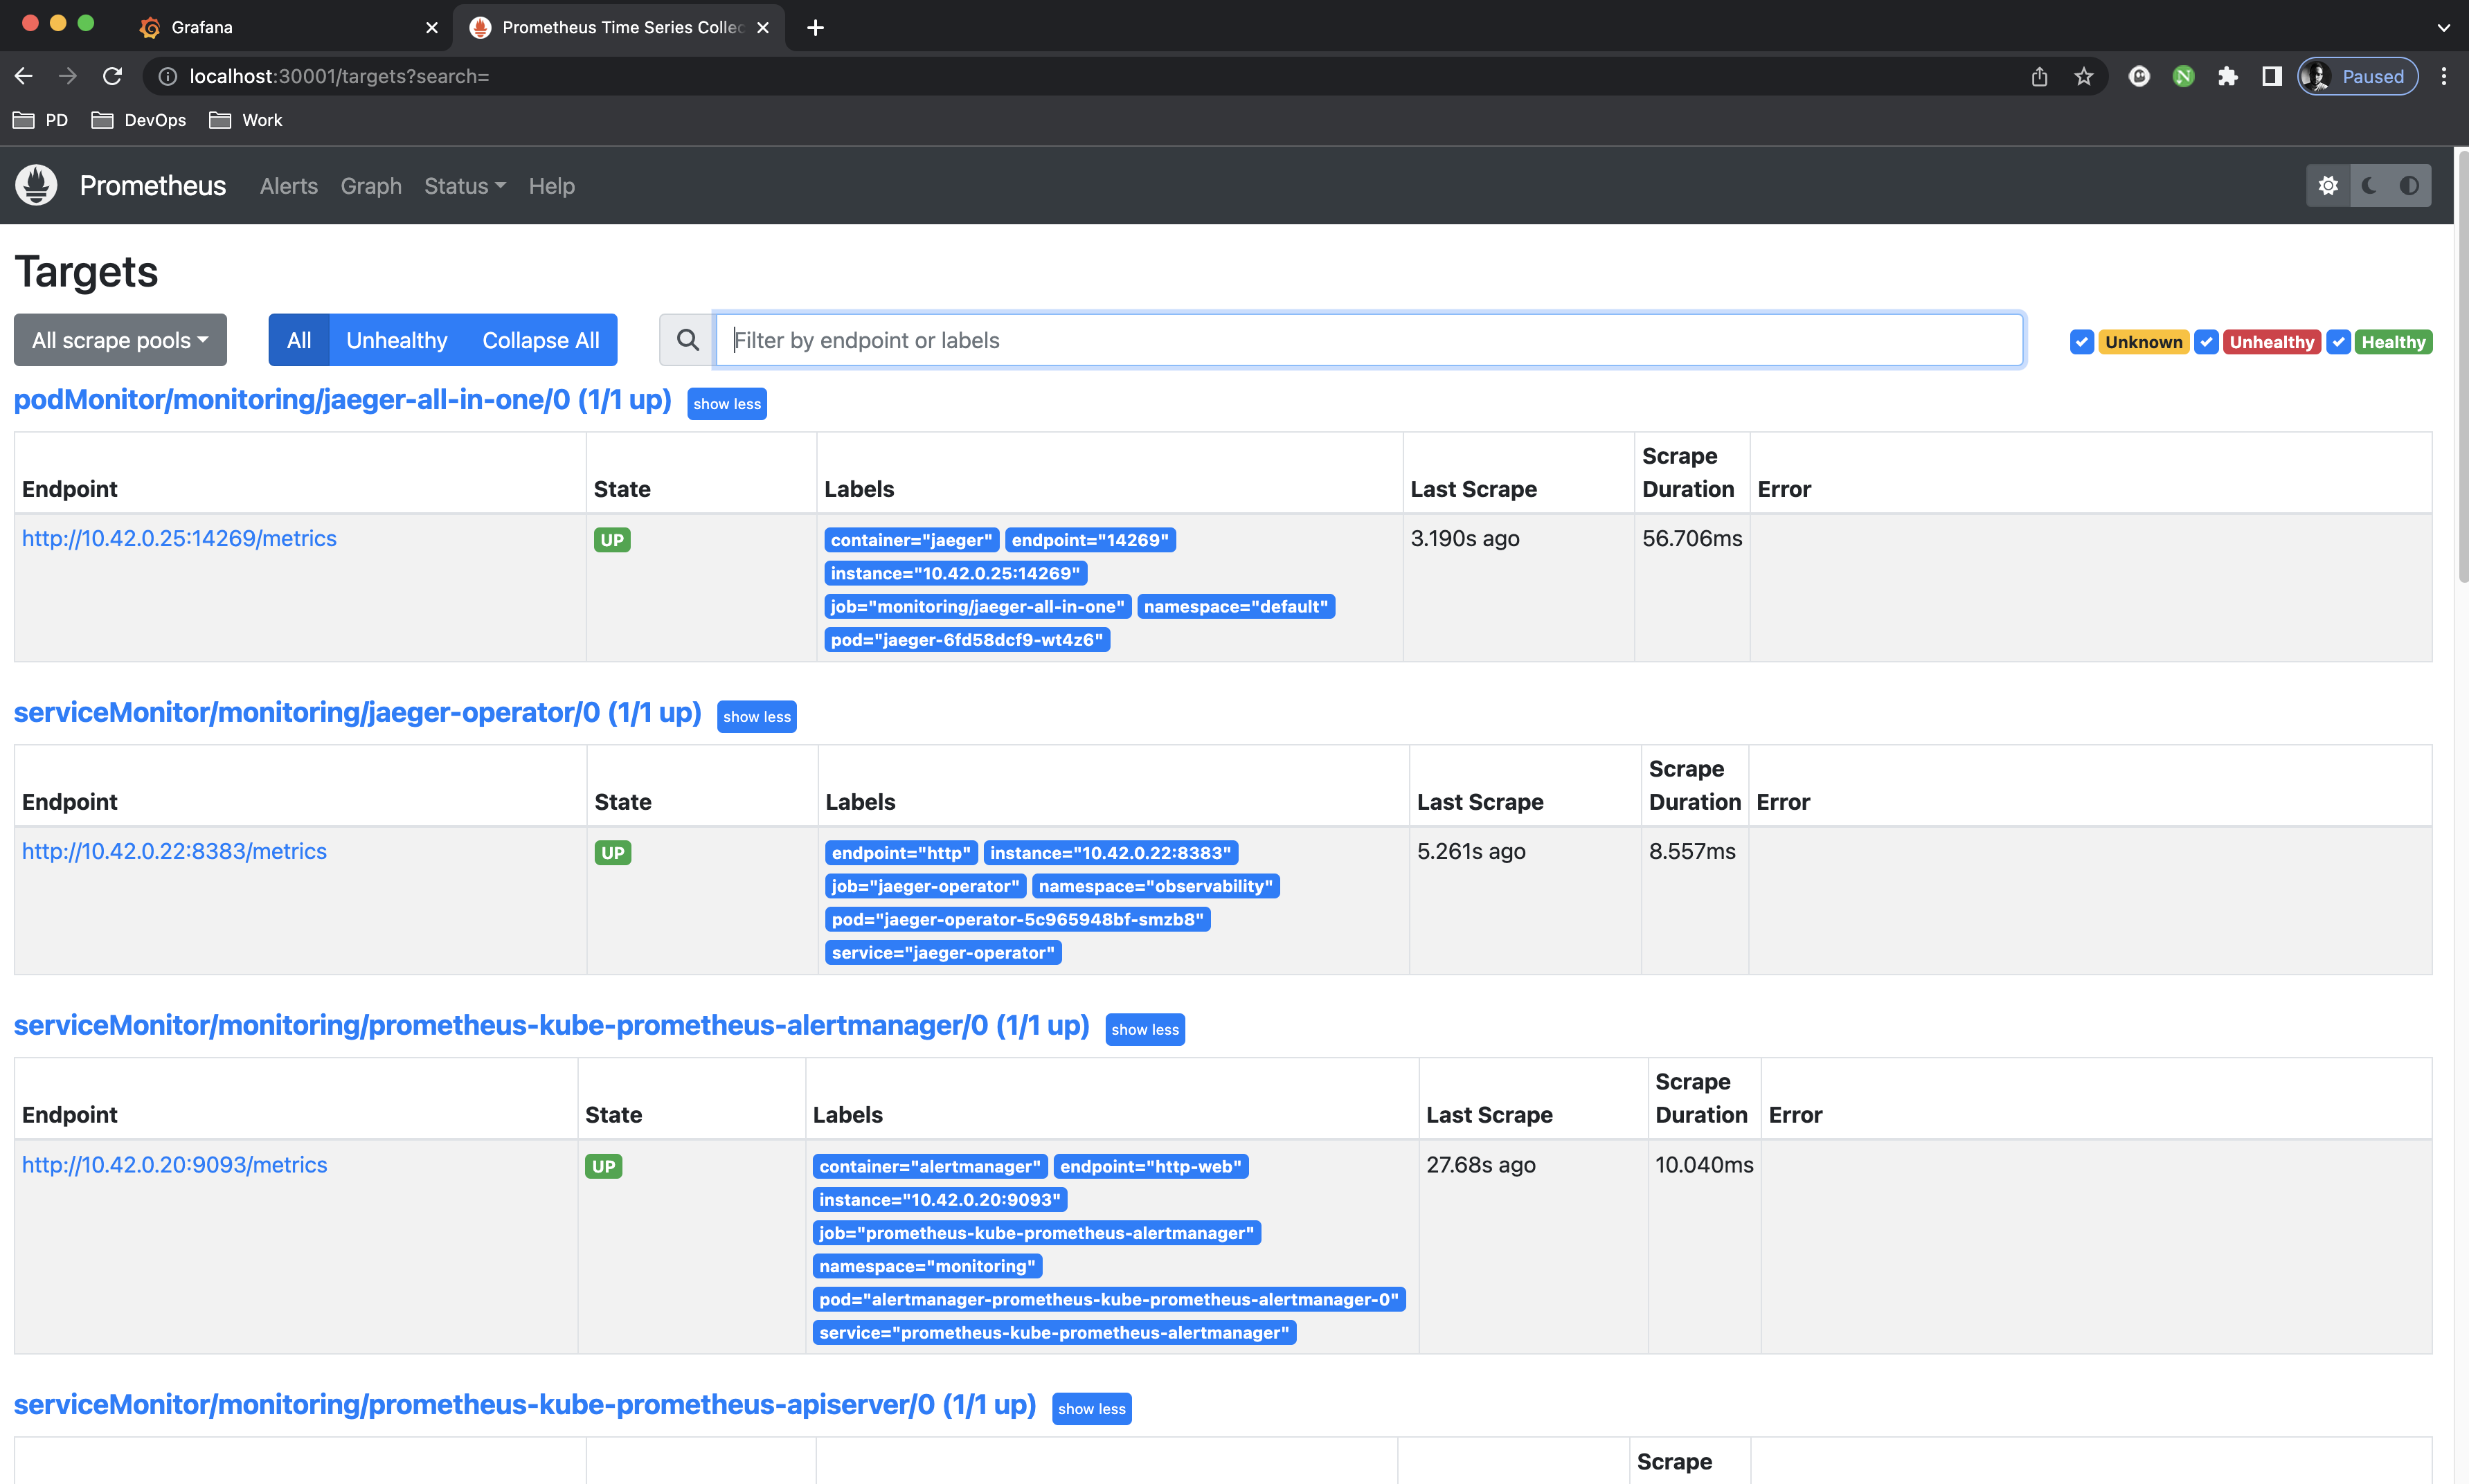 Prometheus has been automatically configured to scrape data from
 jaeger-operator and jaeger-all-in-one
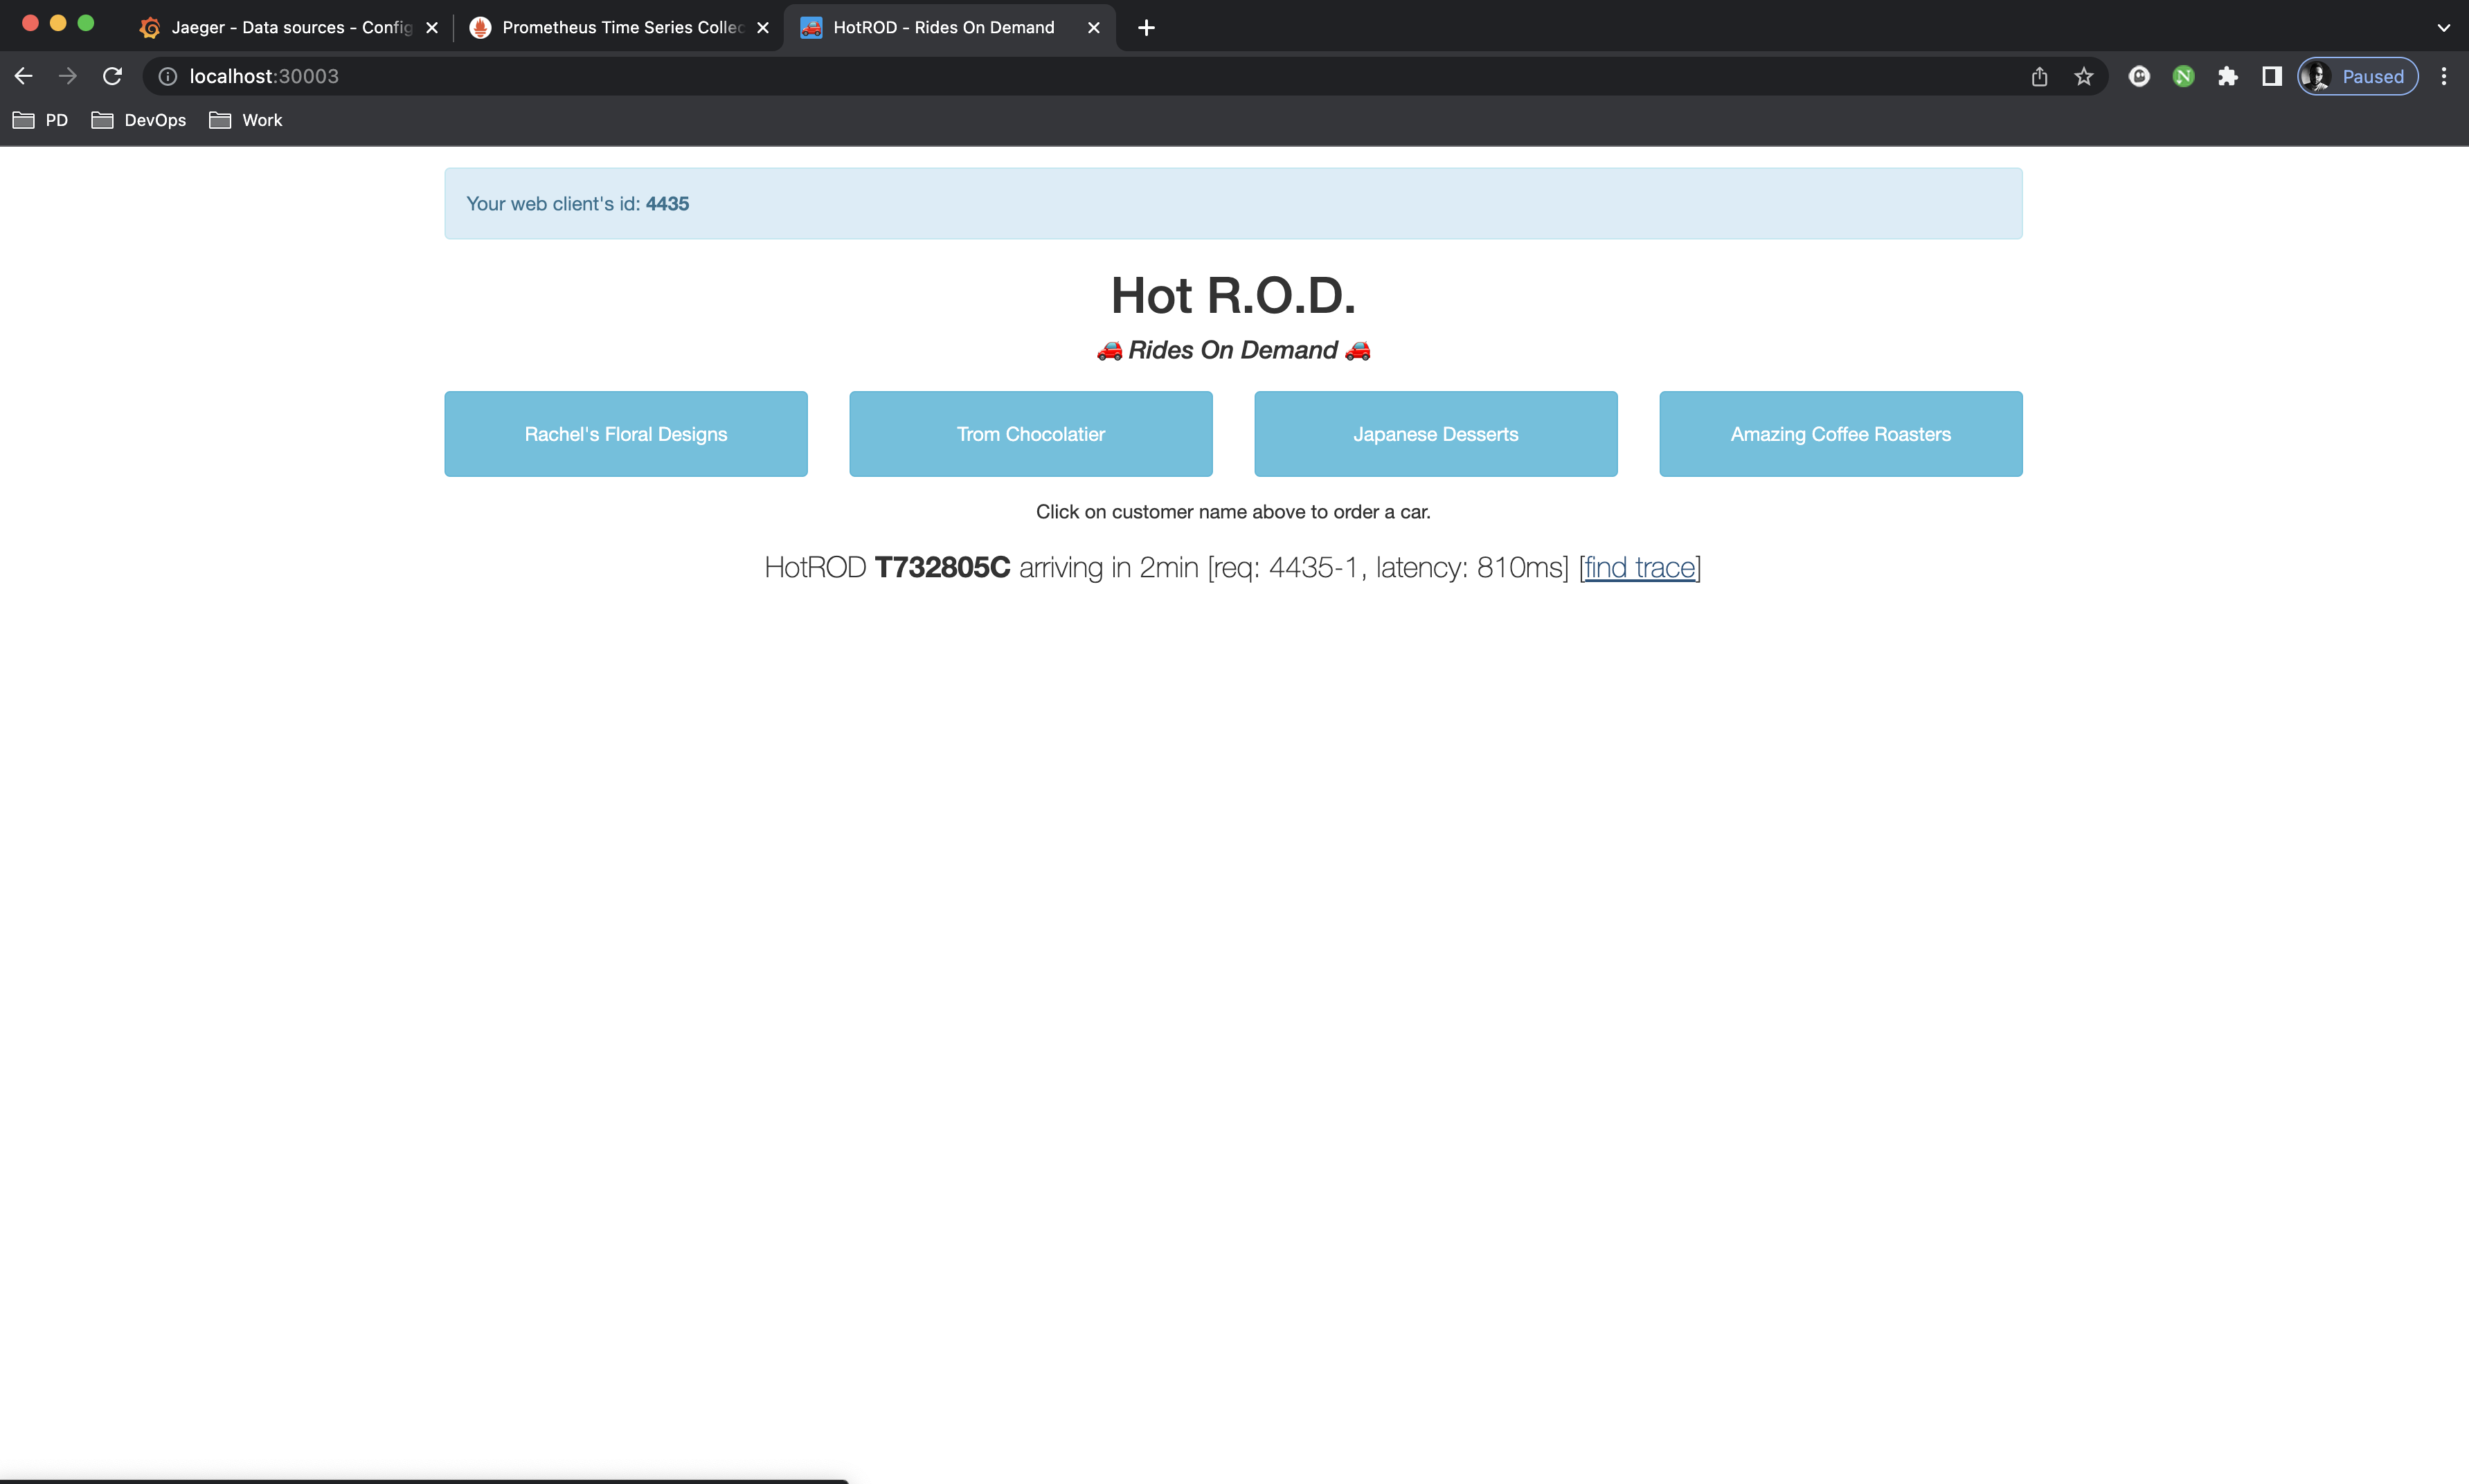
Go to http://localhost:30003 and you should see Hotrod Application:
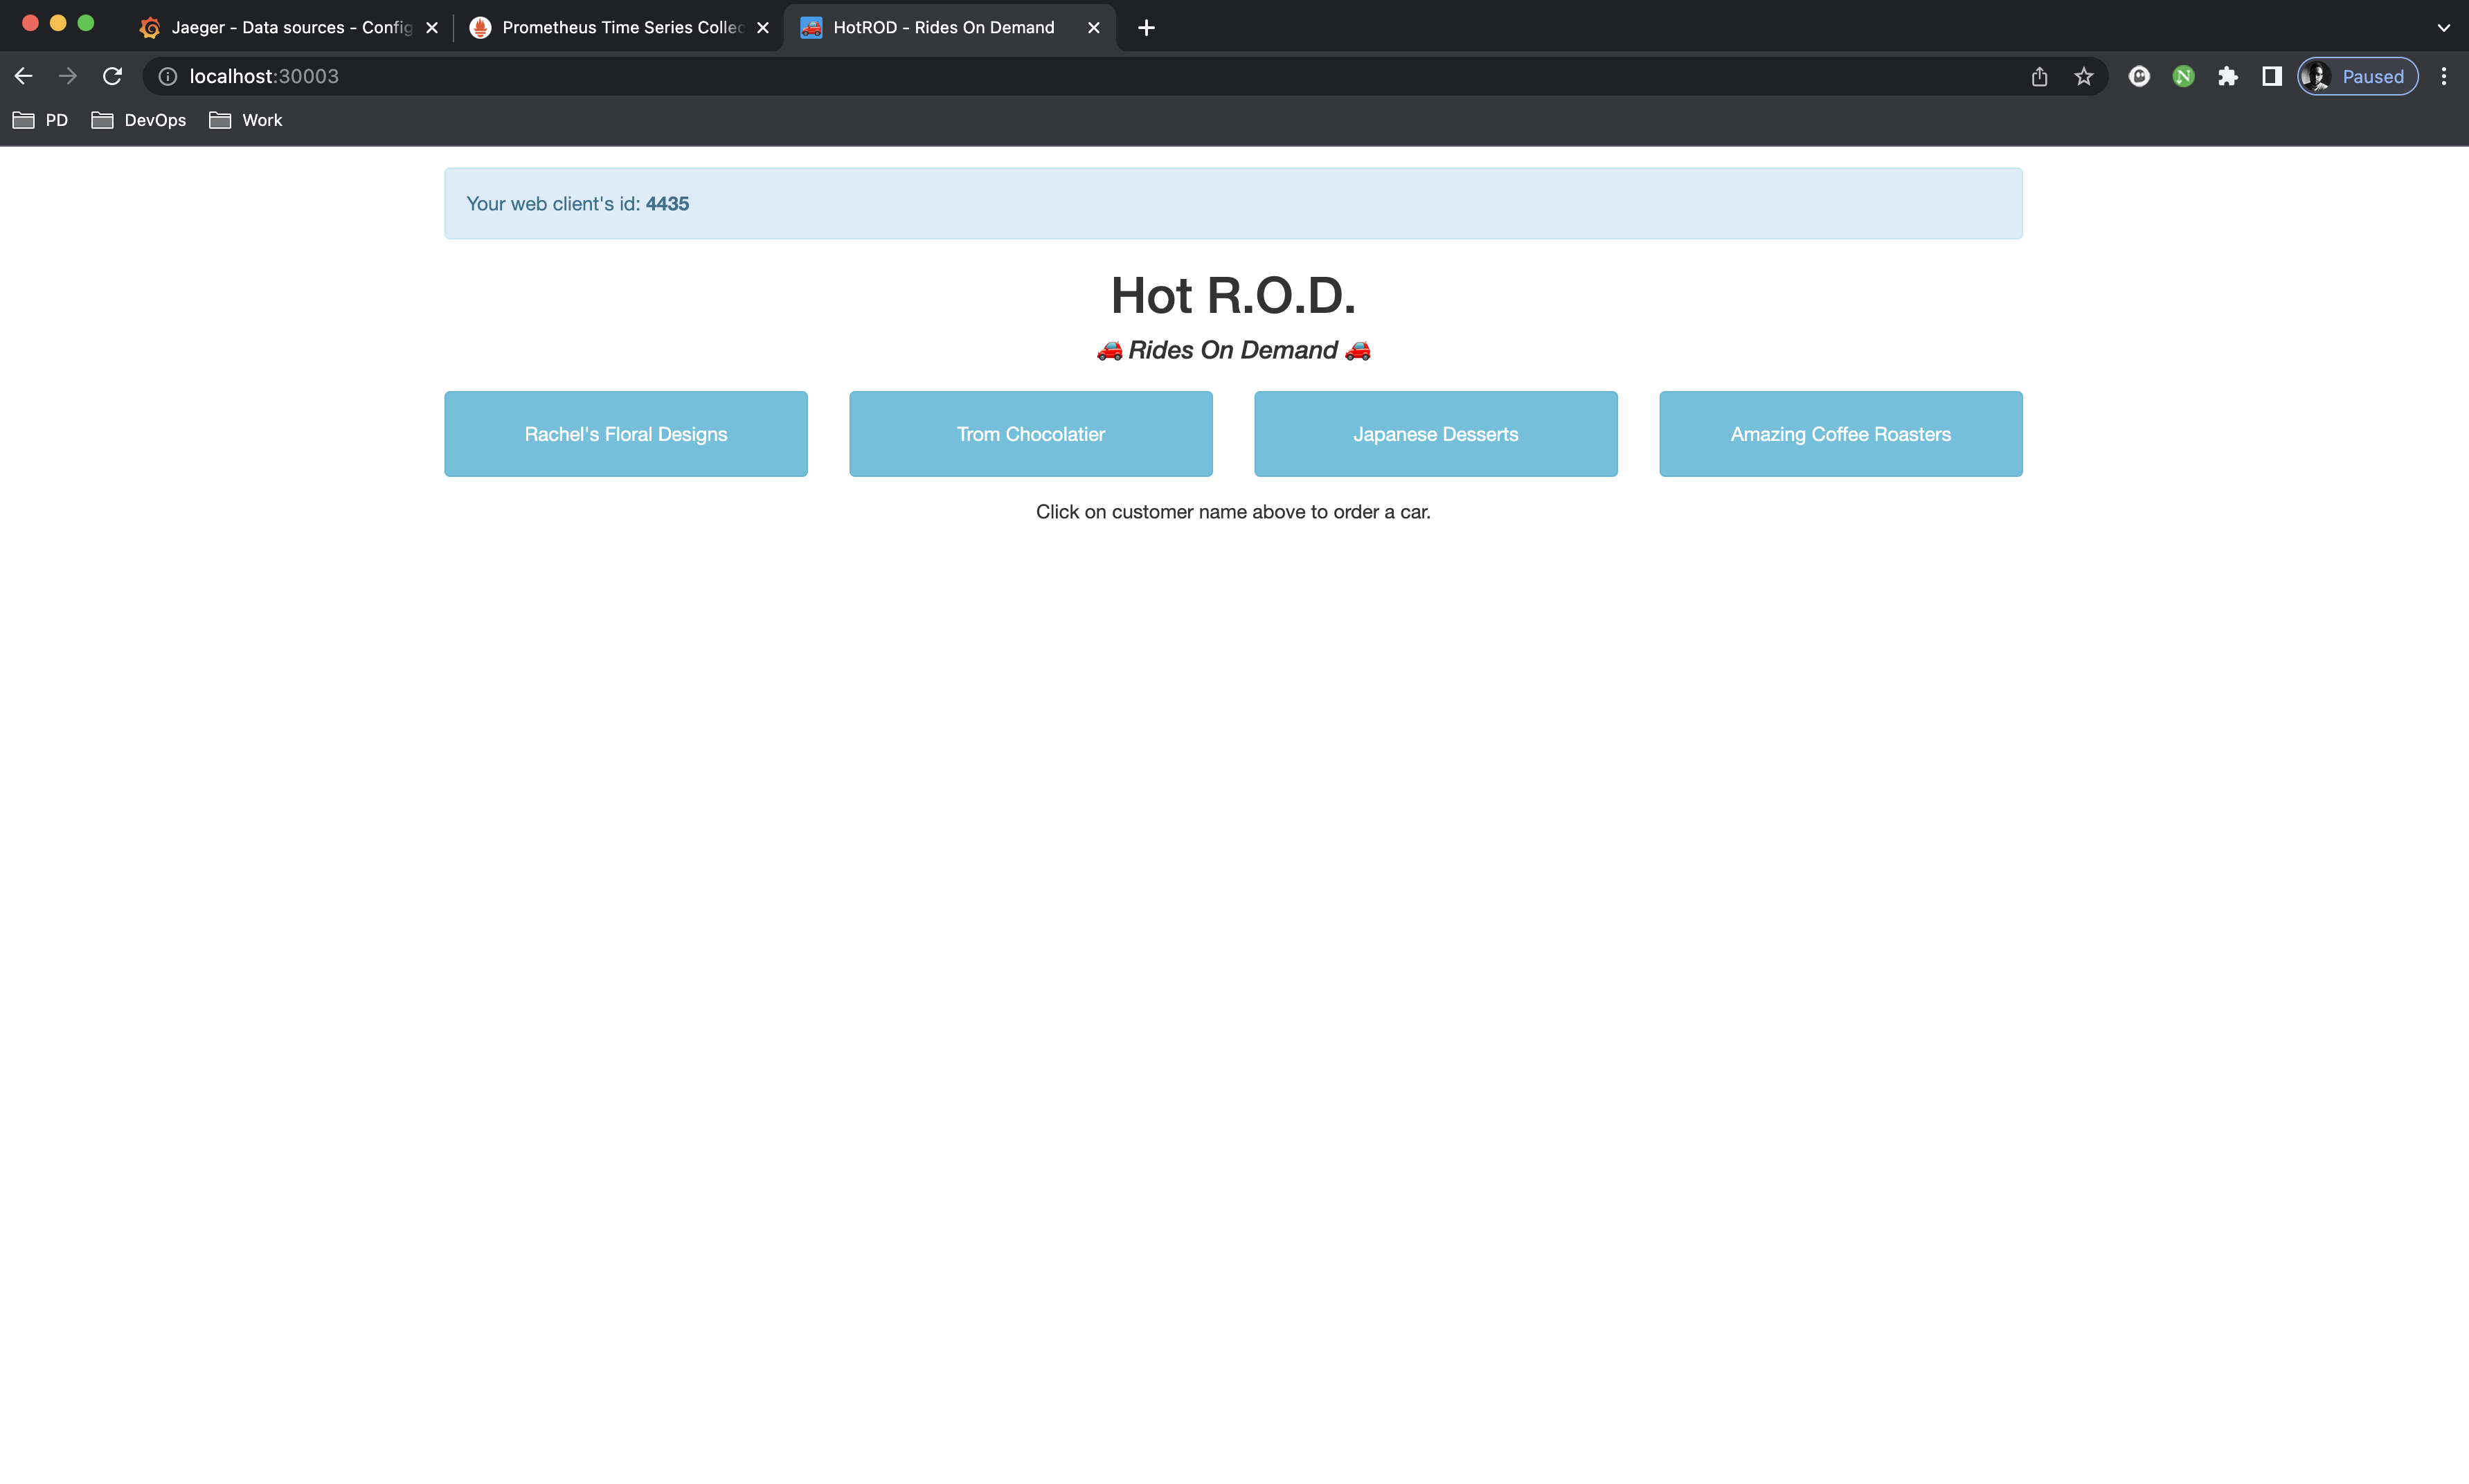 hotrod app is composed of multiple services running in parallel; frontend, backend, customer and some more. Click on any customer to dispatch a driver which will initiate a trace
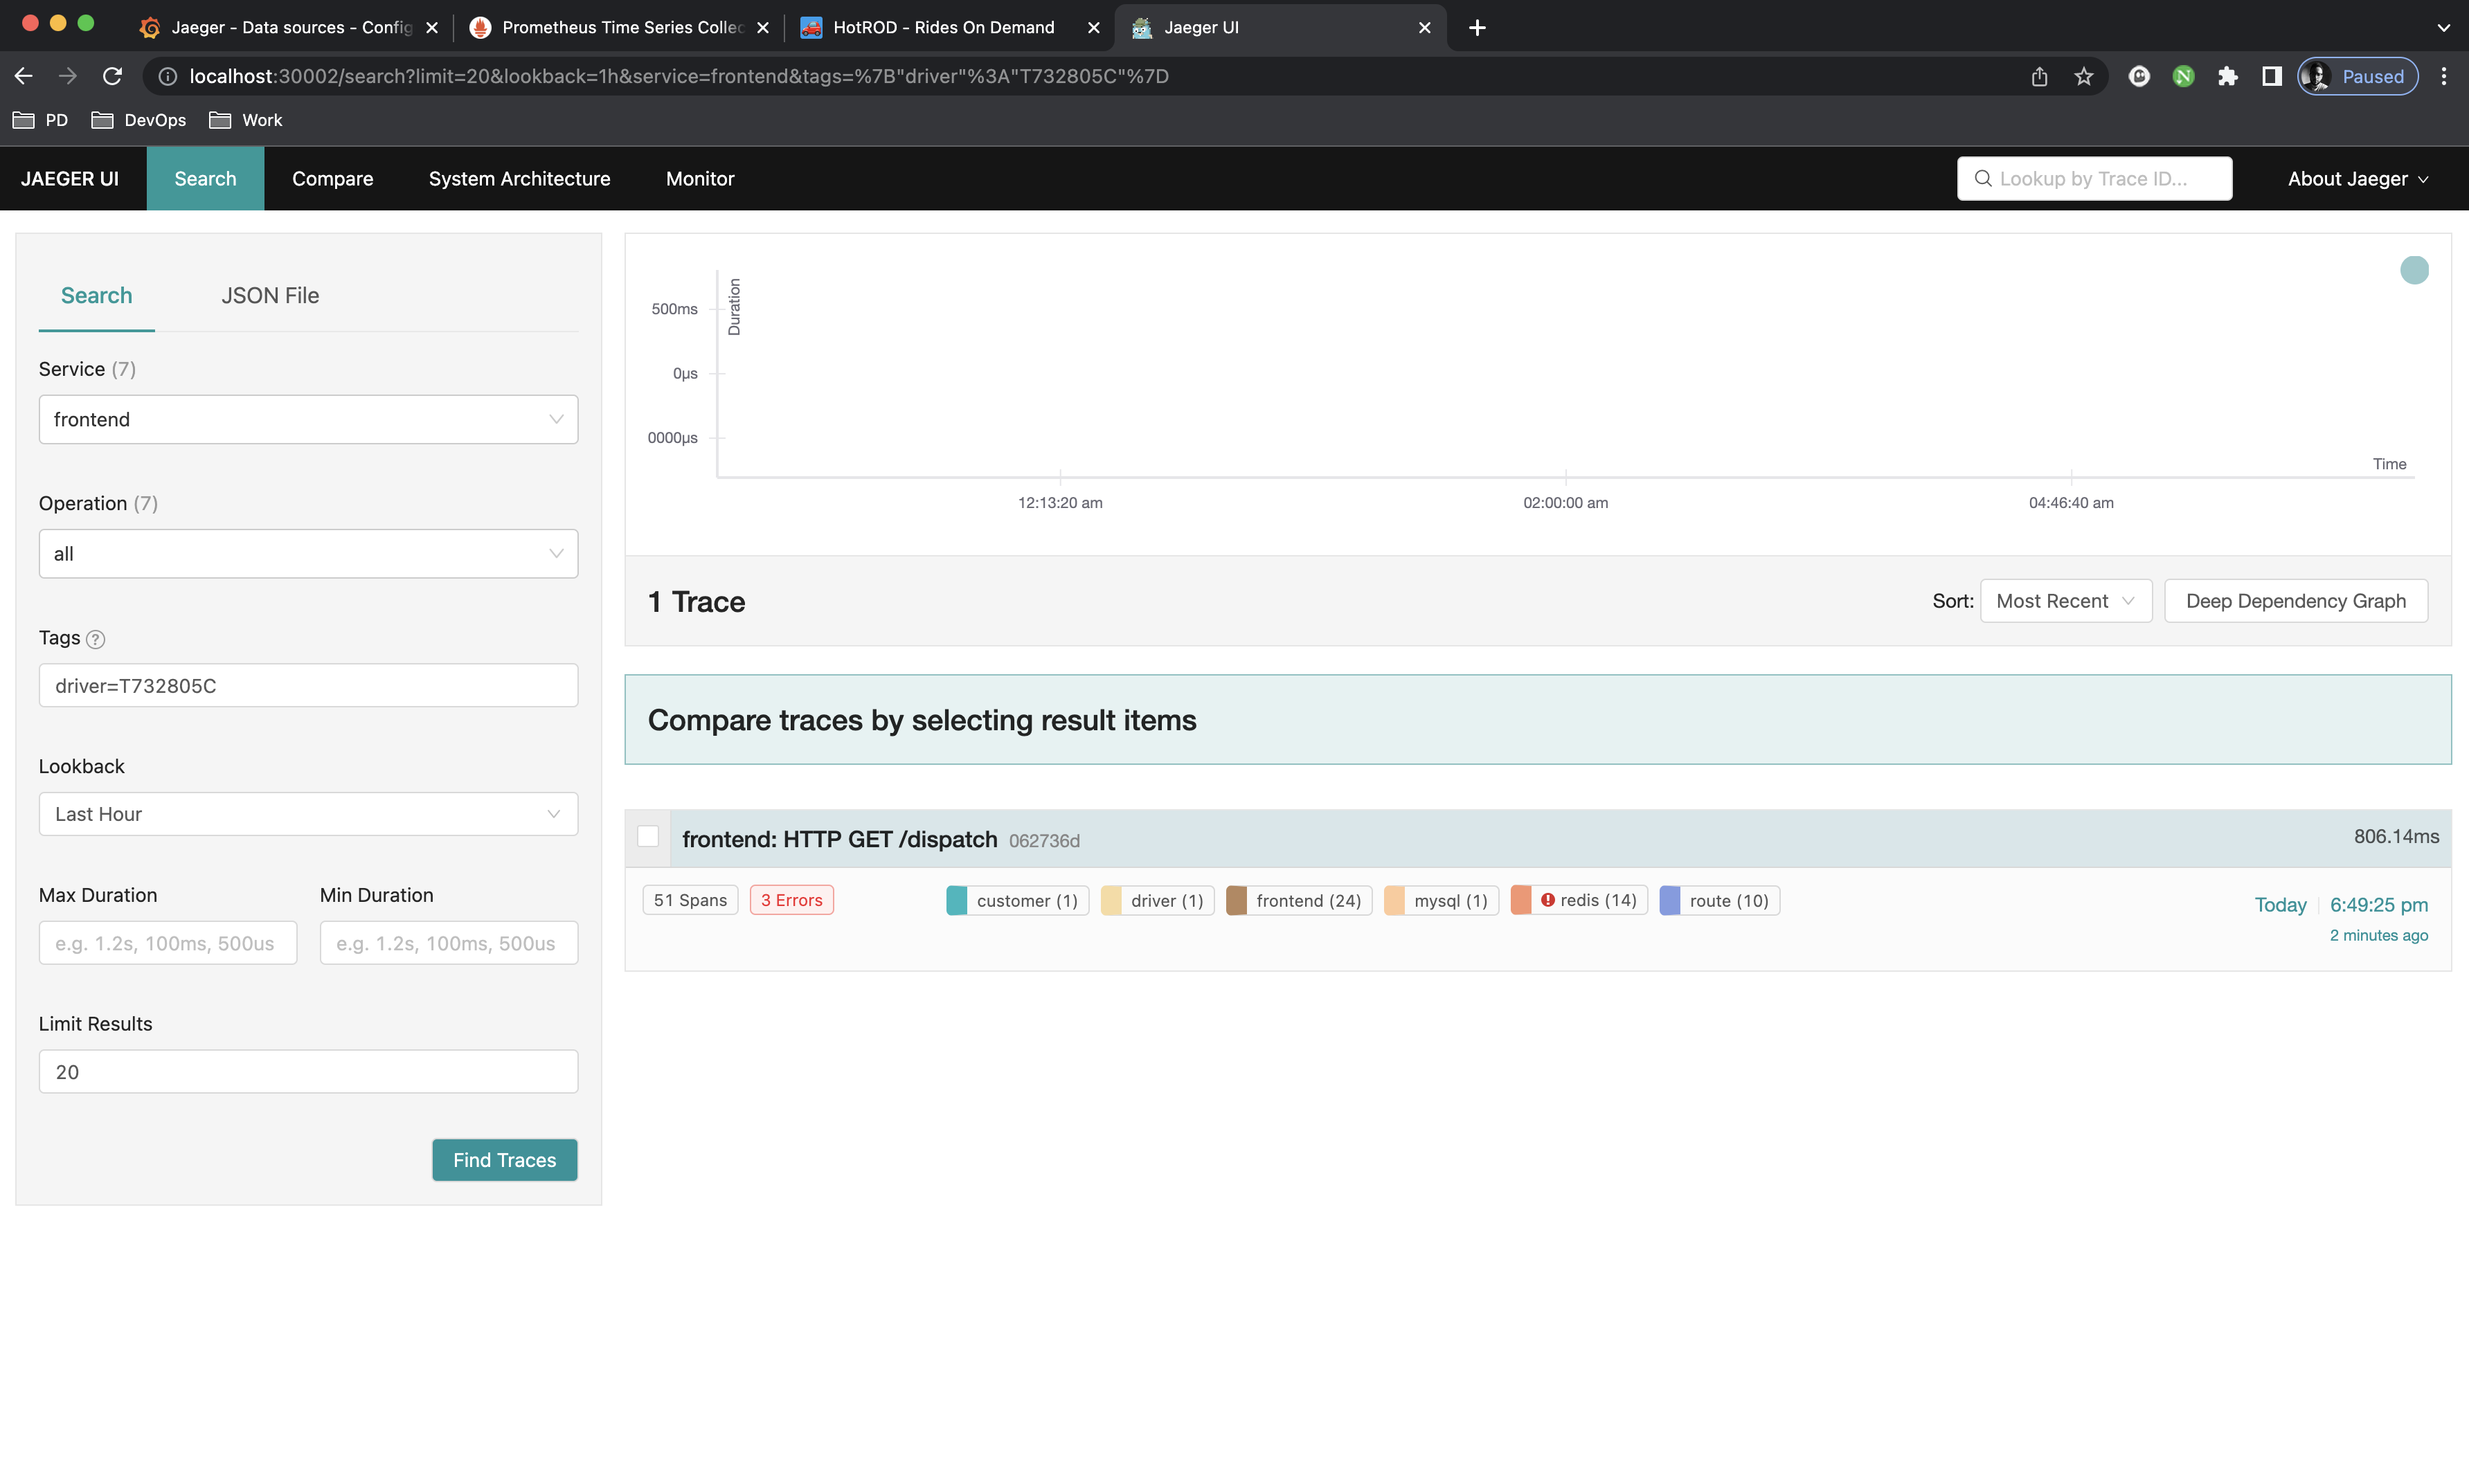 The link will redirect you to
 localhost:16686 which is jaeger-query actual port but remember, we have it exposed on 300002 on our local machine, so change the port only. Now you can see the trace for the dispatch initiated from the frontend service. Feel free to look around
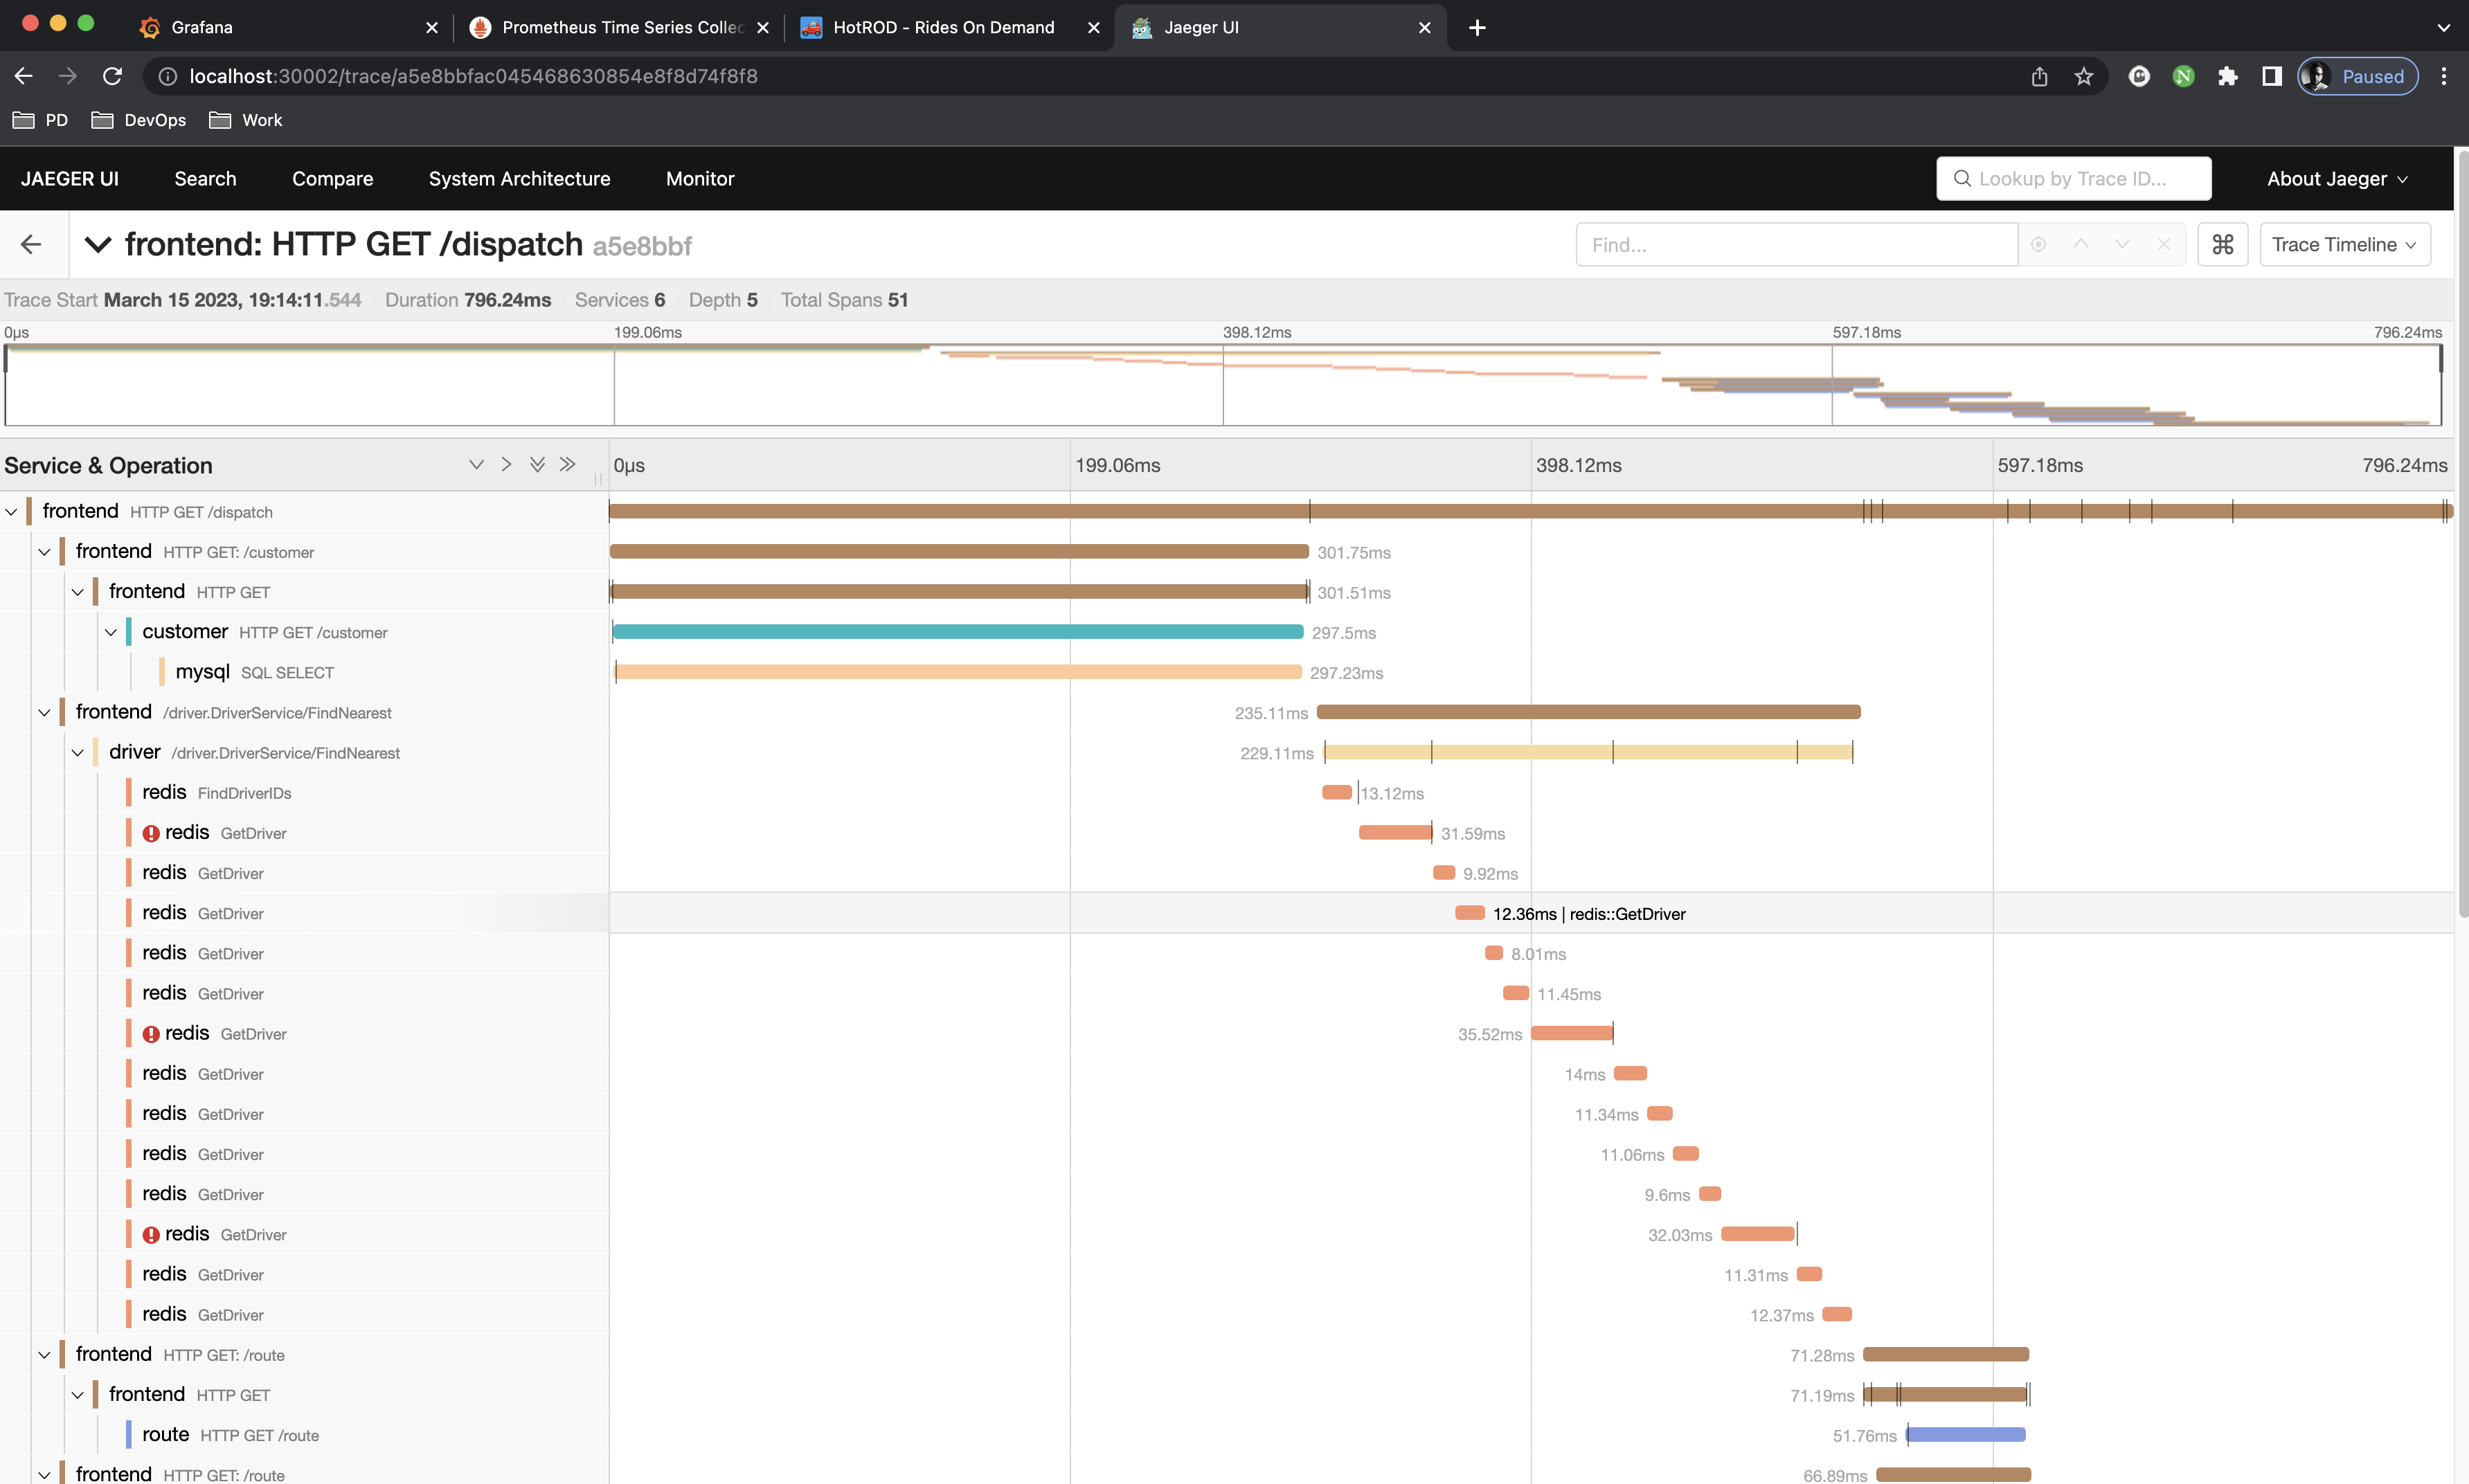 This is what the span looks like. Return to hotrod app and trigger a lot of random simultaneous dispatches
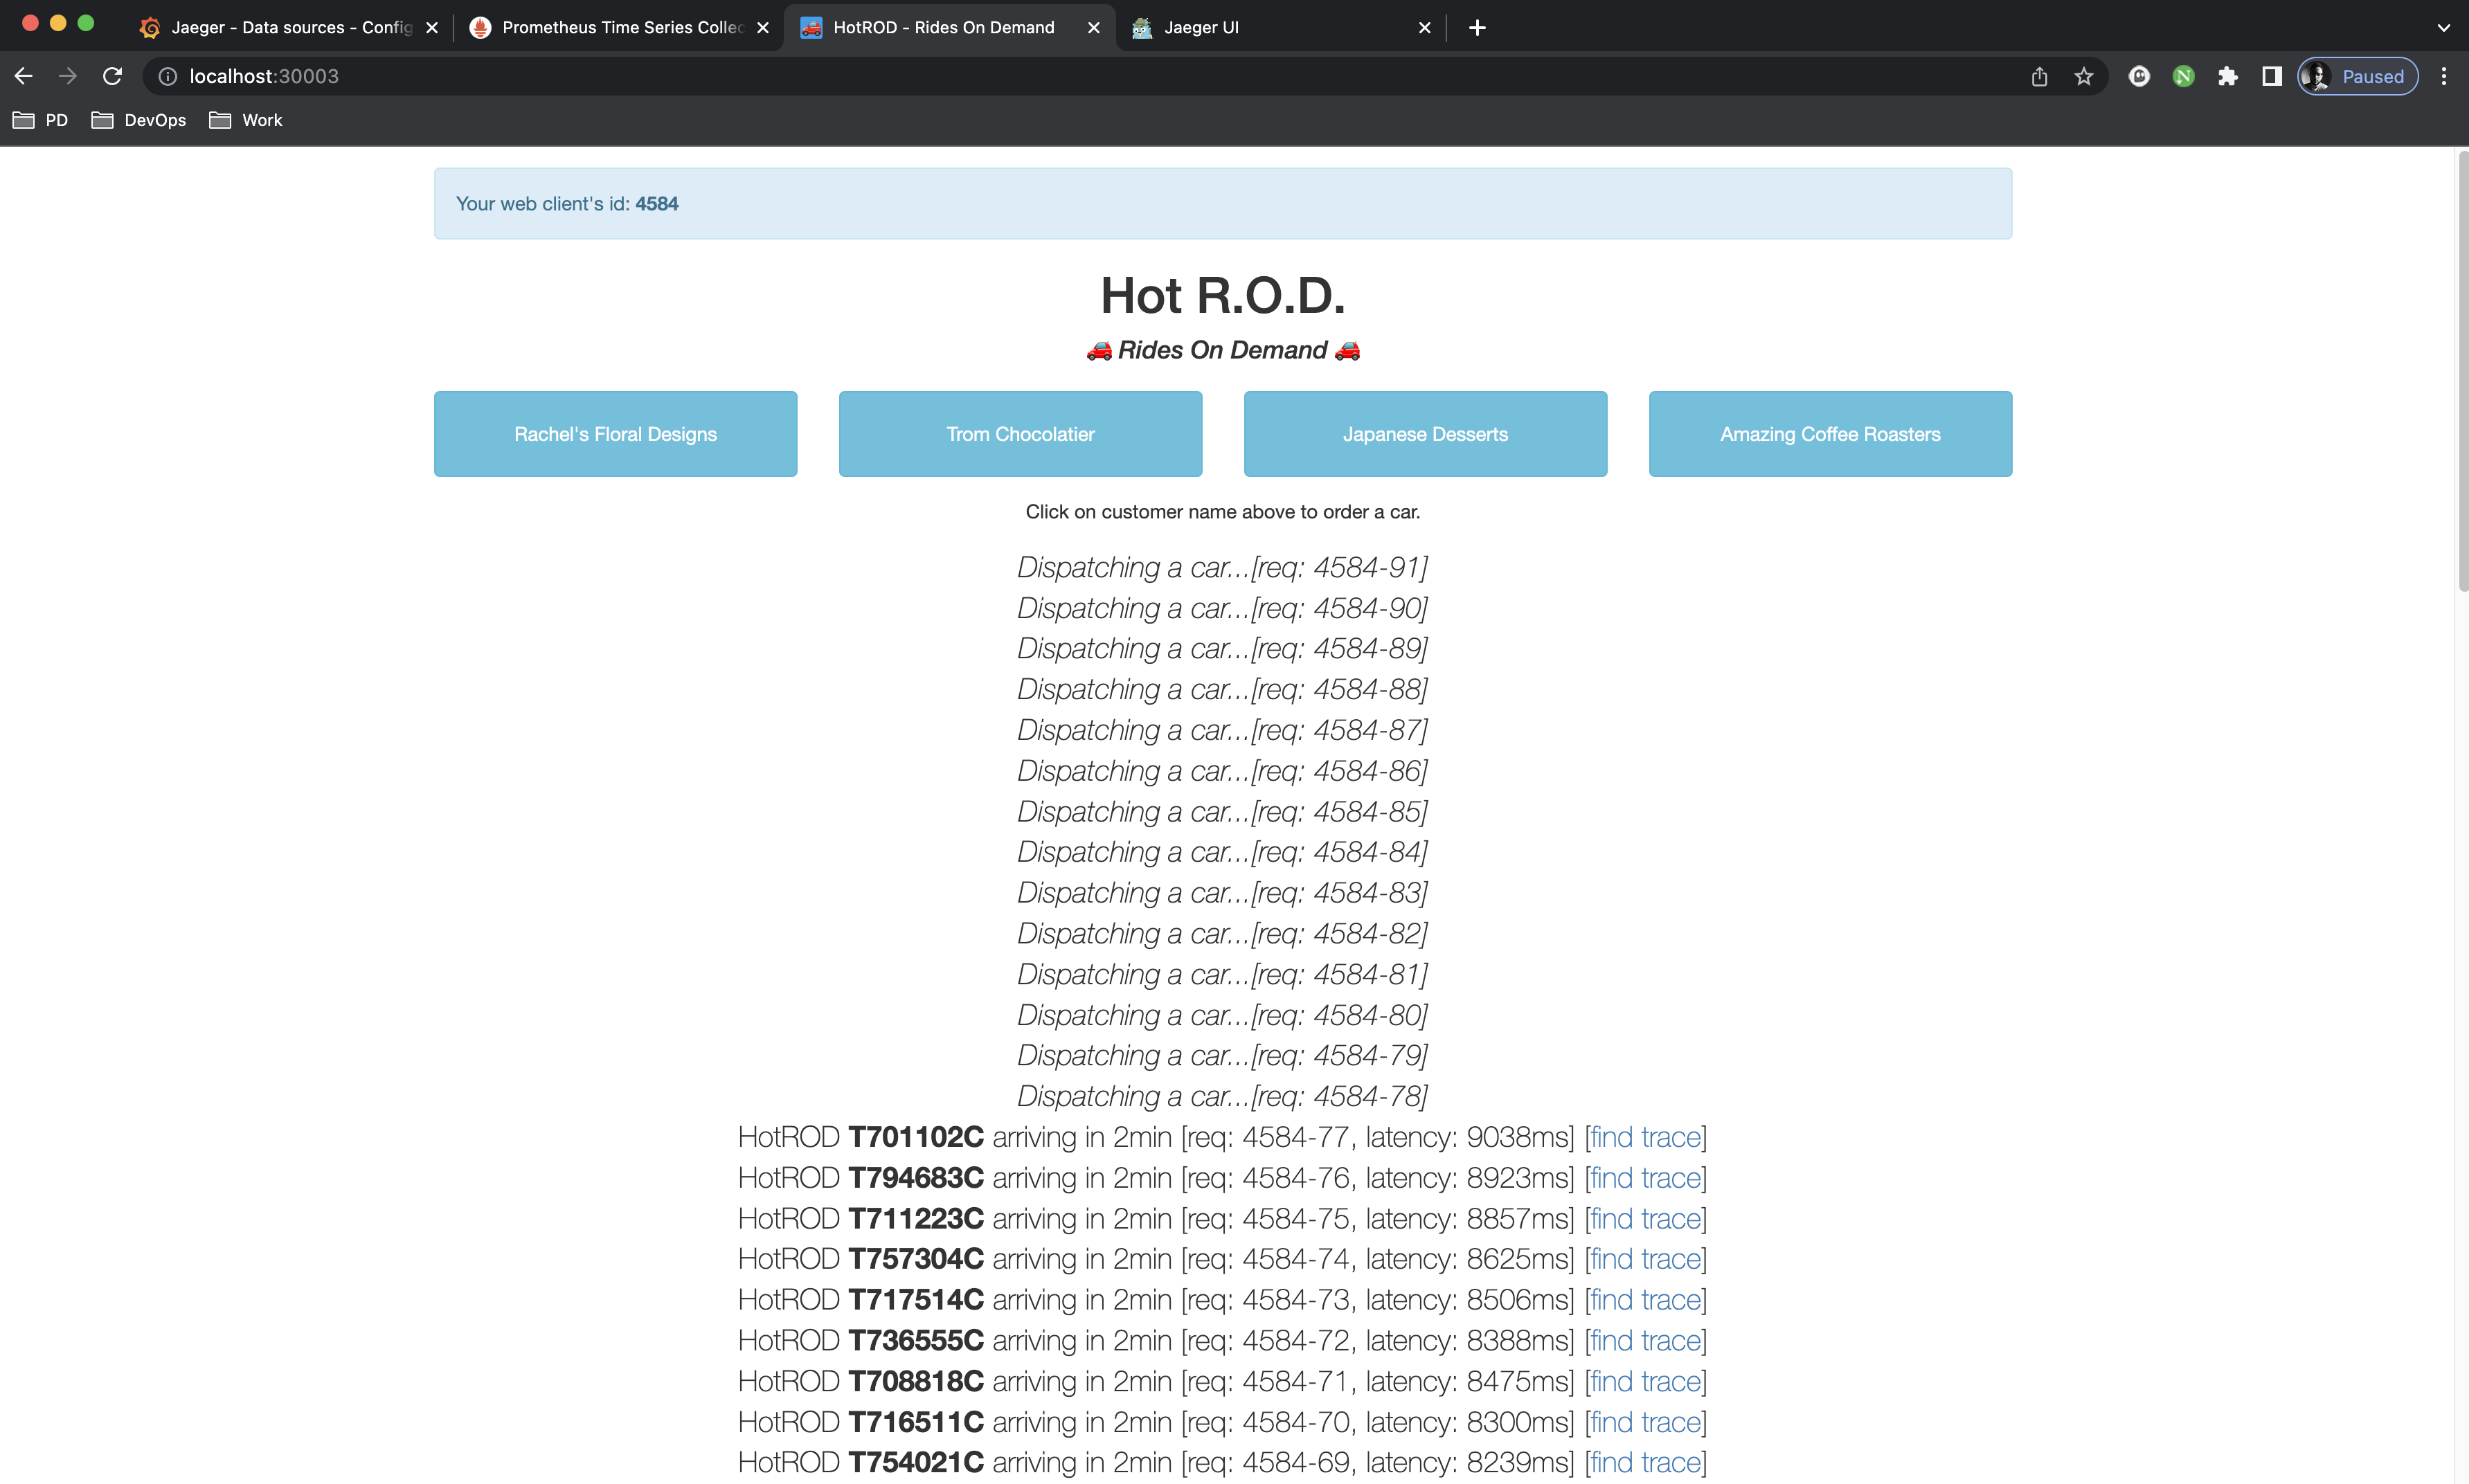 Click as many times as you can to collect some data. Now go back to
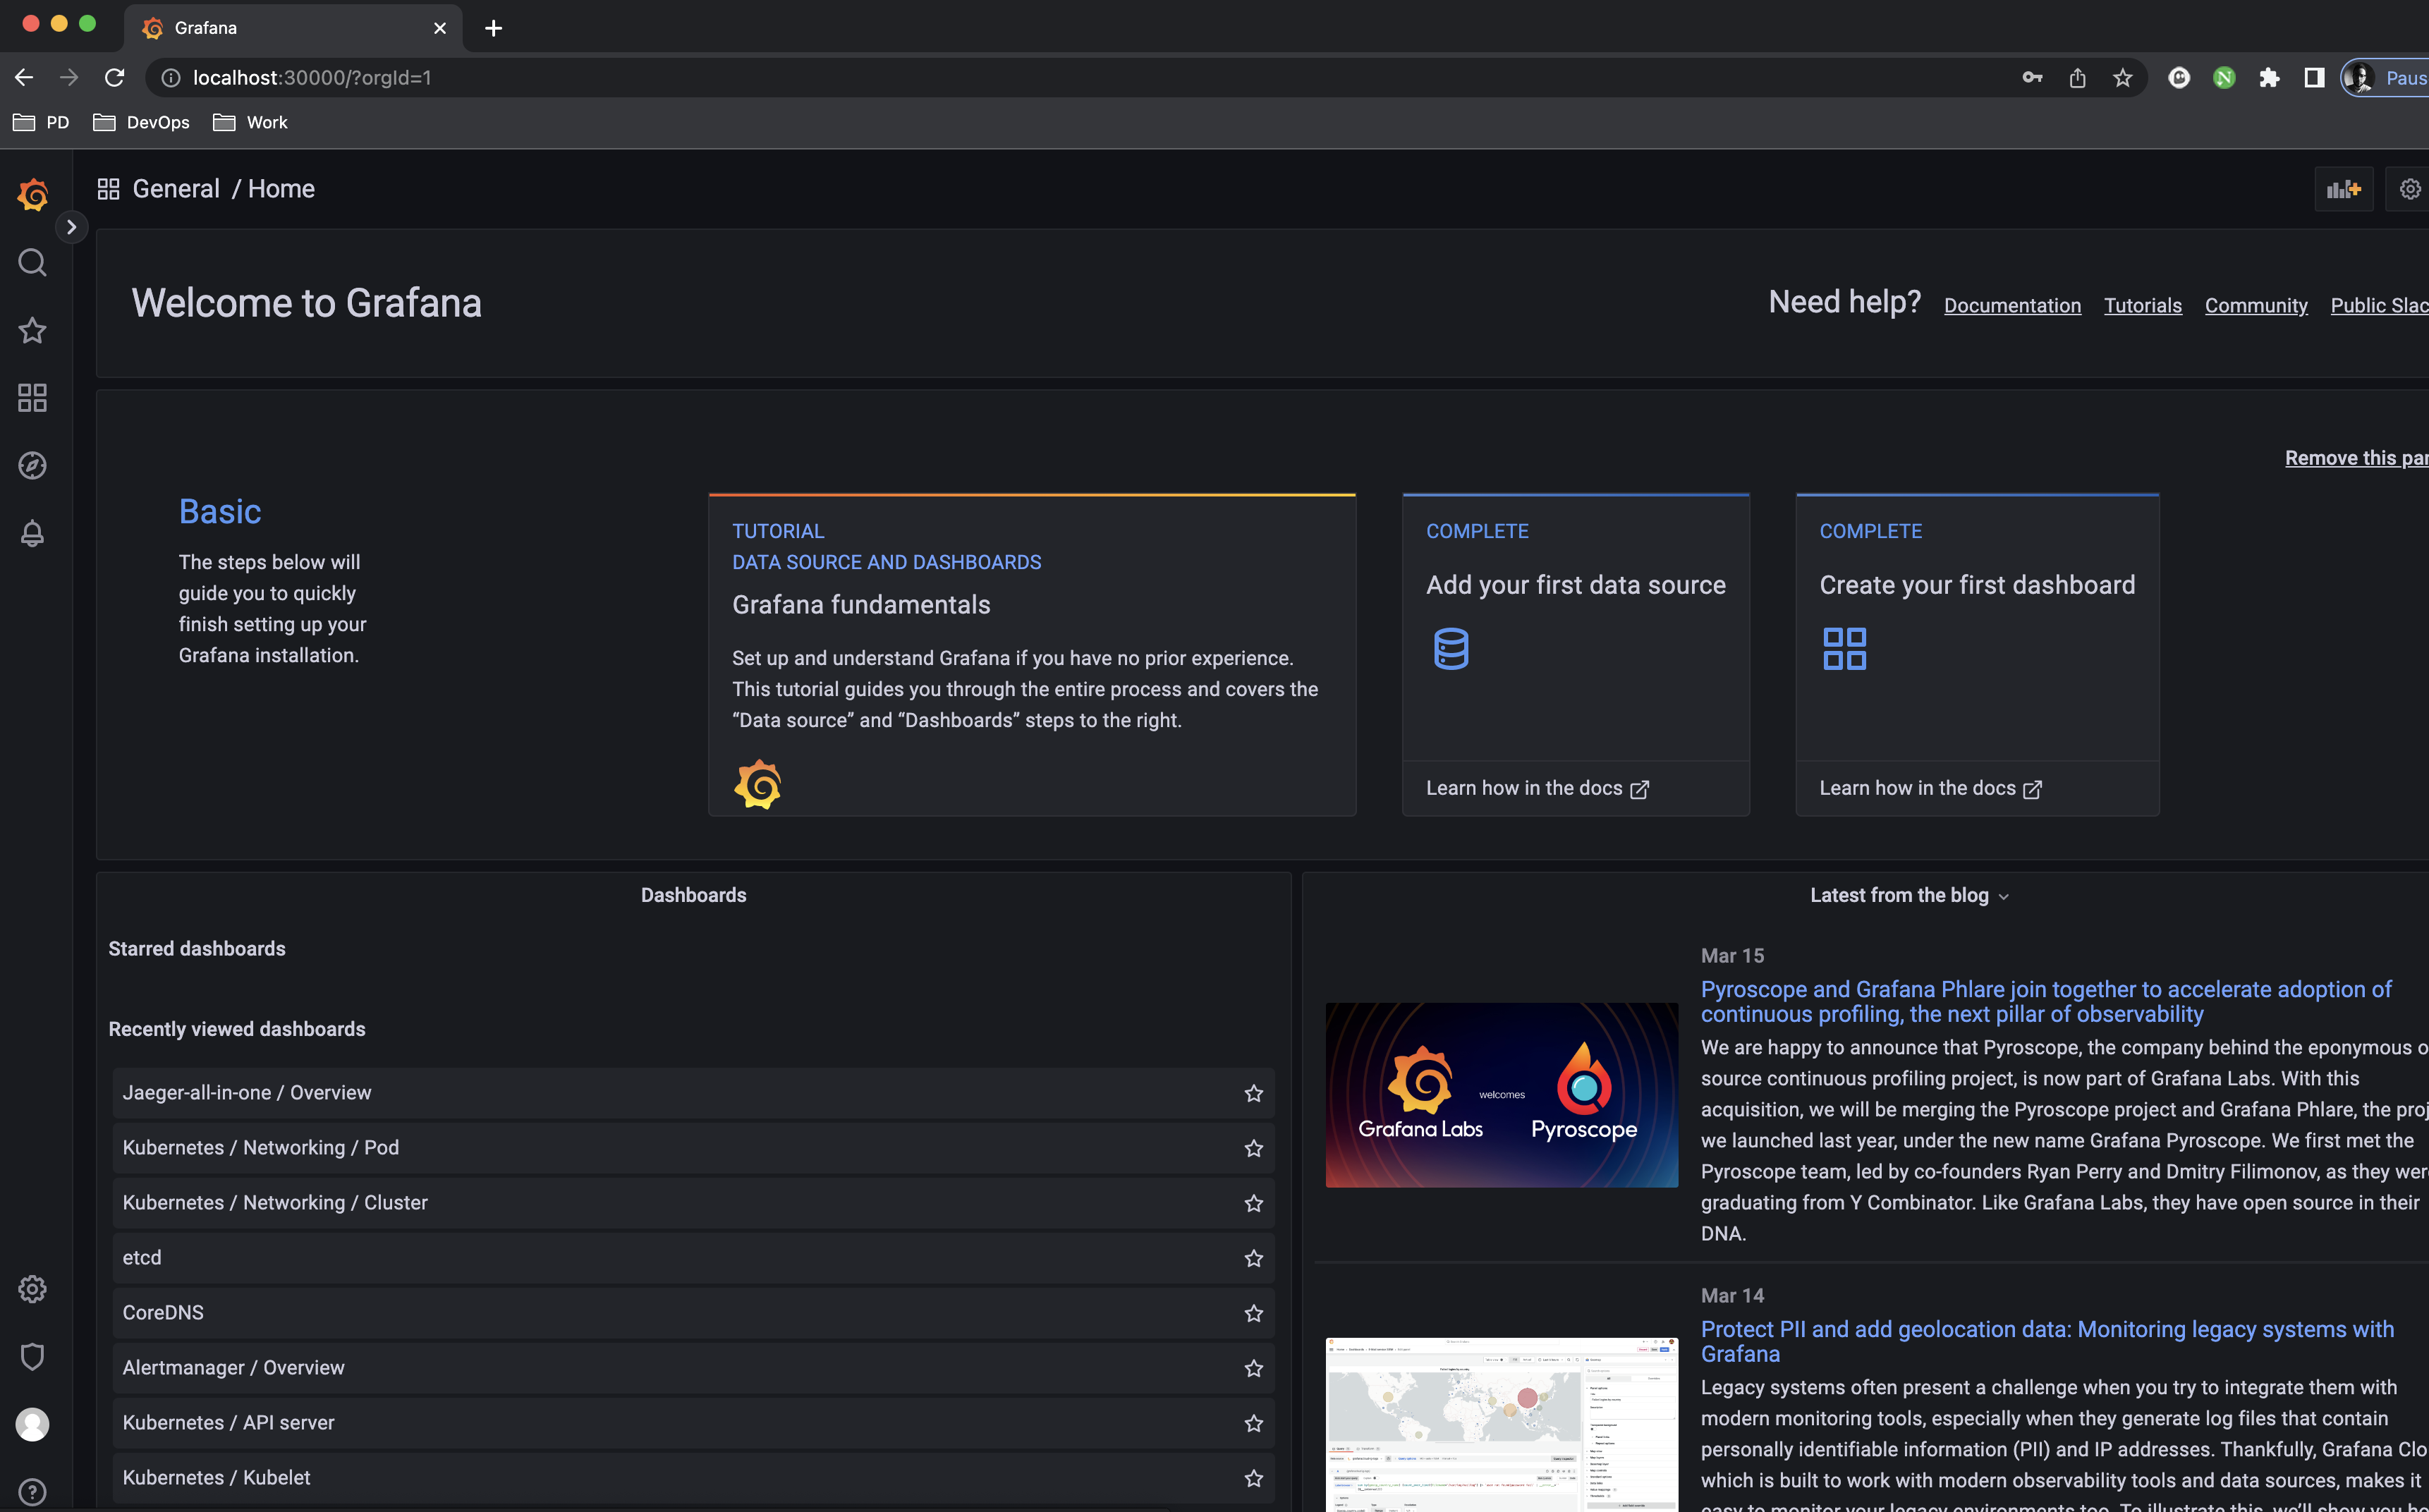
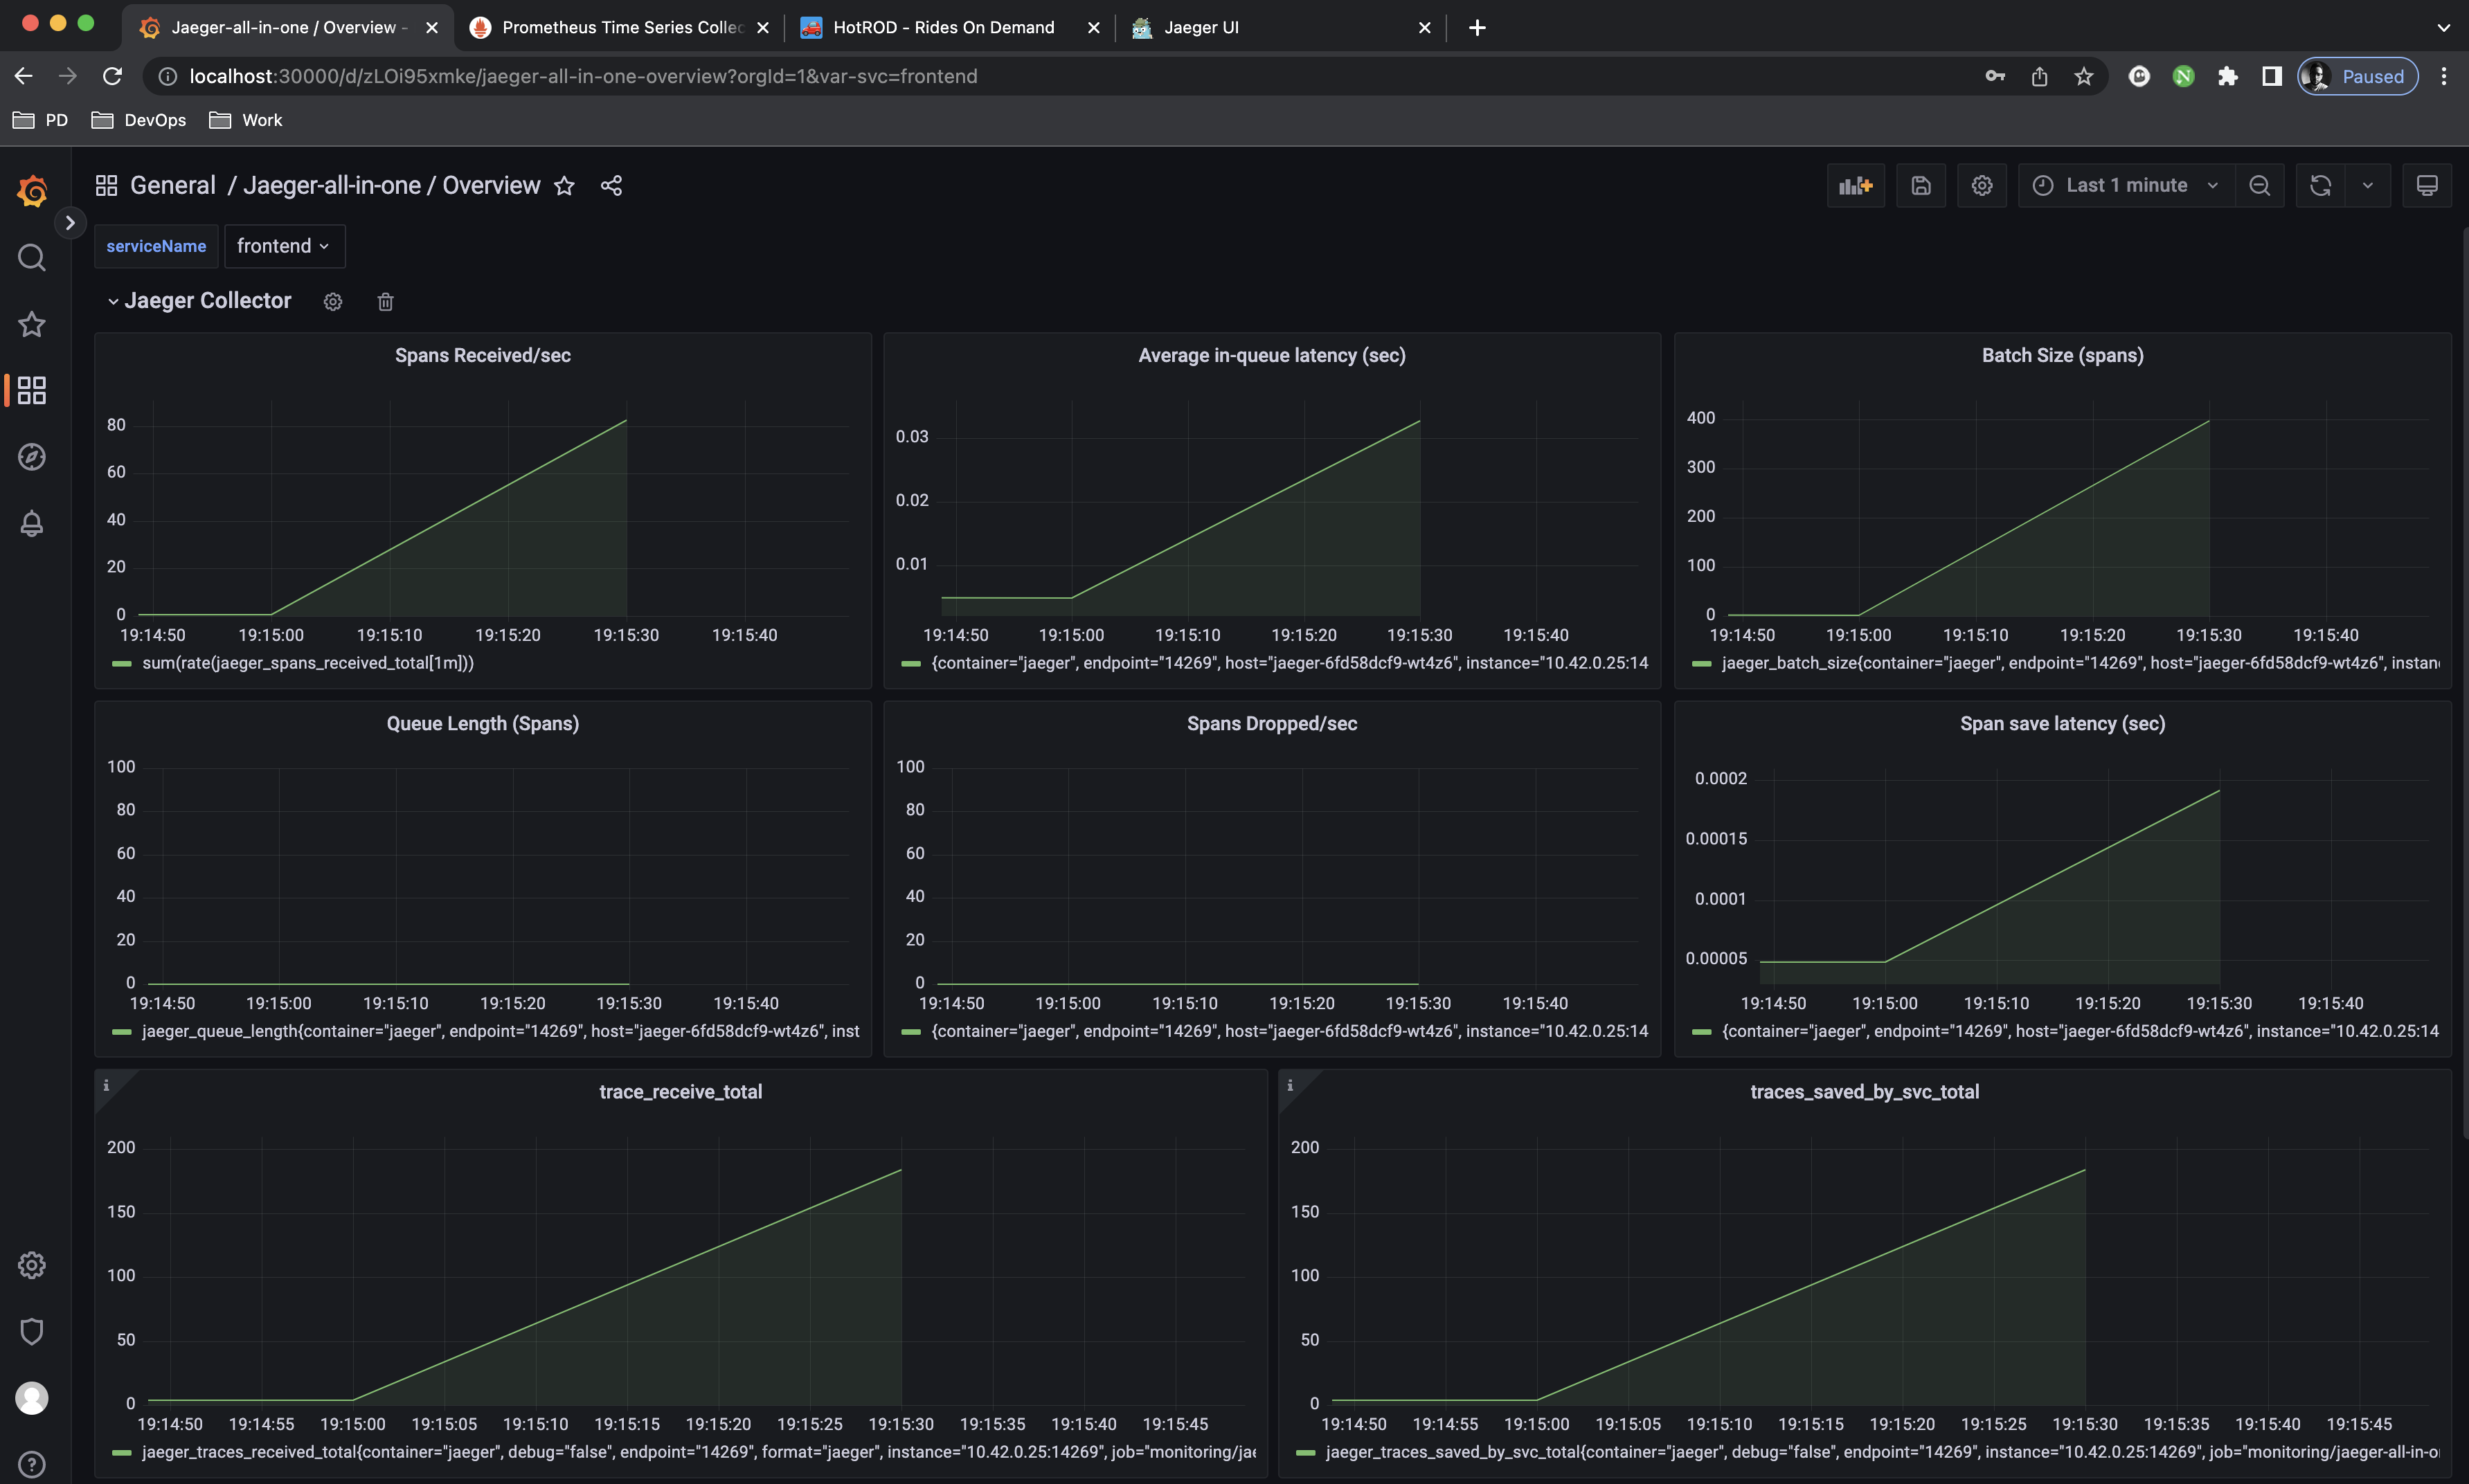
 Grafana at http://localhost:30000 and hit the dashboards
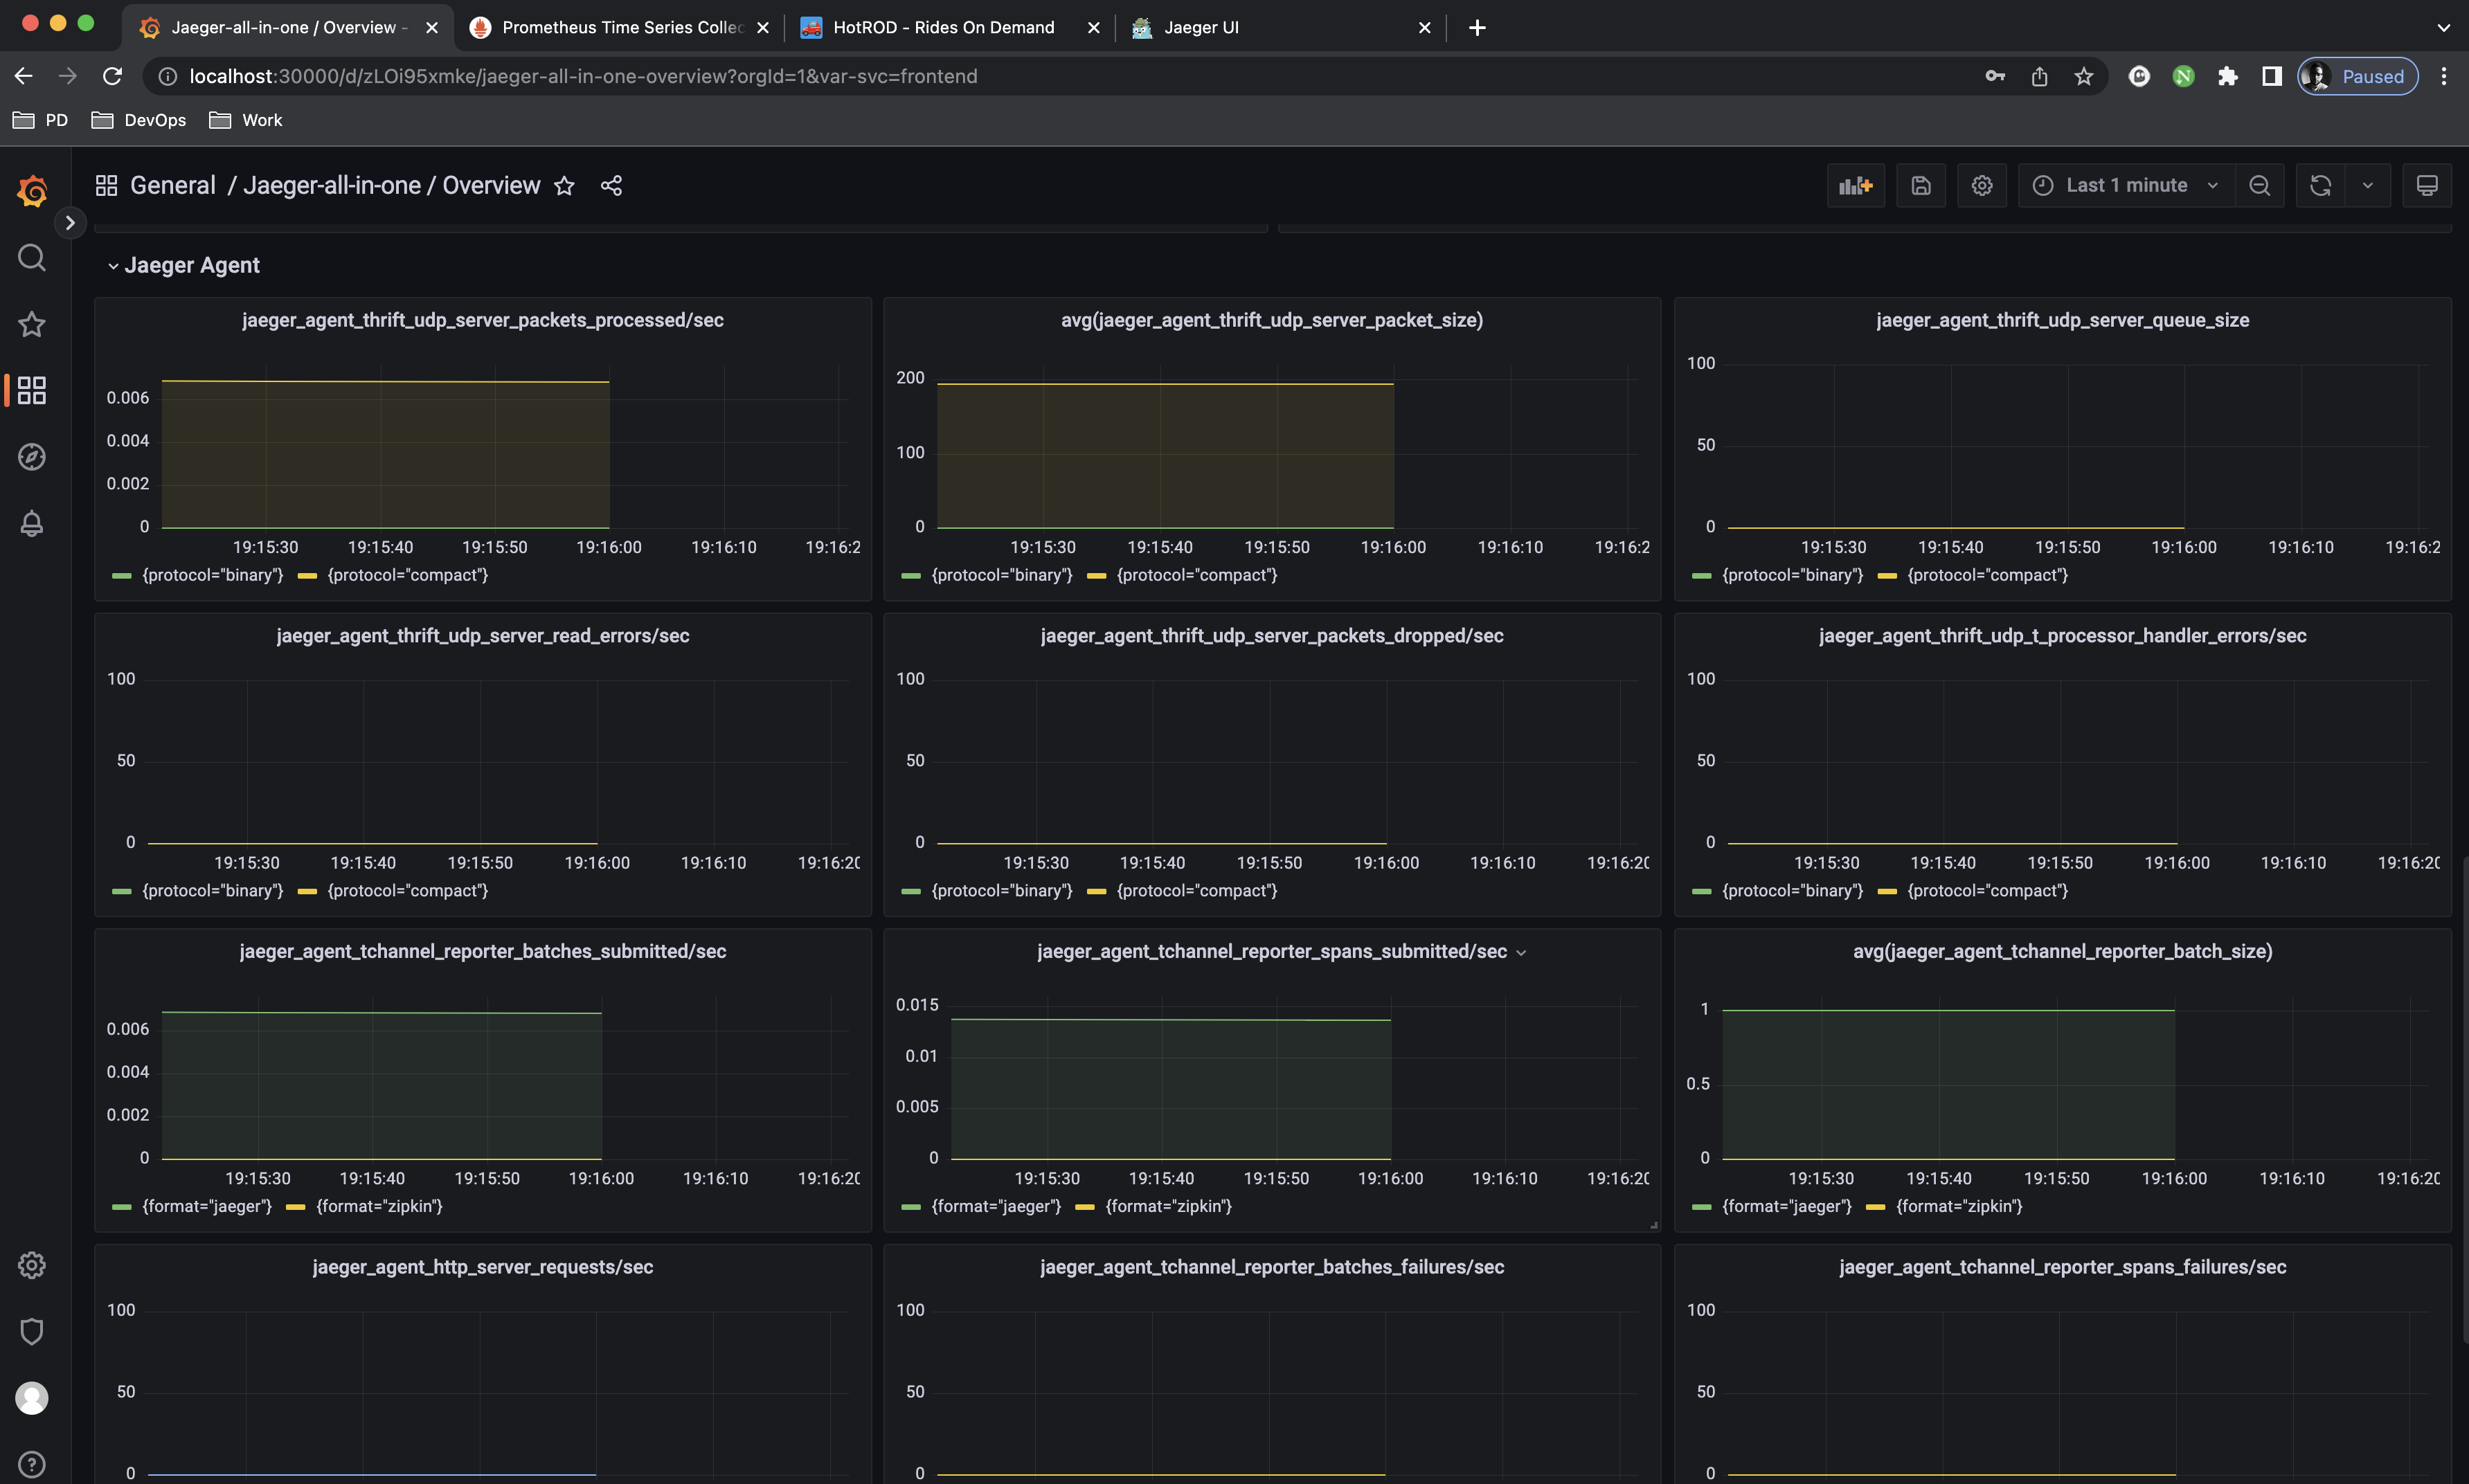
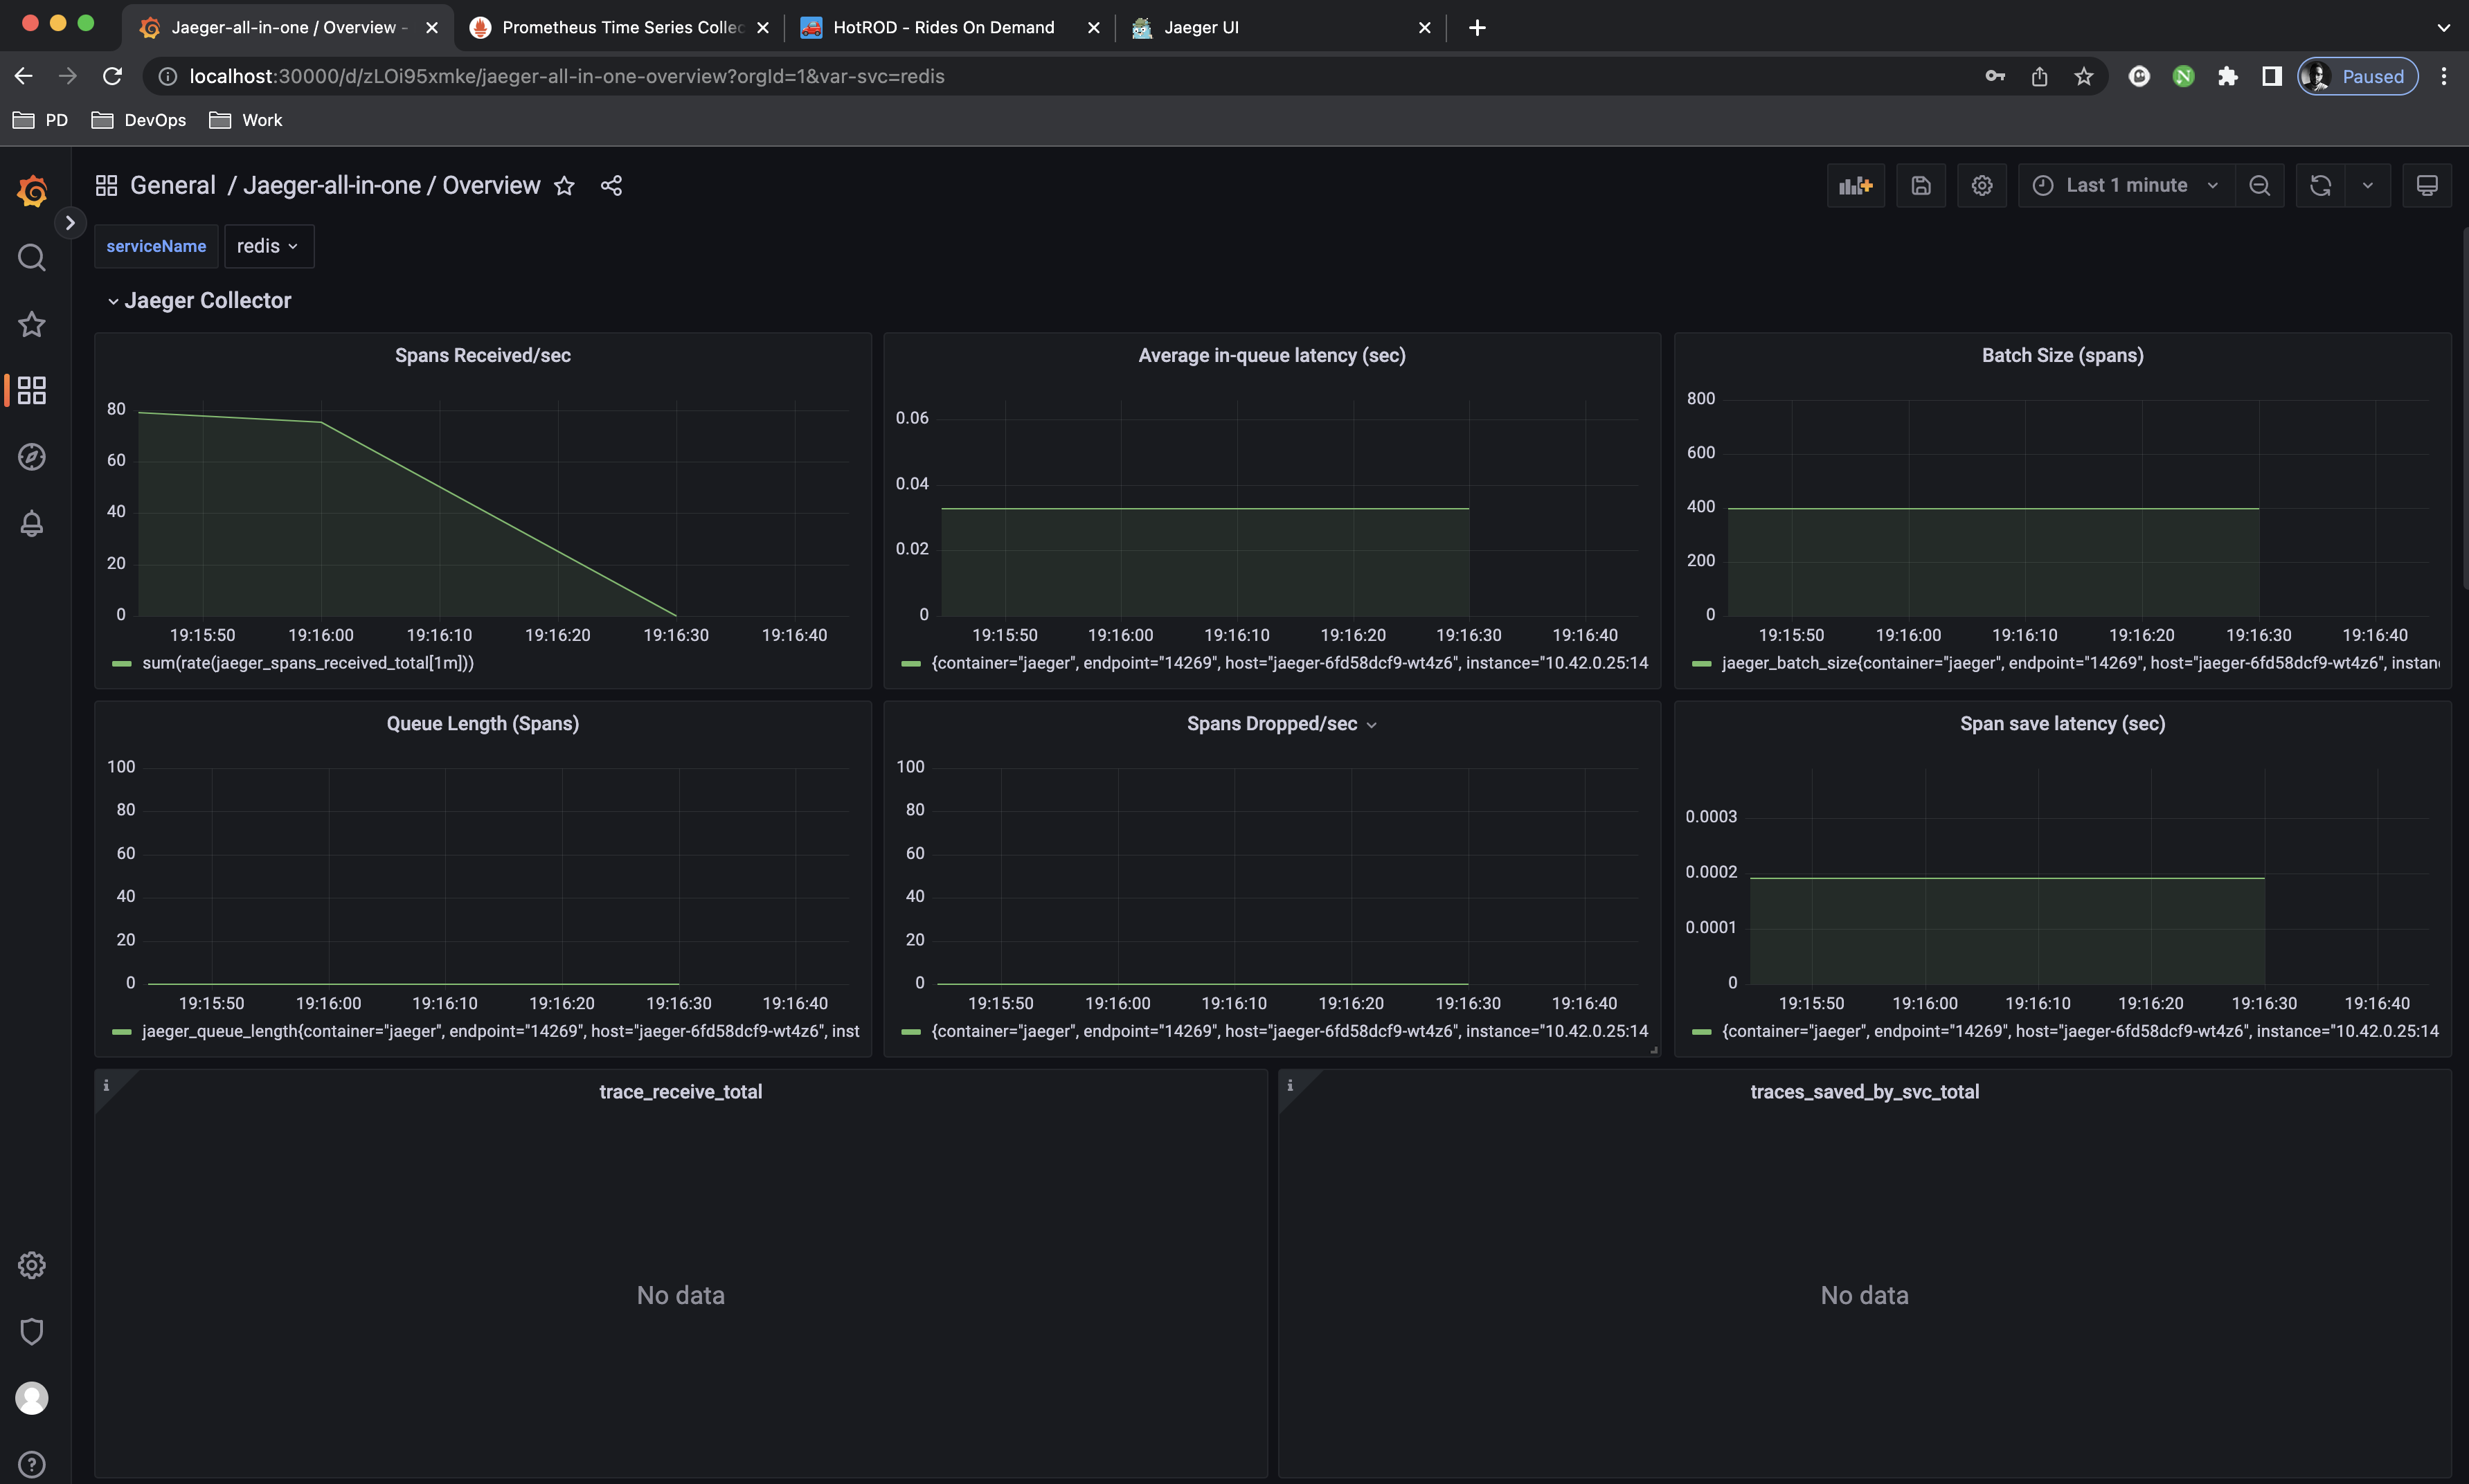
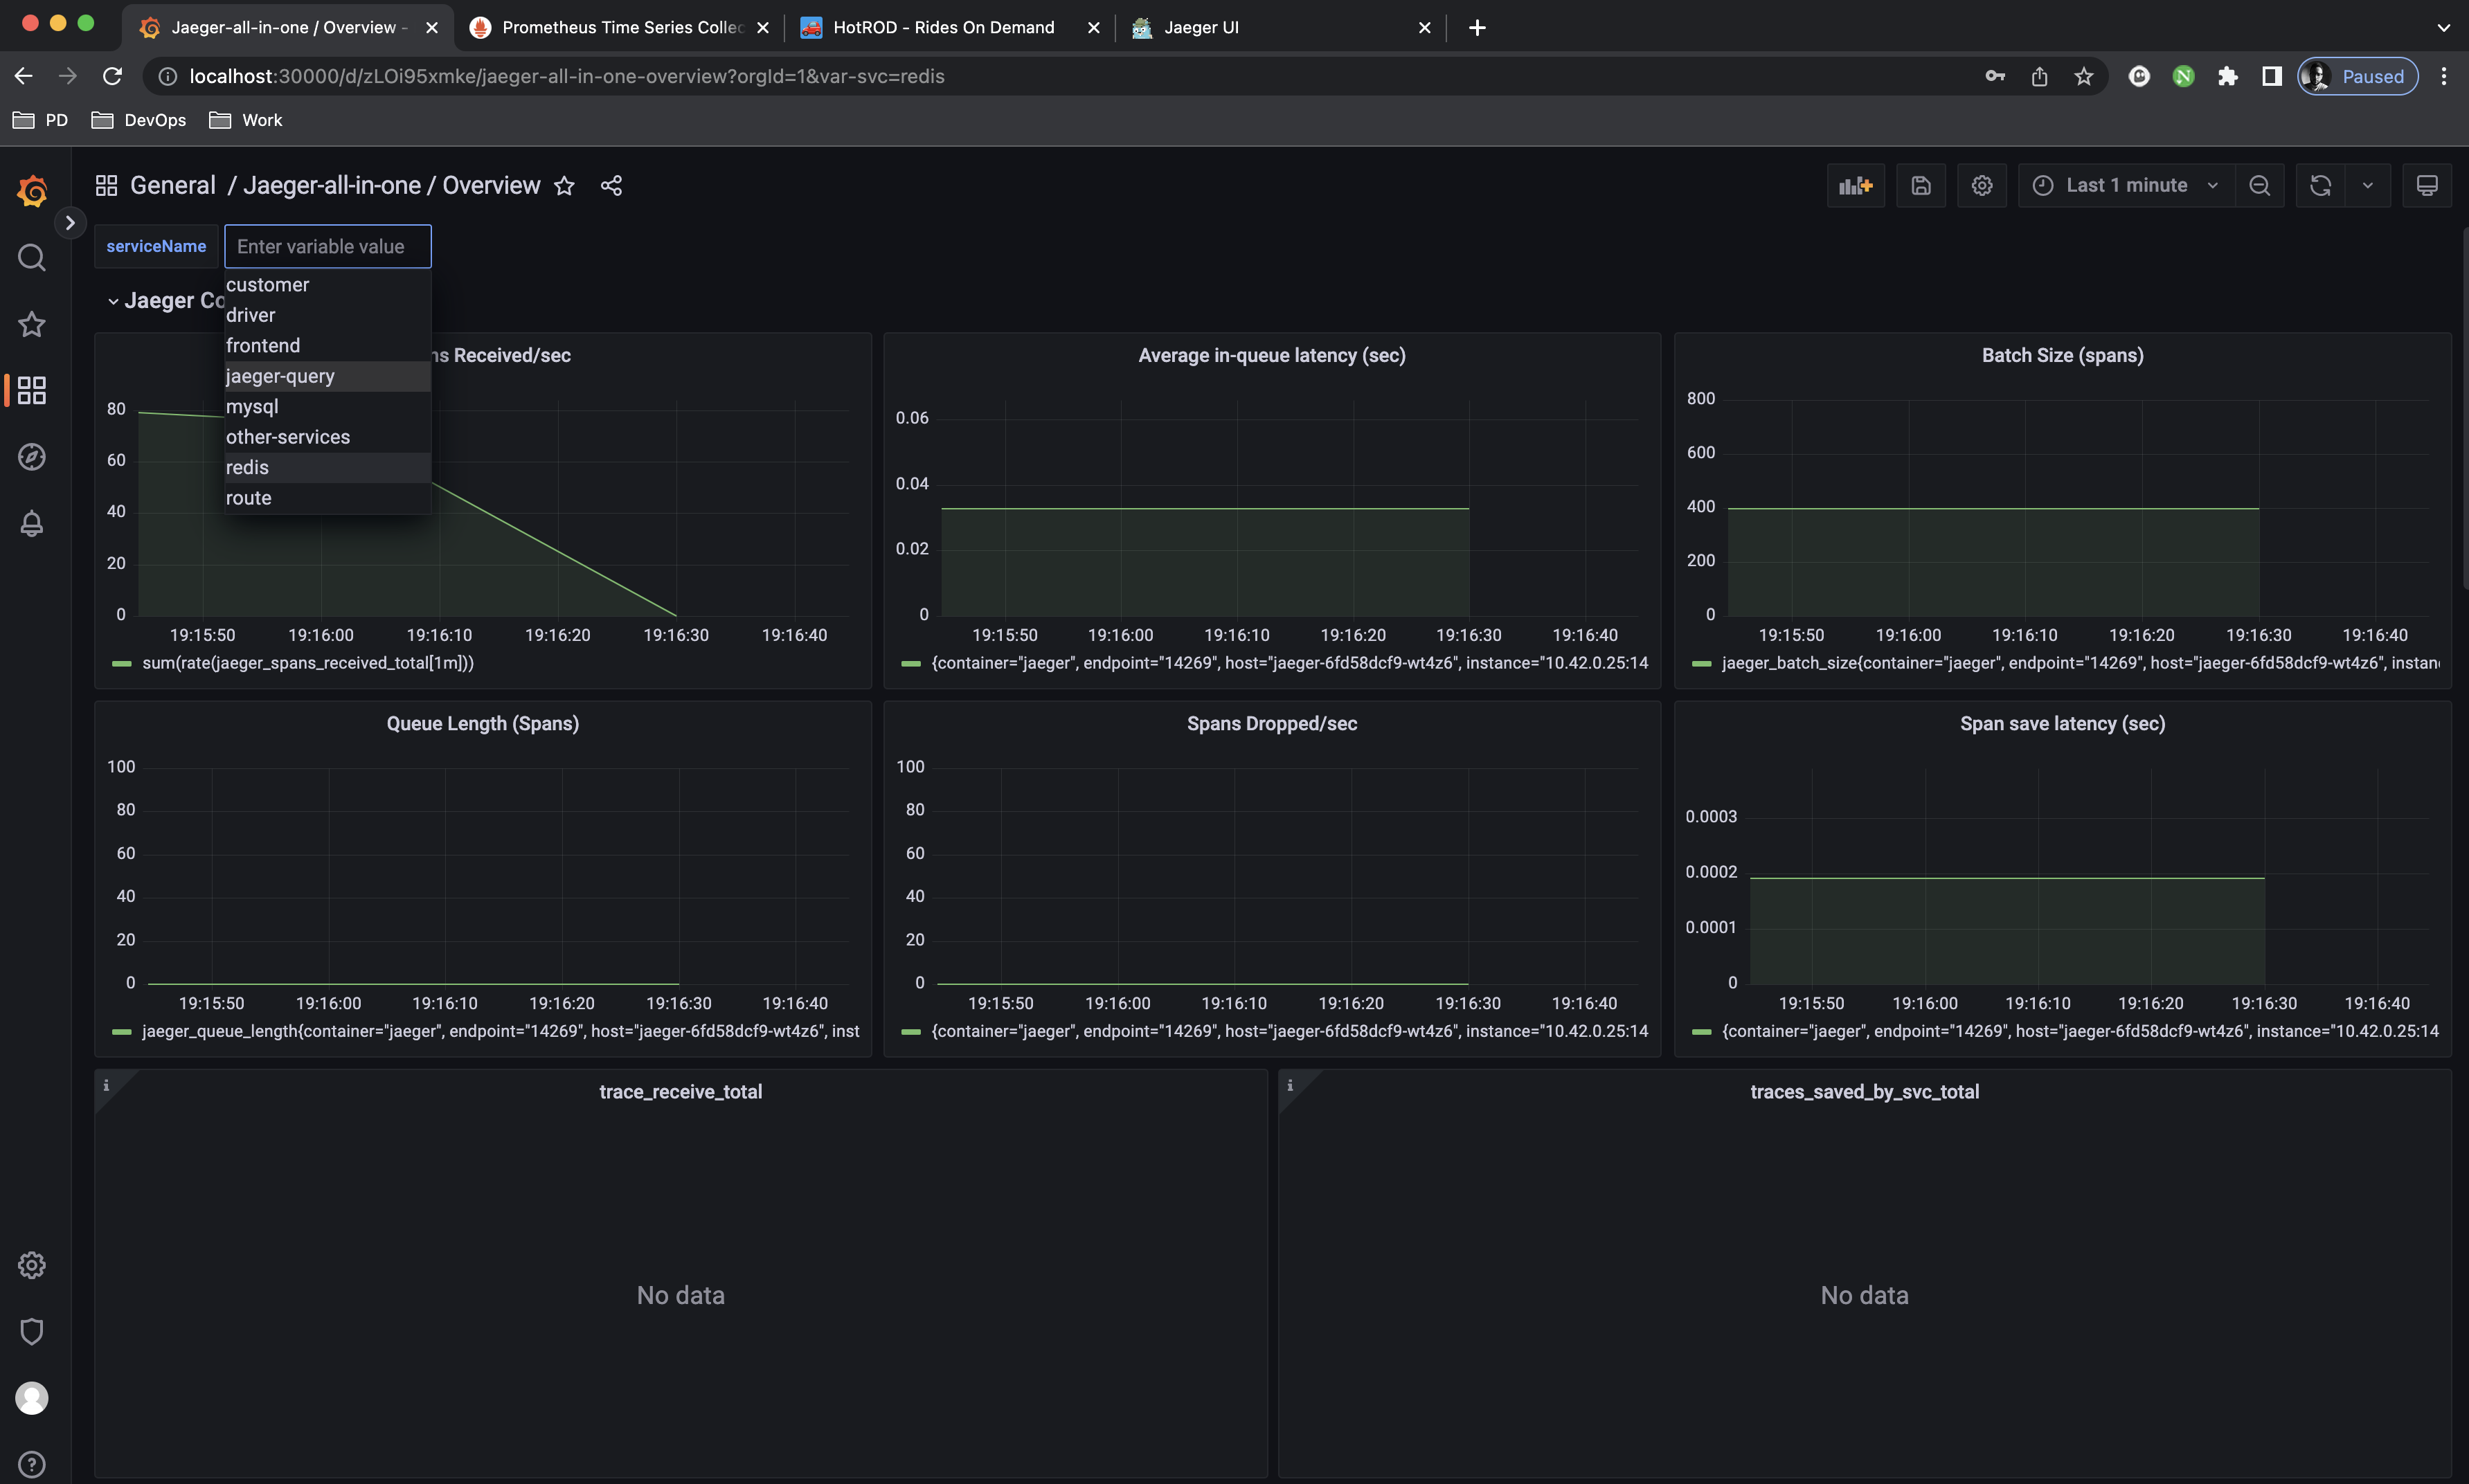
The setup has provided a Jaeger-all-in-one / Overview dashboard to give us insights on how Jaeger is actually performing:
Congratulations! you have provisioned the infrastructure succesfully. Feel free to play around. Now you are ready to install the Python application, but first you need to remove the hotrod application alongside jaeger-all-in-one instance or rmeove hotrod only as the Python application will use the jaeger instance in the default namespace.
To remove hotrod application run the following:
$ kubectl delete svc hotrod hotrod-external; kubectl delete deployments hotrod

service "hotrod" deleted
service "hotrod-external" deleted
deployment.apps "hotrod" deleted
⚔️ Developed By
Shehab El-Deen Alalkamy
📖 Author
Shehab El-Deen Alalkamy
