owid-grapher

This is the project we use internally at the University of Oxford to create embeddable visualizations for Our World In Data. Note that it is not yet a mature OSS project and may be difficult to apply elsewhere as a full package. That said, you are very welcome to read and reuse any of our code!
An example of what this can make (click for interactive):
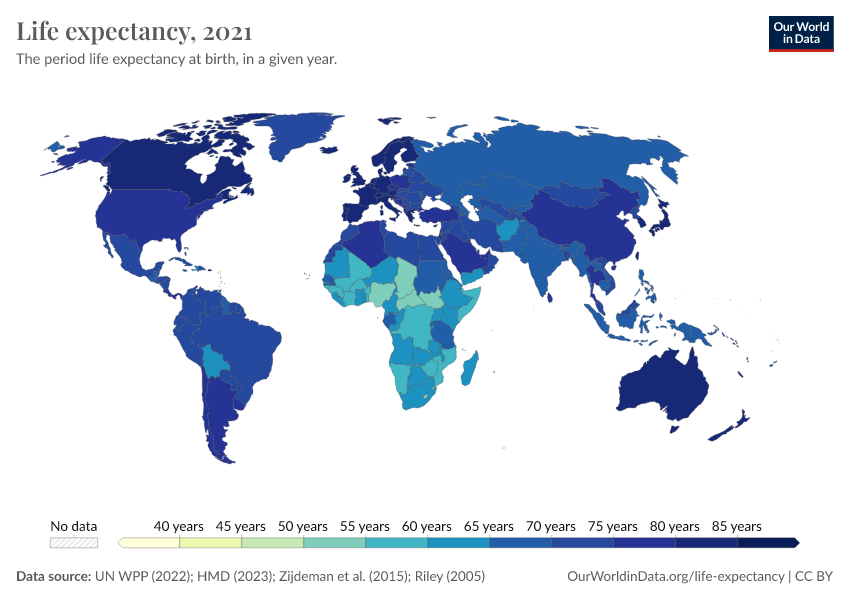
One of the neat things owid-grapher can do is automatically export an interactive JS visualization as a static PNG or SVG using headless chrome, which is how the above image works.
Initial development setup
The grapher is a Python + JavaScript hybrid project, using Django and webpack. You will need: MySQL, Python 3.6+, and Yarn.
Running pip install -r requirements.txt and yarn install in the repo root will grab the remaining dependencies.
For static image exports, you will also need a recent version of node and Chrome 59+. These are not required for the rest of the codebase to work.
Database setup
An initial test database can be imported from owid_grapher/fixtures/owid_data.sql. For example, if your database is called grapher:
mysql -u root -p -D grapher < owid_grapher/fixtures/owid_data.sql
Now copy owid_grapher/secret_settings.py.template to owid_grapher/secret_settings.py and fill in your database details.
Run yarn dev and head to localhost:8000. If everything is going to plan, you should see a login screen! The default user account is "admin@example.com" with a password of "admin".
Architecture notes
Since this project is used in production and undergoing active development, the dependencies and code style are still in a state of flux. We eventually aim to fully migrate away from nvd3 and Backbone in favor of the more modern/faster Preact and Mobx. New code should be written using PEP 484 type hints and TypeScript.
About
owid-grapher was originally created by Zdenek Hynek for Our World In Data. It is currently being developed by Jaiden Mispy and Aibek Aldabergenov with design assistance from Max Roser and the OWID research team.