In today's society, the use of social media has become a necessary daily activity. For companies and organizations around the world, monitoring social media has become mandatory. It is an essential tool for innovation and marketing. Its benefits range from the ability to get instant feedback on products and services, allowing better relations with end users and customers, provide a means to increase user satisfaction very quickly, and keep up with the competition by detecting and exploiting opportunities that the competitors may be missing.
The Social Media Accelerator provides the skeleton for building a Social Media monitoring platform that helps collect data from social media sites and websites and evaluate that data to make business decisions. This document gives an overview of the solution architecture and provides all the necessary requirements and information to deploy the solution, as well as ideas and scenarios for extending the solution.
The architecture of the Social Media Analytics accelerator is depicted below. The accelerator uses the following components:
-
Data Sources: twitter and news/web articles
-
Azure Synapse Analytics
-
Synapse Pipelines: provides orchestration and automation for the different jobs
-
Synapse Spark Pool: is the engine to run the Python notebooks for querying data sources, transforming, enriching and storing the data
-
Synapse SQL Pool: stores the data model
-
-
Text Analytics: helps identify entities (persons, locations, organizations and events) and key phrases in text. It also performs sentiment analysis on the text
-
Translator: provides the ability to analyze data sources in different languages and present the outcome in both Arabic and English
-
Maps: helps precisely categorize user locations
-
Power BI: a template is available to view the insights in multiple report pages

The deployment of the accelerator is fully automated using a set of Bicep and PowerShell files. The following requirements must be in place before running the deployment:
-
A machine with Azure CLI installed - 2.31 or later
-
A dedicated resource group for the Social Media Analytics solution must be created prior to the deployment
-
The deployment must be run using an account with the following privileges:
-
is member of the tenant where the solution is deployed (not a guest user)
-
has owner permission on the resource group where SMA is deployed, and has the rights to add role assignments
-
-
Fill the parameter values for in the file SMAv2Template.parameters.json
-
location: the Azure location for the deployment, for example: westeurope or eastus. Certain locations cannot be used because of the availability of certain services required by the solution (ex: westus)
-
subscriptionId: the ID of the subscription where the solution will be deployed
-
ResourceGroup: The name of the resource group where the solution will be deployed
-
keyVaultAdministratorUserId: the ID of the user account that will manage the secrets and passwords in Key Vault. Typically, it will be the ID of the user deploying the solution. It can be retrieved using:
- Azure CLI: az ad signed-in-user show | findstr objectId
- Azure Cloud Shell: az ad signed-in-user show | grep objectId
- Azure Portal (Azure Active Directory blade)
-
company: 3 letters identifying the organization, for example: fbk
-
deploymentType: poc, devtest, or prod
-
myPublicIPAddress: the public IP address of the machine running the deployment. This IP will be allowed through Synapse firewall to later create and populate tables in the SQL pool
-
sparkNodeSize: medium
-
sqlAdministratorLogin: SQL pool administrator
-
sqlAdministratorLoginPassword: SQL pool administrator password
-
SynapseSku: DW300C
-
News API Key: can be obtained in newsapi.org
-
Twitter Keys: can be obtained in Twitter developer website
-
-
Azure Cogntive Services require to accept the terms and conditions of Responsible AI when they are first provisioned in an Azure subscription. If none of the Cognitive Services were provisioned previously in the Azure subscription, it is necessary to create a temporary cognitive service (for example text analytics) to accept the AI license terms. The service can be dropped after the creation.
-
Once the requirements are in place, the deployment scripts can be used to deploy and configure the solution.
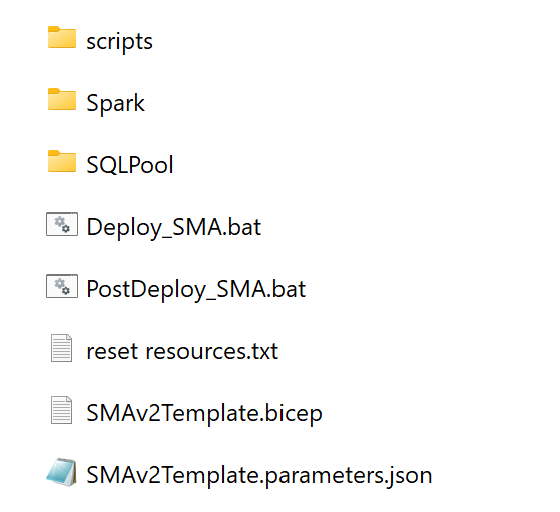
- First, start with executing the Deploy_SMA.bat, which provisions all the Azure resources, and configures Key Vault with all the secrets and keys of the provisioned services. After completion, the resources in the resource group should look like the below:

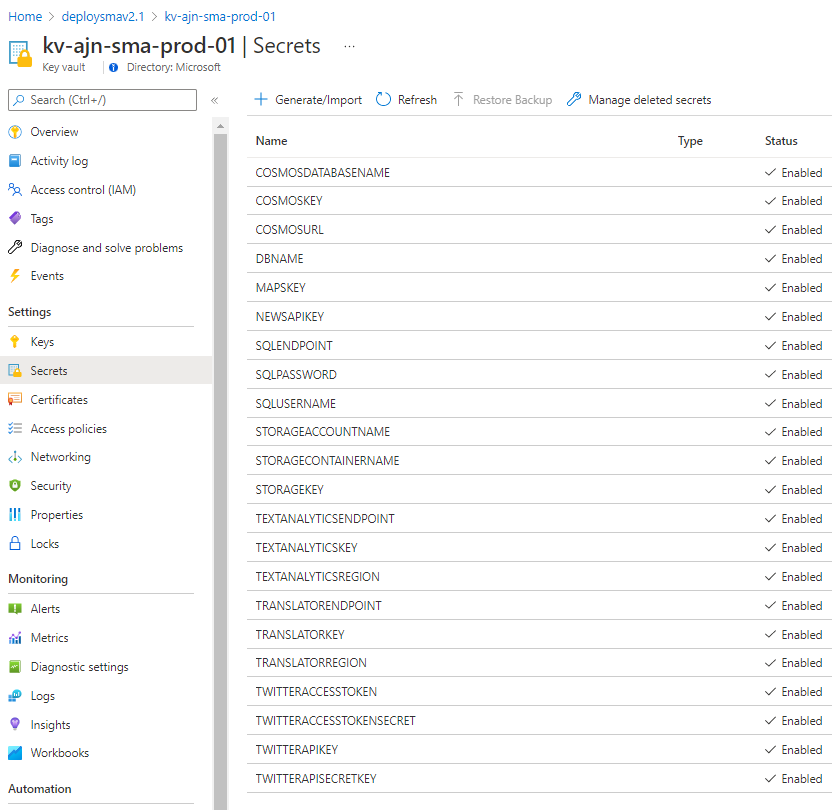
- Also, the Key Vault resource will have all the secrets configured automatically:
-
Then, execute the configure part of the automation by running PostDeploy_SMA.bat, which is a wrapper that performs the following:
-
It creates the Python notebooks in Synapse workspace
-
It deploys the database tables, views and stored procedures in the SQL Pool
-
It configures the Spark Pool cluster with the required libraries
-
It creates the automation pipelines in Synapse Pipelines and the scheduling triggers
-
The result of this step should look like the following:
Tables, schemas, stored procedures and table data Notebooks, pipelines and triggers, ready for customization deployed to SQL Pool


The accelerator comes with the specific use case of Arab Cup, and is by default using queries and search terms specific to this topic. It is necessary to customize the accelerator with the right search terms to meet with the use case in hand. The customization is performed at the pipelines' level. The accelerator uses two data sources (Twitter, and News Articles), thus there are two pipelines to customize:
News Articles Pipeline:
This pipeline is named "News Orchestrator - Arab Cup 1" and comes with multiple activities, of which two Notebook activities (highlighted in yellow), that need to be customized. Selecting each activity, and checking the Base parameters under Settings shows the query being executed. It is important to customize both the query being executed and the topic properties of each activity. The topic is used to tag the data collected so that it can later be used to group it in the dashboard. If more queries are needed, the Notebook activity can be cloned to add the query and linked to the pipeline workflow. No changes are required to the rest of the activities (starting from the Cleanup activity).

Tweets Pipeline
This pipeline is named "Tweets Orchestrator - Arab Cup 1" and comes with multiple activities, of which four Notebook activities (highlighted in yellow), that need to be customized. Similar to News Articles, selecting each activity, and checking the Base parameters under Settings shows the query being executed. It is important to customize both the query being executed and the topic properties of each activity. The topic is used to tag the data collected so that it can later be used to group it in the dashboard. If more queries are needed, the Notebook activity can be cloned to add the query and linked to the pipeline workflow. No changes are required to the rest of the activities (starting from the Cleanup activity).

Pipeline Triggers
After the queries have been added, the data collection can be started by simply enabling the triggers

A Power BI template file is available to access the insights generated from the solution, and consists of an executive dashboard, a Twitter analysis page, and a News Articles page. When the Power BI template is opened, it prompts for the data source which should be the Synapse workspace Sql endpoint. The report uses Import mode and displays 1 month of history. When publishing the report in powerbi.com, Scheduled refresh has to be configured to update the data in the dashboard. Below are screenshots of the dashboard. When opening the report using Power BI Desktop, make sure to activate the Azure Map visual in the Preview Features of Power BI Desktop options.
Executive Dashboard

Twitter Analysis

News Article Analysis

The accelerator can be extended in various ways and using numerous features that can be added to provide more functionality.
Data sources
The data sources can be extended to include more social media websites like Facebook, Instagram, Tiktok... Using a combination of Azure Eventhubs and Streaming APIs, ingestion of streaming data can be added.
CosmosDB is a component that allow great extensibility of the solution, as any news feed can integrate with the solution by dumping the data in the NoSQL database.
Additional Features
Many features can be included to provide even more insights to the end users. Enabling near real-time ingestion using data streaming can unlock capabilities such as taking fast actions based on events in social media. Also, Cognitive Services can be leveraged to perform Opinion Mining, for example tracking users' opinion on brand entities or any event organization before and after the events. It is also possible to use Graph technology to build an Influencer Network Detection system, that will detect influencers and visualize influencer's network. It is also possible to link the solution to external systems in order to perform specific actions based on pre-defined events. Also integrating the solution with a chatbot is another great way for users to access the insights provided by the solution.
Visualization
To improve the navigation of the Power BI reports and the user experience, while allowing users to browse historical data, can be achieved by adding an Azure Analysis Services tabular model layer.
An example extension of the architecture is shown below:
