WallStreetBets users played a significant role in the daily price value of GameStop stock during early 2021. WallStreetBets subreddit data will be compared with daily stock price data for 2021. Other "Hype" stocks will be included as well for reference.
I initially scraped reddit comment data using the PRAW API. Since this data had minimal structure, it was stored in a MongoDB. Although each post contained around 50k comments, it was difficult to get statistically significant data from these comments as many times it would be from a single user/bot spamming. Additionally, on the most interesting posts with 100k+ comments, PRAW API would block me from scraping completely as the request was too large. Comment scraping includes sentiment analyis on a per sentence basis. This was done using the vadersentiment code base (See citation 1). The most valuable value from the sentiment analysis output is the compound value. I summed the comments that had a compound >= .05 to be total positive sentiment and <= -.05 to be total negative sentiment per day. The sentiment analysis code proved to be highly inconsistent for the unique language used in WallStreetBets. For this reason, I did not include it in my statistical analysis.
I ultimately decided to scrape subreddit posts using the PushShiftAPI. The post titles were more consistent with less concern for user/bot spamming as they were moderated more heavily. Here I scraped The entirety of posts from January 2020 - Present and placed them in a Postgres db. This consisted of 62k rows containing stock_id mentioned, date and post message. I sorted this data by date and stock_id mentioned to get a count of each stock id mentioned per day. I then crosslisted this with scraped stock data in another postgres table. Here I related number of daily mentions of stock to its daily price. Example datasets are provided in data directory.
To get this data into acceptable statistic and plotting format, I then took the daily change of mentions and stock price. Finally I normalized both values to be plotted together.
All code is stored in src directory
- Initialization
- Call "python3 src/main.py" to run the code from the repository. If running in webscraping mode, add a 0 or 1 to the program call ex: "python3 src/main.py 1".
- To scrape data, user must* provide reddit developer key and userid, password in config.py file
- To scrape for comments, use argument '0'
- To scrape for mentions in posts, use argument '1'
- If no argument is supplied, the program will analyze data from the existing database.
- Use this docker image to create a postgres server.
- Once the database is running, call main in '1' mode to initiate the database with psycopg2
- For comment scraping mode, ensure this container is running on your computer
- Once the database is running, call main in '0' mode to initiate pymongo with database
- User mode
- The program will request user to input a stock to analyze in symbol form
- The program will plot insights on stock
- The program will request user to either input another stock symbol or type 'q' to quit
- After 'q' is typed, program will output resulting statistic and p values for tests done, then accept or reject Null Hypothesis for each stock
- Null Hypothesis: Probability of no correlation between number of stock mentions and GameStop stock price per day
- Alternate Hypothesis: Probability of statistically significant correlation between stock mentions and GameStop stock price per day
- Note: Plots in readme are updated automatically when file is run and pushed to repo. This is to allow for updates to WallStreet Bets and Stock Price.
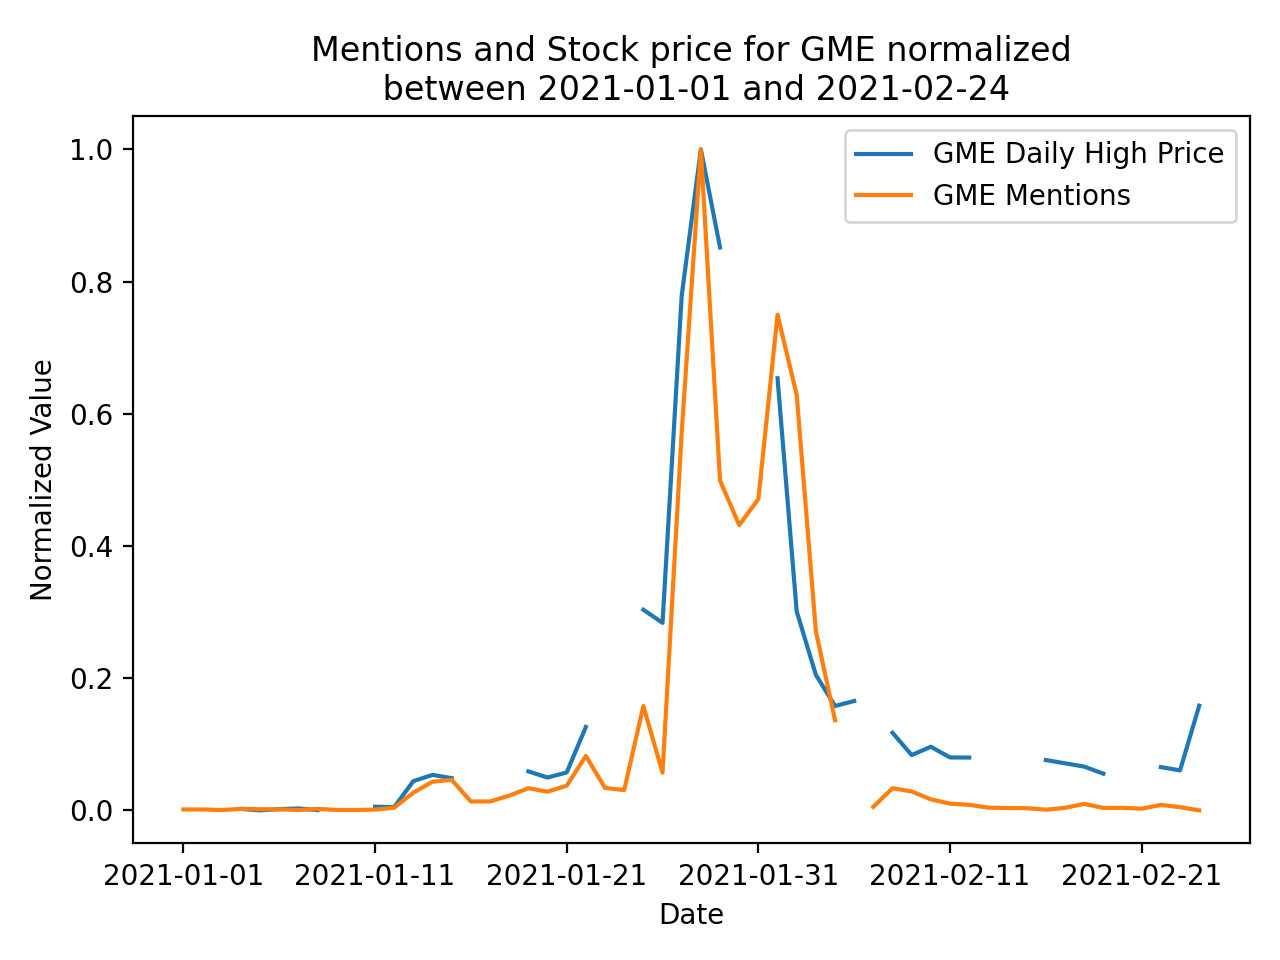
By visual inspection, there is a clear connection between GME's high price and the number of mentions in a given day. The filtered dataset includes frequency of GME ticker symbol recorded on a daily basis. For the 50 days this is plotted over, number of mentions range between 10 to 2800. In this time period, GME intraday high values range between $19 to $483.
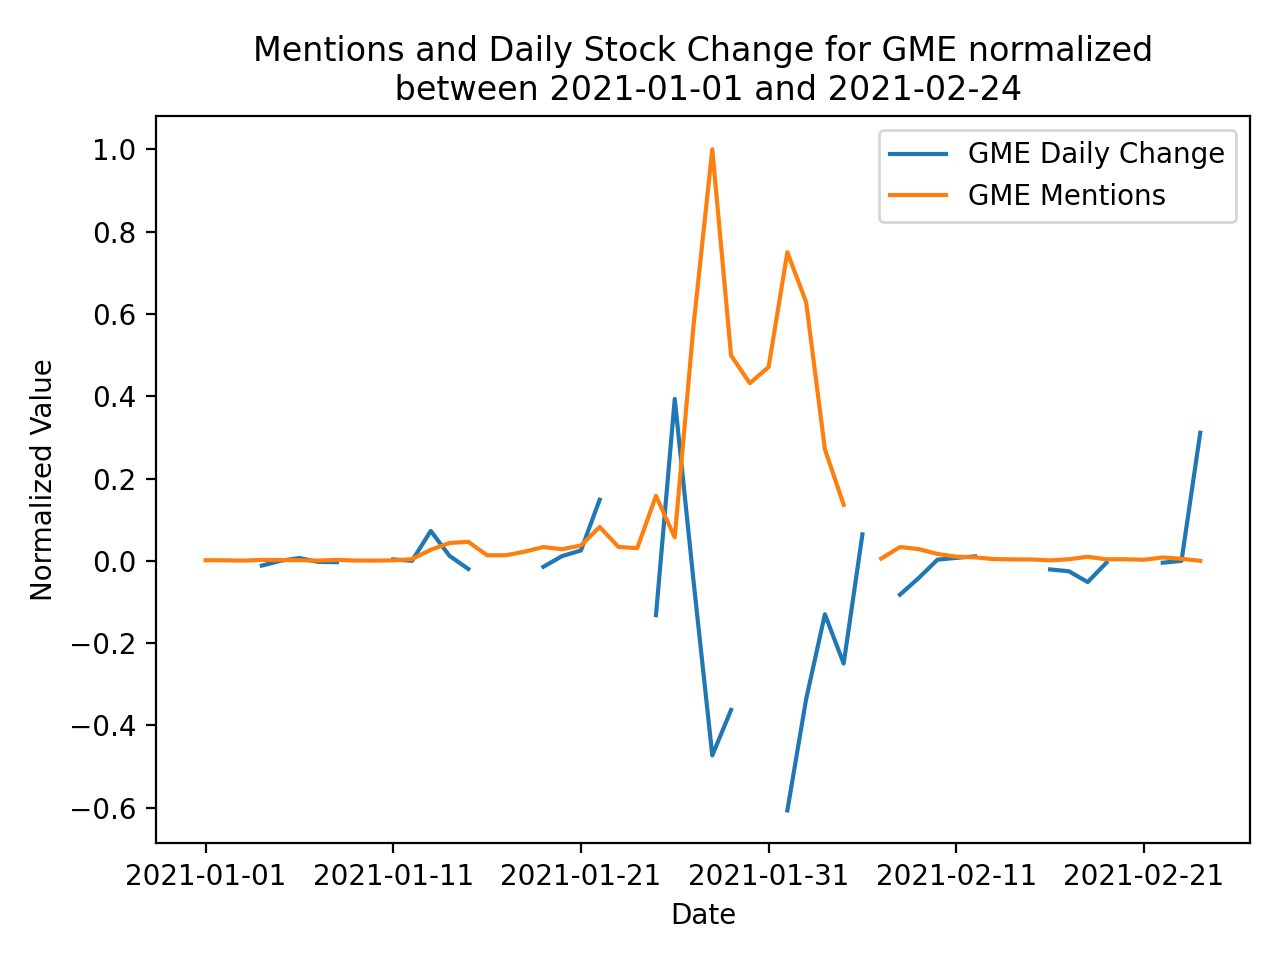
This plot shows the daily number of mentions plotted against the daily change in stock price. Here, it is seen that on the days when the stock made the largest leaps, whether postive or negative, redditors were posting the most about the stock. This plot would suggest that people discuss the stock most on days with significant change. This is regardless as to whether the stock value is increasing or decreasing.
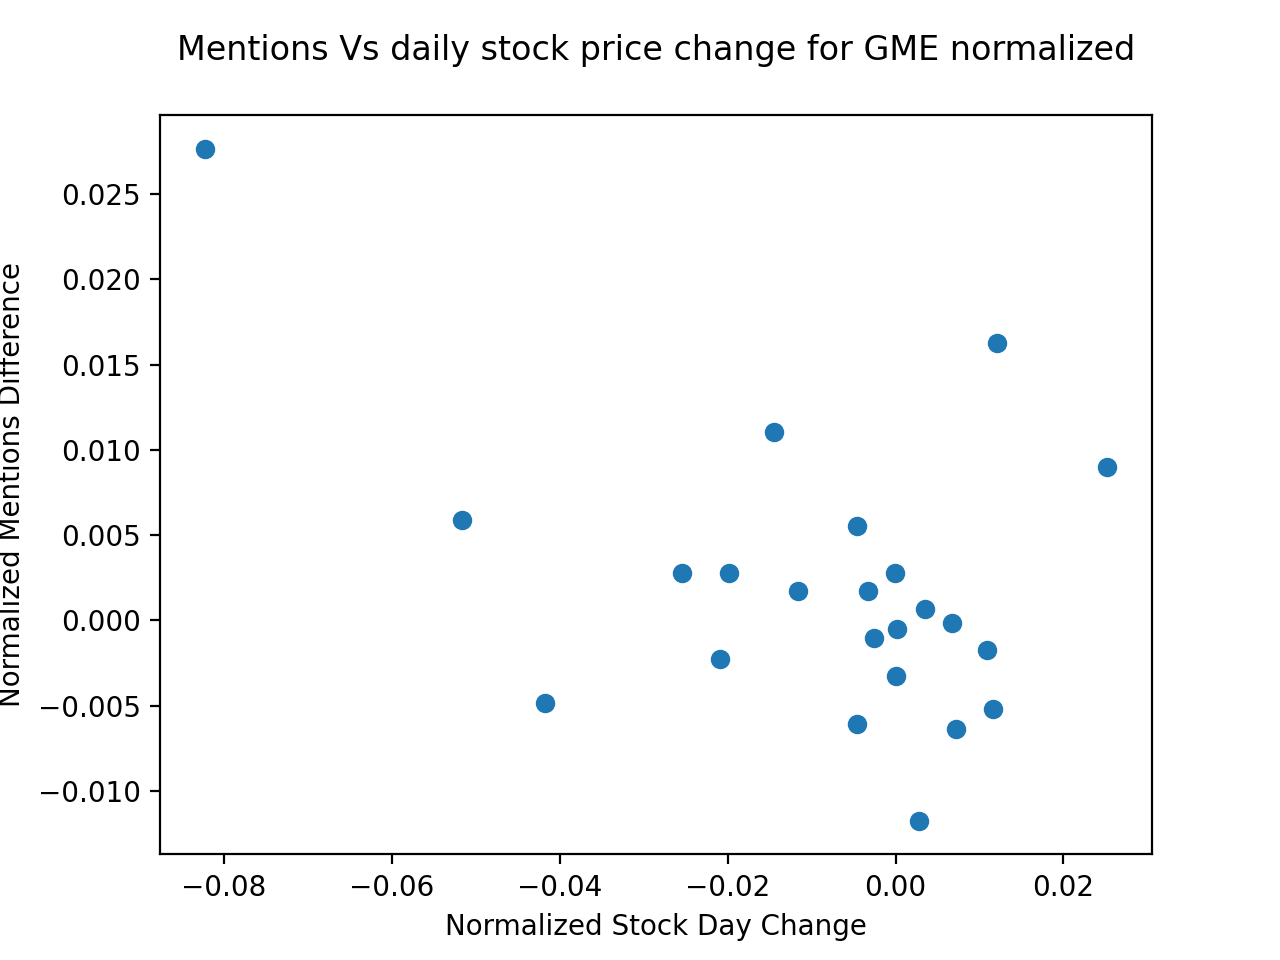
This scatter plot shows the similarities between change in daily number of mentions and daily stock day change. After dropping obvious outliers, it is clear that for every change in daily mentions, an expected similar change will occur in GME stock value.
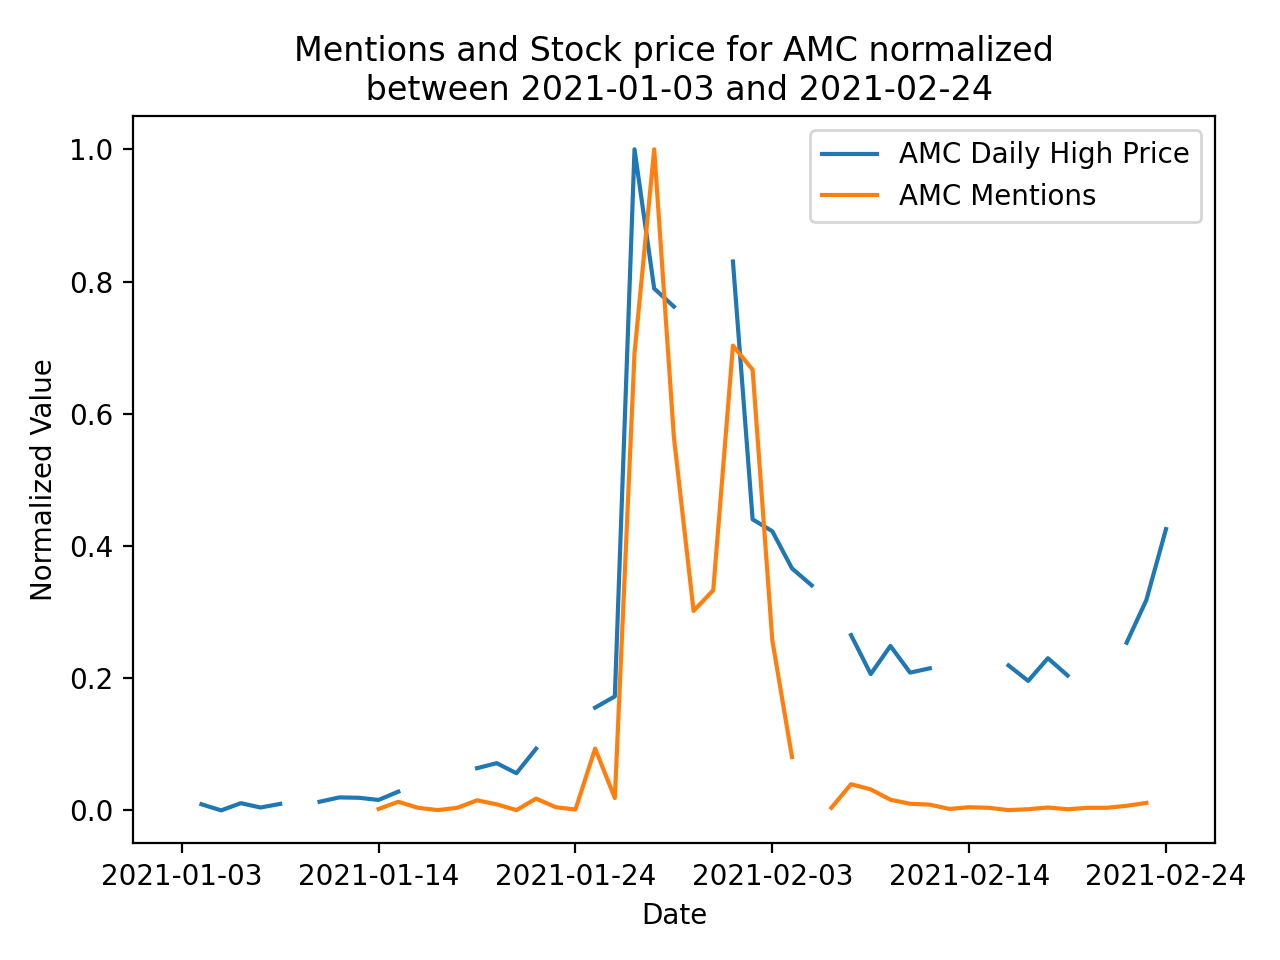
AMC stock was known to have followed a similar trend to GME stock in early 2021. The mentions and stock price follow a near identical pattern to that of GME.
Running The One Way Anova Test with gradient of daily number of stock mentions, daily change in stock price
To run the Anova test we must assume:
- The responses for each factor level have a normal population distribution
- These distributions have the same variance
- The data are independent
Since there is a large enough number of comments, based on the the previous plots, it appears that comments are somewhat normally distributed since there is a clear high point with lower levels to the left and right of it. Although I am taking the gradient in comment and stock day change, this will be more independent than the sole values for each day, however it is not quite independent as they are still time series plots. Equal variance is shown when the two datasets are normalized and plotted against each other. I am using an alpha value of 0.05 as it is the general standard. The statistics on this data are not critical enough to justify a lower Alpha threshold.
- GME
- f value = 7.433
- pvalue = 0.007491107552143138
- AMC
- f value = 6.156
- pvalue = 0.014
The resulting p values from the Anova test suggest that there is enough statistical signficance to reject the Null Hypothesis that GME price and mentions on WallStreetBets are correlated. This is assuming an alpha threshold of 0.05.
Running the One Sample Ttest with combined gradient values from daily number of stock mentions, daily change in stock price
- GME
- statistic = -3.999
- pvalue = 0.00019
- AMC
- statistic = -3.195
- pvalue = 0.0024
The resulting p values from the One Sample Ttest suggest that there is enough statistical signficance to reject the Null Hypothesis that GME price and mentions on WallStreetBets are correlated. This is assuming an alpha threshold of 0.05.
As of making this project, GME has once again been making market and WallStreetBets news by skyrocketting. Due to the continous nature of this data set, I plan to write a bash script that will scrape nightly to add to the database. Additionally, I plan to turn this program into a fullstack web app using Flask. The app will provide statistics and graphs based on user stock input.
- MongoDB
- PRAW API
- PushShift API
- Docker
- Postgres
- Matplotlib
- Pandas
- Hutto, C.J. & Gilbert, E.E. (2014). VADER: A Parsimonious Rule-based Model for Sentiment Analysis of Social Media Text. Eighth International Conference on Weblogs and Social Media (ICWSM-14). Ann Arbor, MI, June 2014
- “Yahoo Finance - Stock Market Live, Quotes, Business & Finance News.” Yahoo! Finance, Yahoo!, finance.yahoo.com/.
- “Subreddit Stats.” Subreddit Stats - Statistics for Every Subreddit, subredditstats.com/r/wallstreetbets.
- “Hackingthemarkets - Overview.” GitHub, github.com/hackingthemarkets.


