Millions of developers use AWS to bring products and services to people around the world. Code is not perfect and neither are the people writing it. Those overseeing operations need to be able to assess their deployments at all times. To help with this task, I created Overwatch.
I used AWS, Docker, Prometheus, and Grafana to develop a monitoring solution that provides oversight for CI/CD pipelines running in the cloud so that auditors and operation’s personnel can quickly assess the health of mission-critical infrastructure.
The tight integration of Overwatch’s components allows personnel overseeing operations to assess failures quickly.
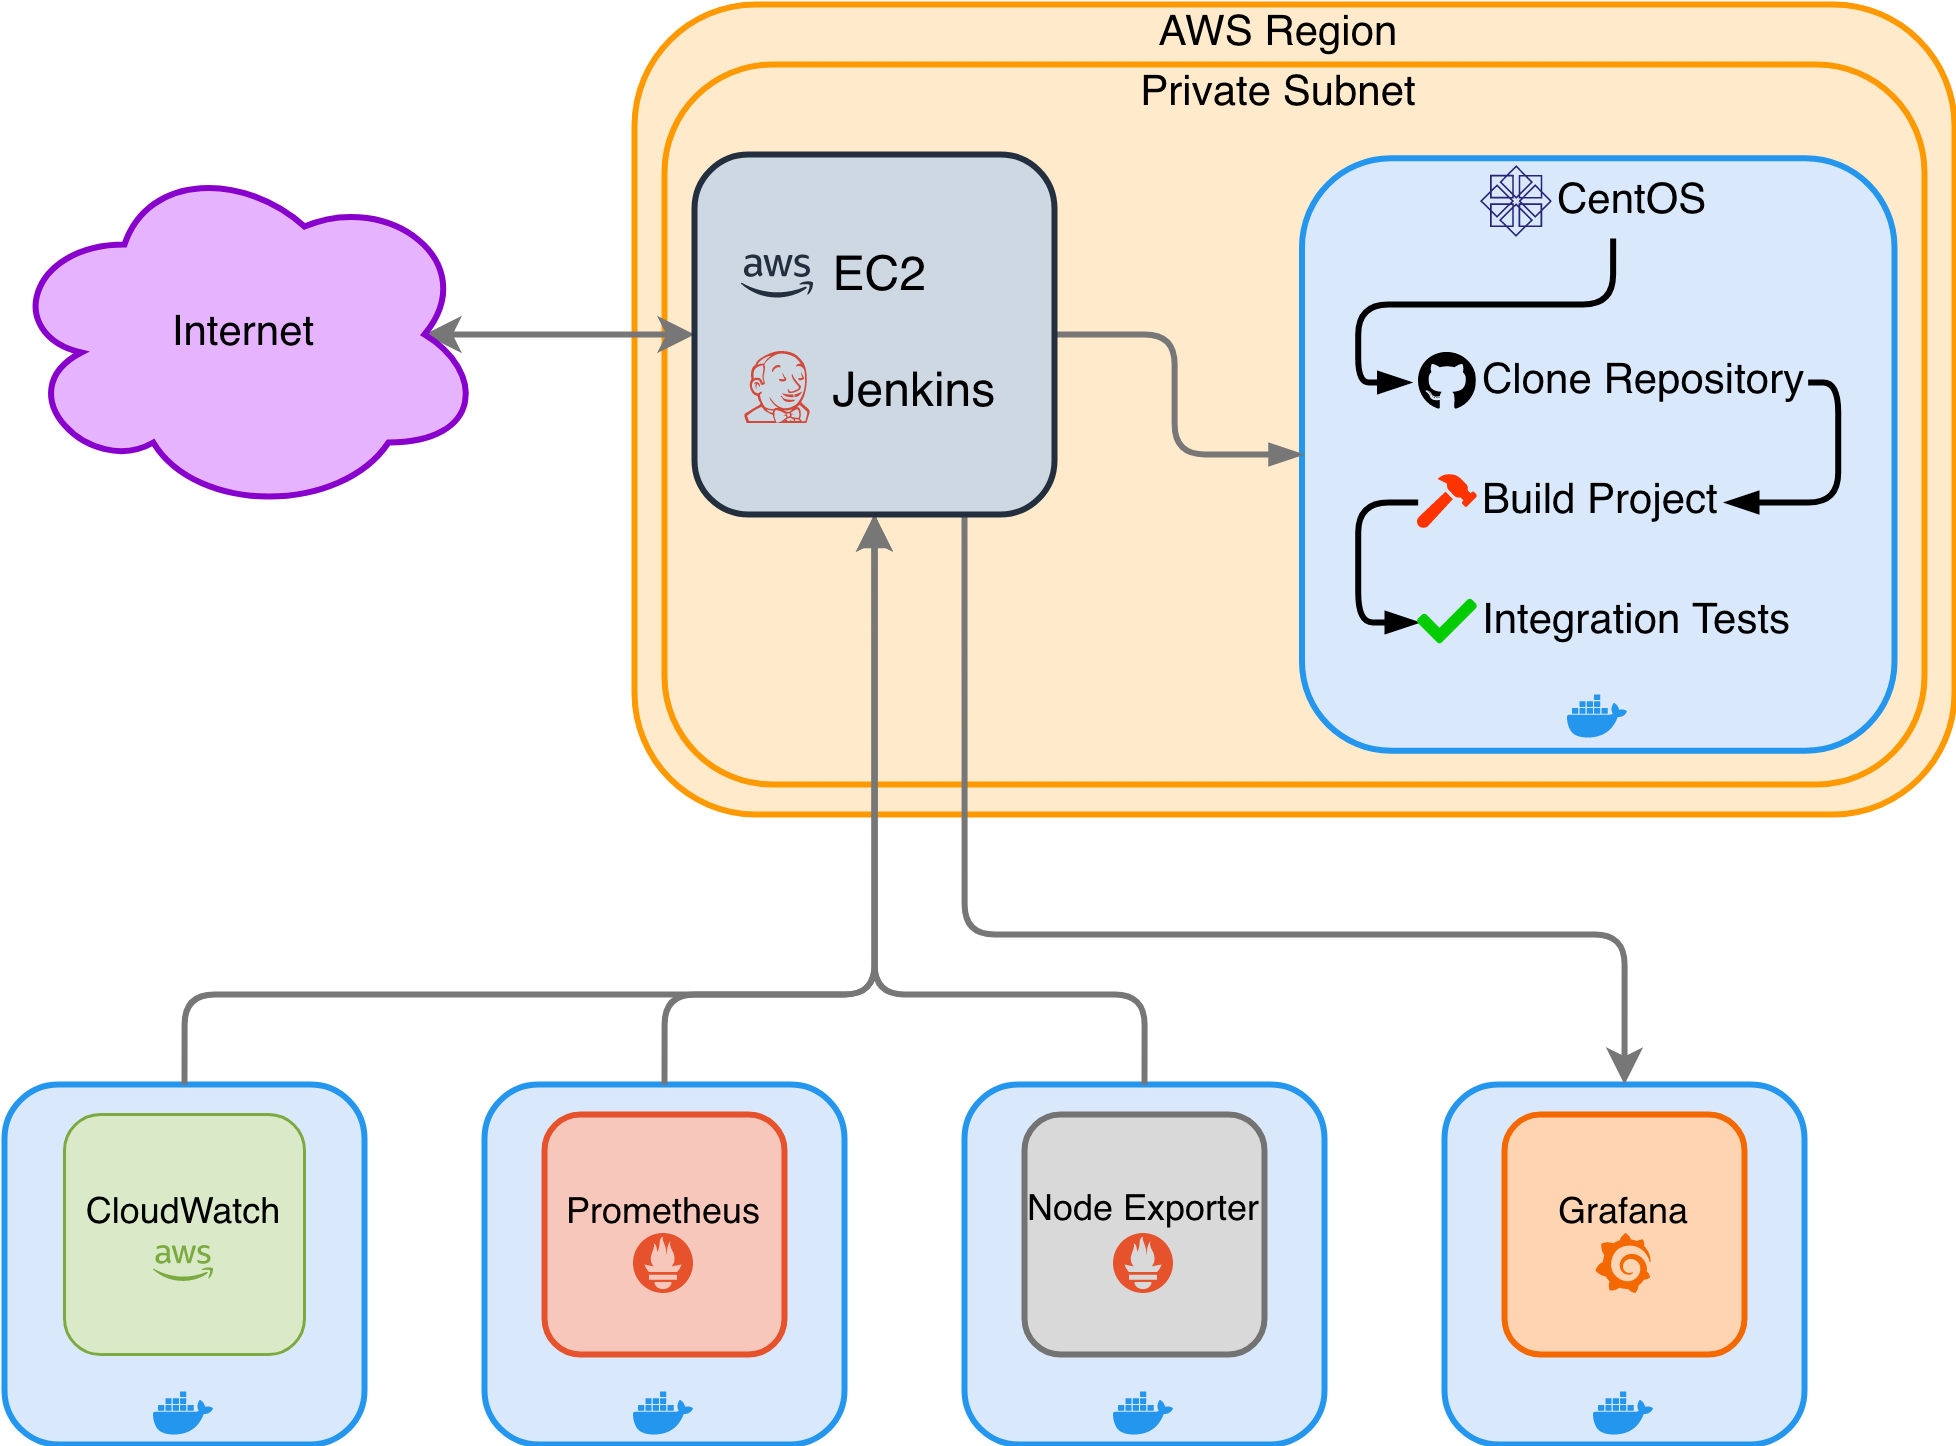
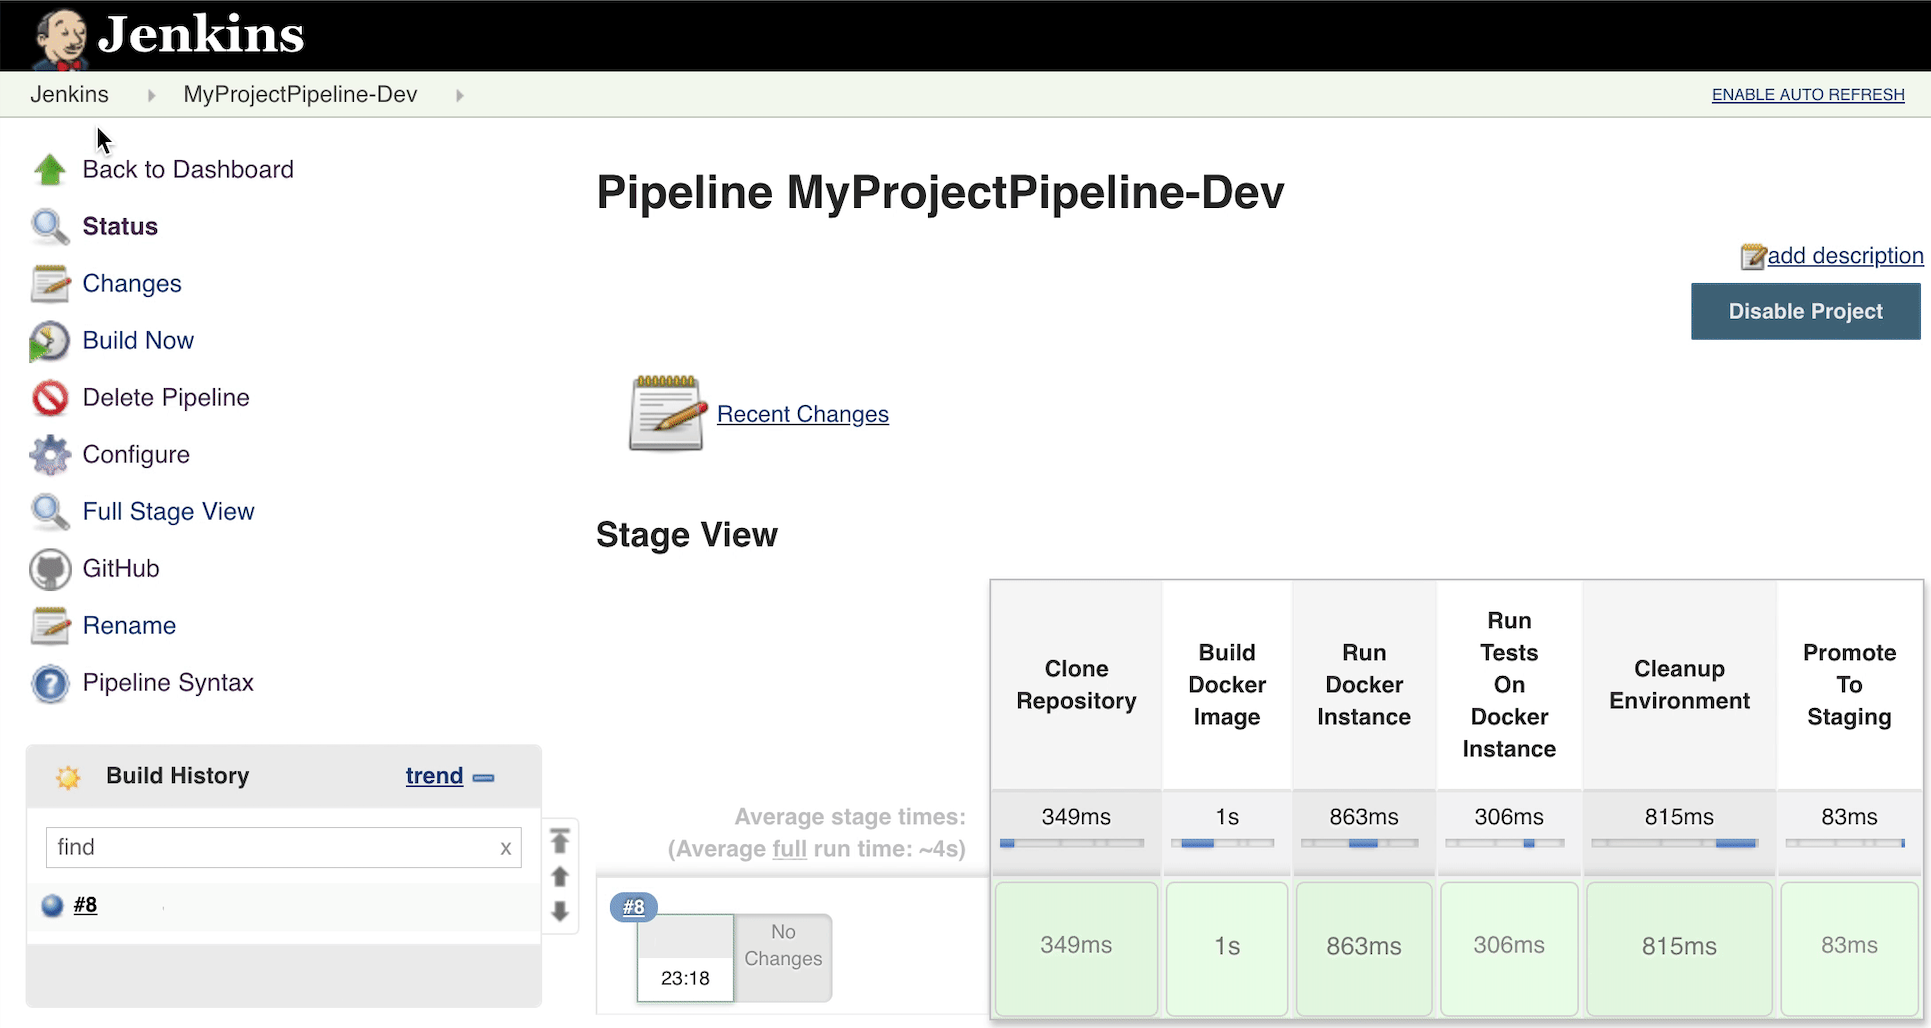
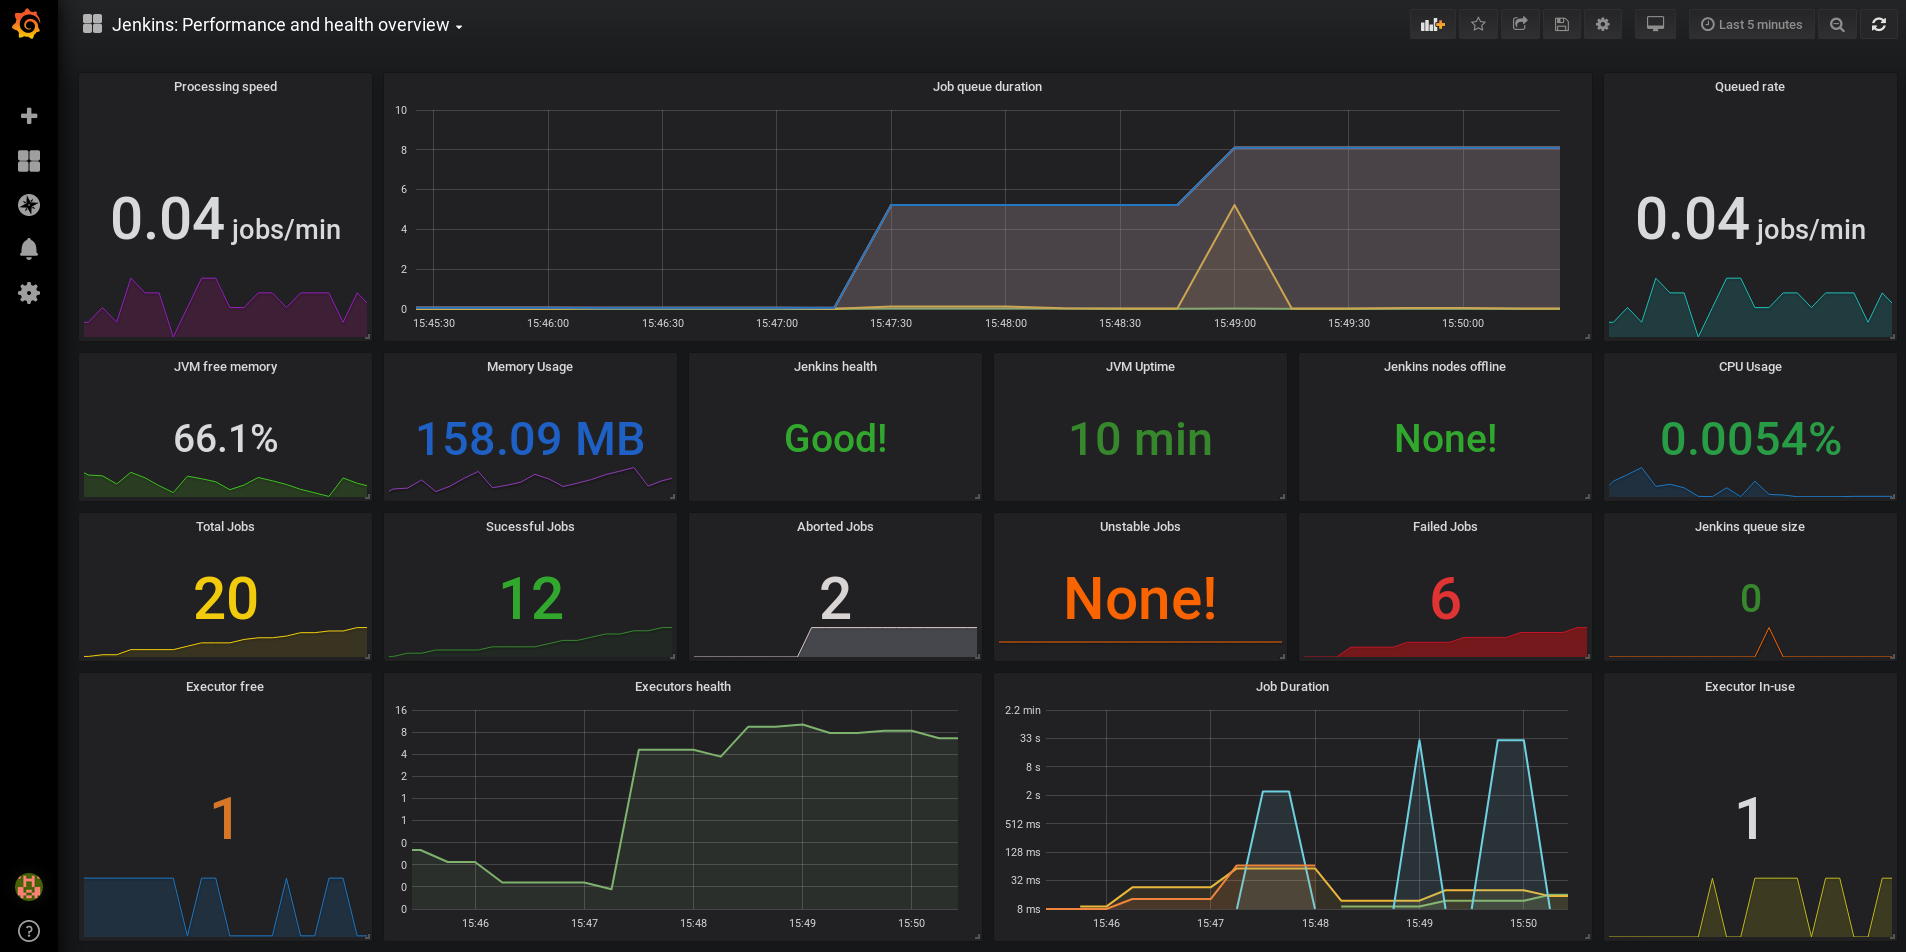
CloudWatch, Prometheus, and Node Exporter - each in their own Docker container - monitor an EC2 instance on AWS. Jenkins is running on the EC2 instance which is connected to the internet. When prompted via command, Jenkins begins running a CI/CD pipeline. This pipeline creates a Docker container where CentOS (Linux distribution) is virtualized. A GitHub repository is then cloned. The project in this repo is built and integration tests are run. The results of these integration tests are then relayed to Grafana for a user to see.
Cloudwatch-Exporter
Put your AWS credentials into cloudwatch-exporter.dockerfile
ENV AWS_ACCESS_KEY_ID=value \
    AWS_SECRET_ACCESS_KEY=value
Installation & Deployment
- Clone this repository
- Install Docker (Mac, Windows, Linux)
- In the project directory run
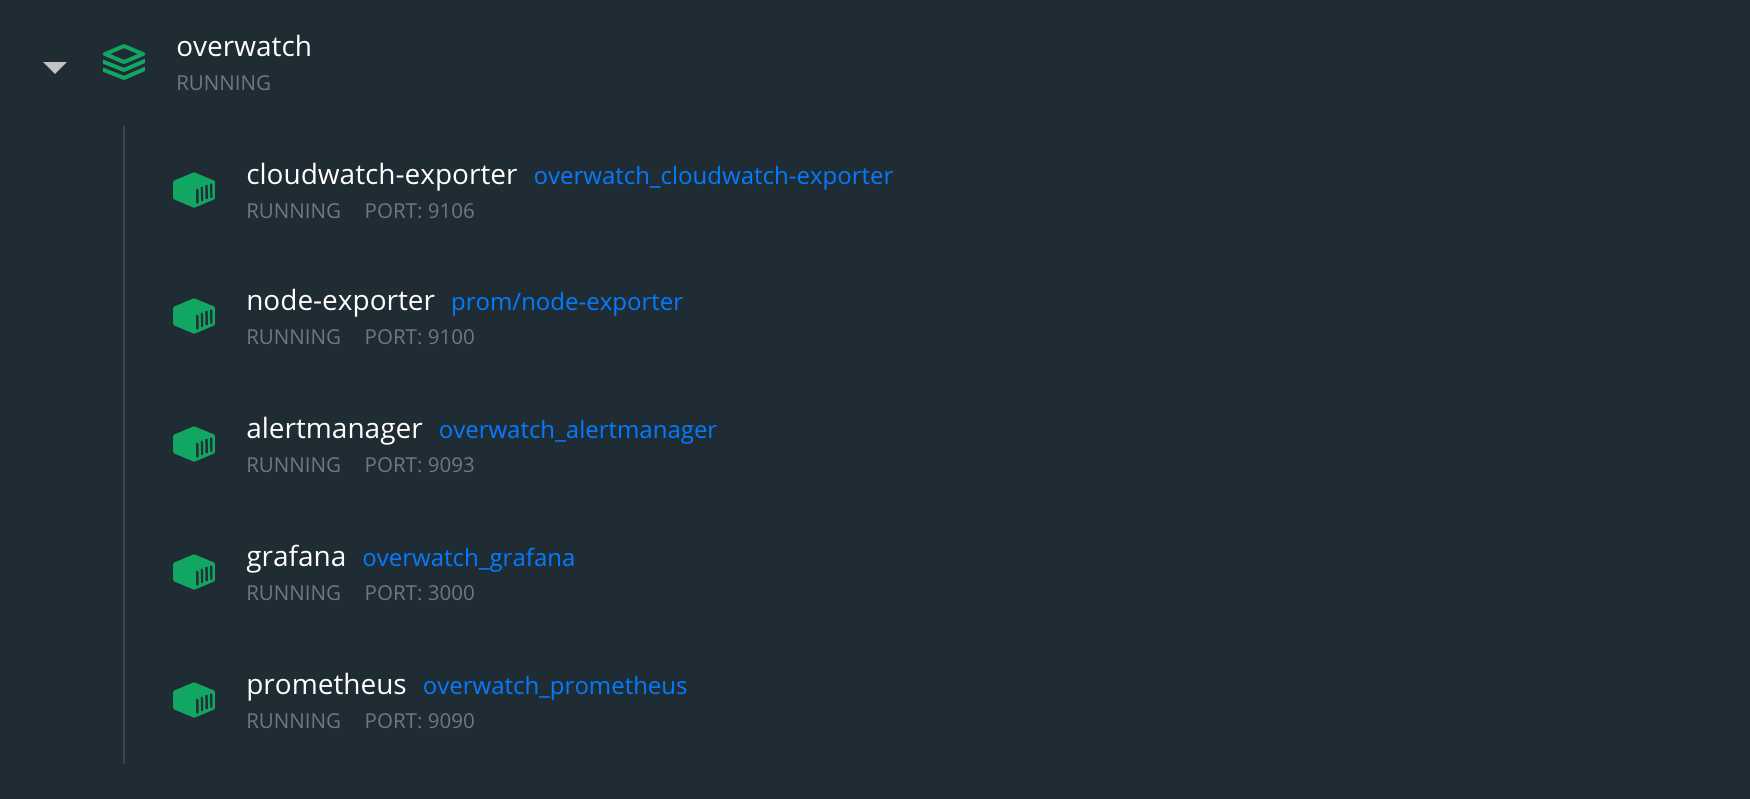
docker-compose up - Navigate to Grafana (localhost:3000) in a browser
- On the left sidebar, select Configuration > Data Sources
- Select Prometheus, set the HTTP URL to the IPv4 address of your EC2 instance with port number 9090
- On the left sidebar, select Dashboards > Manage
- Select New Dashboard
Prometheus: http://localhost:9090
Alertmanager: http://localhost:9093
Grafana: http://localhost:3000
Prometheus Reload: curl -X POST http://localhost:9090/-/reload
Prometheus Health Check: curl http://localhost:9090/-/healthy
CloudWatch Exporter Reload: curl -X POST http://localhost:9106/-/reload
-
Docker Support
- Advantages
- Keeping the processes in separate images (and thus running them in separate containers) permits each to be maintained independently. Further, each process can be secured independently.
- Keeping the processes in their own containers permits the running of one Prometheus container and one Grafana container for multiple containers.
- Along the same line, there is more flexibility in relocating containers, potentially dropping Grafana to use a Grafana hosted service, etc.
- Engineering Challenge
- Dockerizing each monitoring platform meant that the metrics needed to be pulled from a local server instead of the platforms themselves.
- Advantages
-
Alertmanager Support
- Setup the Alertmanager config in alertmanager.yml to meet your needs. Configurable options include email alerts, SMS messages, and more.
-
Automate
- Currently, the frontend and backend work on their own with manual entry for AWS. Automate the entire setup process connecting the frontend to the backend.
-
Dashboard
- Create a more robust dashboard.
Project icon^ from flaticon.com (edited by me)
Systems architecture diagram^ made with draw.io
Systems architecture diagram icons^ from fontawesome.com and simpleicons.org (both edited by me)
Thank you for your interest, this project was fun and insightful! If you have any feedback or questions, please reach out via email which can be found at
AdamAlston.com


