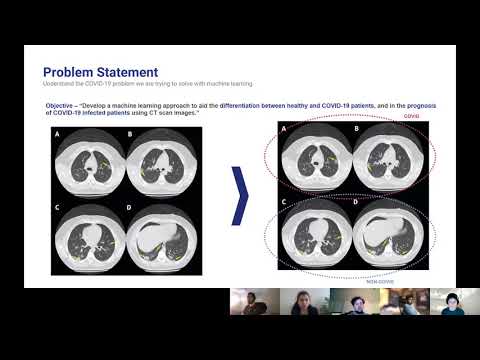
COVID-19 has infected over 66 million people and caused around a million deaths worldwide. The virus can infect the upper or lower part of the respiratory tract. Doctors have reported signs of respiratory inflammation on a chest CT scan of COVID-19 patients. Machine learning approaches on CT scan images can help differentiate between healthy and COVID-19 patients, and also predict prognosis of COVID-19 infected patients. An automated prognosis prediction model could help physicians quickly treat patients.
Develop a machine learning approach to aid the differentiation between healthy and COVID-19 patients, and in the prognosis of COVID-19 infected patients using CT scan images.
The SARS-CoV-2 CT-scan dataset consists of 2482 CT scans from 120 patients, with 1252 CT scans of 60 patients infected by SARS-CoV-2 from males (32) and females (28), and 1230 CT scan images of 60 non-infected patients by SARS-CoV-2 from males (30) and females (30), but presenting other pulmonary diseases (Soares et al. 2020). This dataset consists of digital scans of printed CT exams of patients from hospitals of São Paulo, Brazil. This dataset has the following issues:
- The images have no standard regarding image size (the dimensions of the smallest image in the dataset are 104×153 while the largest images are 484×416).
- The dataset also lacks standardization regarding the contrast of the images.
We propose an unsupervised learning approach that can be tied back to existing metadata, like mortality, age, BMI, COVID / Non-COVID etc. To accomplish this, we will train an Autoencoder model to create a low-dimensional representation of each image (Bank et al. 2020), and then use different clustering methods to determine optimal groupings for these images based on their encoding (Song et al. 2013)(Guo et al. 2017). Once these groups are instantiated, we can then associate image metadata to each cluster to determine whether there are statistically significant attributes tied to specific clusters. If it could be proven that attributes like mortality rate or success with intubation are linked to certain clusters, that information could be incredibly valuable for clinical outcomes. Also, although we have limited prognosis labels, we will also determine autoencoder performance by trying to classify the image based on the encoding using fully connected layers.
We also train a ResNet-18 model on the existing labels to compare results against the Autoencoder approach as well as the previous work performed on this dataset: A large dataset of real patients CT scans for SARS-CoV-2 identification (Soares et al. 2020).
We employ many standard methods to image pre-processing as described in the literature, including image normalization (using z-scores of image pixels), reshaping to a standard image size, and augmenting the training dataset to promote model generalization (Silva et al. 2020). In particular, random horizontal flipping and color jitter is ideal for our training dataset because it changes the CT images, but maintains the general standard structure. See the images below to get an intuition for how this image processing pipeline works. The second and third images are also horizontally flipped.


Figure 1 Transformed images using standard image pre-processing methods, including image normalization (using z-scores of image pixels), reshaping to a standard image size, random horizontal flipping, and color jitter. Transformed pixel values are described for each image above the respective image.
Using the existing labels in the dataset, we trained a ResNet-18 model to predict whether a given CT Scan had COVID or not. We followed a similar process as in related work (Soares et al. 2020) to treat image as an independent sample and split our data into 80% training data and 20% evaluation. Given this data split, we were able to outperform the model xDNN model proposed by Soares et al. by raising the F1-Score for COVID prediction from 97.31 to 97.87 on unseen data.

Figure 2 Results on both COVID and Non-COVID images in our hold-out evaluation set. Compared to the previous work by Soares et al., our model was able to increase the F1-Score from 97.31 to 97.87.
We have also implemented the Autoencoder model we are using to extract a low dimensional feature representation from each image that will then be used in clustering. We used an Autoencoder architecture with four encoding and four decoding layers that take an image of size 224x224x1 to 500x1 and then back to 224x224x1. In order to train the model, we minimize the Mean Squared Error (MSE) loss between the original image and the reconstructed image. Over the course of 100 epochs with a batch size of 16 we were able to achieve an MSE of .725963 on the unseen validation set. Here’s the architecture of the autoencoder we used as our model:

Figure 3 Autoencoder architecture that transforms an image of size 224x224x1 to 500x1 and then back to 224x224x1 to construct an embedding that represents the high dimensional image. We use MSE loss to determine the reconstruction quality.
Here are the results on validation data from this first Autoencoder model trained on the entire dataset of 1300 training images:


Figure 4 Images from the validation set along with their reconstructed image output from the trained Autoencoder. The model was able to reconstruct the structure and many of the fine-details present in the images.
We considered two different clustering algorithms, KMeans and Gaussian Mixture Model (GMM) to cluster the embeddings of the CT Scans and to see how effectively the algorithm was able to cluster the embeddings according to COVID diagnosis. In order to optimize the hyperparameters (number of clusters/components, k) for KMeans and GMM we used 5-fold cross validation. We ranged k from 2 to 20 and tracked the test set purity of each fold. The k which yielded the highest average test set purity was taken as the optimal hyperparameter. The figure below shows our results. For both KMeans and GMM, 20 was the optimal number of clusters or components. If we wish to penalize our model having too many clusters, we can visually look to see at what number of clusters the purity increase becomes minimal. For KMeans this is 18 clusters and for GMM this is 9 components.

For the final models we used the k which yielded highest purity and an 80/20 train/test split. We found that KMeans exhibited a test set purity of .557 while GMM exhibited a test set purity of .552
Before we can employ a clustering algorithm among the various algorithms and procedures present in literature for our dataset, it is insightful to understand the clustering tendency of our dataset. This implies that we need to analyse our dataset to prove that the data points can be partitioned into groups without already knowing the groups themselves. A dataset which does not already contain natural groups of data points is considered a randomly or uniformly distributed dataset and should not be considered for clustering. For this we decided to use hopkin’s statistics to realise whether a clustering algorithm will provide meaningful results.
Hopkin’s statistics is easy to use and a reliable analysis to derive the conclusion for clustering. For this analysis two sets of data points are considered. First, a set of uniform randomly distributed data points (m), and second, a random sample of data points (m) from the original dataset (n), where m << n. From these two datasets, two distances are calculated. First, the distance of each randomly distributed data points to its nearest neighbor in the original dataset (ui), and second, the distance of each randomly sampled data point to its nearest neighbor in the original dataset (wi). We then derive a value from the below formula:
where d denotes the dimension of data points. A value equal to one 1 denotes a highly clusterizable dataset, a value of 0.5 denotes a randomly distributed dataset, and 0 denotes a uniformly distributed dataset.
The test gave a score of 0.62 for the embeddings, and indicated that the data points were clusterizable.
Since we are dealing with a partially-labeled data set we will employ semi-supervised clustering on the auto-encoded image features (i.e. embeddings). Our embeddings will be split into a training and test set. We will train a K Means model on the training set. We will then evaluate the purity of this trained classifier on the labelled data in the test set. In order to tune our hyper-parameters (i.e. number of clusters, k) we will train 19 models, with k varying from 2 to 20, and see which model has the highest test set purity. This will be the final clustering model. The code for this entire methodology has been written and tested using a hypothetical data set.
We decided to use internal measures to compute the clustering validity for the results of our clustering algorithm. We use Davies Bouldin score and Silhouette score to show the cluster validity. Davies Bouldin score is the average similarity measure of each cluster, where similarity is the ratio of inter and intra cluster distances. The minimum score is 0, and a lower score indicates better clustering. Silhouette score uses mean intra cluster distance (di) and mean nearest cluster distance (do). The score is computed using the below formula:
The score ranges from -1 to 1. 1 indicates good clustering, while 0 indicates overlapping clusters and -1 indicates incorrect clustering. We will use these approaches to test the validity of the clusters generated by our clustering algorithm.
For the KMeans clustering, we got a silhouette score of -0.18 which indicates overlapping clusters. This can be attributed to the fact that we had 20 clusters of images with/without COVID. As there could be similarities between images in different clusters, we can expect a data point to be assigned to more than one cluster. We also got the score of 130.54 from the Davies Bouldin test. Such a high score can be attributed to the "Curse of Dimensionality", as each point has 501 features.
The initial models created come with a few current limitations. The first being that the dataset is limited in size. The second being that the dataset does not contain any metadata that could aid in prediction accuracy. We hope to address these concerns by analyzing a second dataset (Rahimzadeh 2020). This dataset includes 63,849 images, around 25x our current dataset, from 377 patients and includes an entire inhale-exhale cycle of a patient’s lungs. The possible benefits of this are being able to detect differences in each facet of the breathing cycle, and not simply when the lungs are fully inflated. The other advantage of this dataset is it includes basic metadata about each of the patients. These metrics include the sex of the patient as well as their age. While we know that this is not a lot of metadata, there are very clear distinctions within the groups. Below are three images giving an overview of the dataset. It can be clearly seen from these images that our data skews negative (95 vs 282), the average age of someone with covid is significantly higher than one without (50 vs 37), and males are more likely to have covid than females (56/95 positives are men). We hope that this preliminary information can help us more properly discern Covid cases.


Figure 4 Data visuals extracted from metadata of the dataset consolidated by Rahimzadeh et al. Key insights include that our data skews negative (95 vs 282), the average age of someone with covid is significantly higher than one without (50 vs 37), and males are more likely to have covid than females (56/95 positives are men).
The overarching issue with this dataset is the format of the images. These images are all black by nature, and are stored in TIFF format. The dataset includes a visualize function that divides each image’s pixel value by the maximum value to allow normal monitors to view the dataset. We believe in order to properly utilize this dataset, we should first convert all of these images to a standardized human viewable format, since this is the way our autoencoder currently functions. This will require significant preprocessing as the size of the dataset is massive. TIFFs are also much harder to work with based on the fact that they are uncompressed. This means they do not have standardized sizes, which will be a problem for our autoencoder. Given sufficient time to normalize the dataset, we believe we can make use of this dataset and incorporate metadata to enhance our existing model.
Running a large data set which would require significant CPU resources and time. Inability to find sufficient processing power for our models to run, we might not be able to perform our analysis on the complete data set. Also, although CT Scans are more informative, we might need to consider X-ray data due to data availability problem. Our Model should be able to cluster scans which have similar metadata. If our model is unable to give a near accurate prognosis for the testing data set, our project may not present meaningful results.
- A. Banerjee and R. N. Dave, "Validating clusters using the Hopkins statistic," 2004 IEEE International Conference on Fuzzy Systems (IEEE Cat. No.04CH37542), Budapest, Hungary, 2004, pp. 149-153 vol.1, doi: 10.1109/FUZZY.2004.1375706.
- Bank, Dor, Noam Koenigstein, and Raja Giryes. "Autoencoders." arXiv preprint arXiv:2003.05991 (2020)
- Guo, Xifeng, et al. "Deep clustering with convolutional autoencoders." International conference on neural information processing. Springer, Cham, 2017
- Song, Chunfeng, et al. "Auto-encoder based data clustering." Iberoamerican congress on pattern recognition. Springer, Berlin, Heidelberg, 2013
- Rahimzadeh, M.; Attar, A.; Sakhaei, M. A Fully Automated Deep Learning-based Network For Detecting COVID-19 from a New And Large Lung CT Scan Dataset. Preprints 2020, 2020060031 (doi: 10.20944/preprints202006.0031.v3).
- Soares, E., Angelov, P., Biaso, S., Froes, M. H., & Abe, D. K. (2020). SARS-CoV-2 CT-scan dataset: A large dataset of real patients CT scans for SARS-CoV-2 identification. medRxiv.
- Silva, P., Luz, E., Silva, G., Moreira, G., Silva, R., Lucio, D., & Menotti, D. (2020). COVID-19 detection in CT images with deep learning: A voting-based scheme and cross-datasets analysis. Informatics in Medicine Unlocked, 20, 100427.