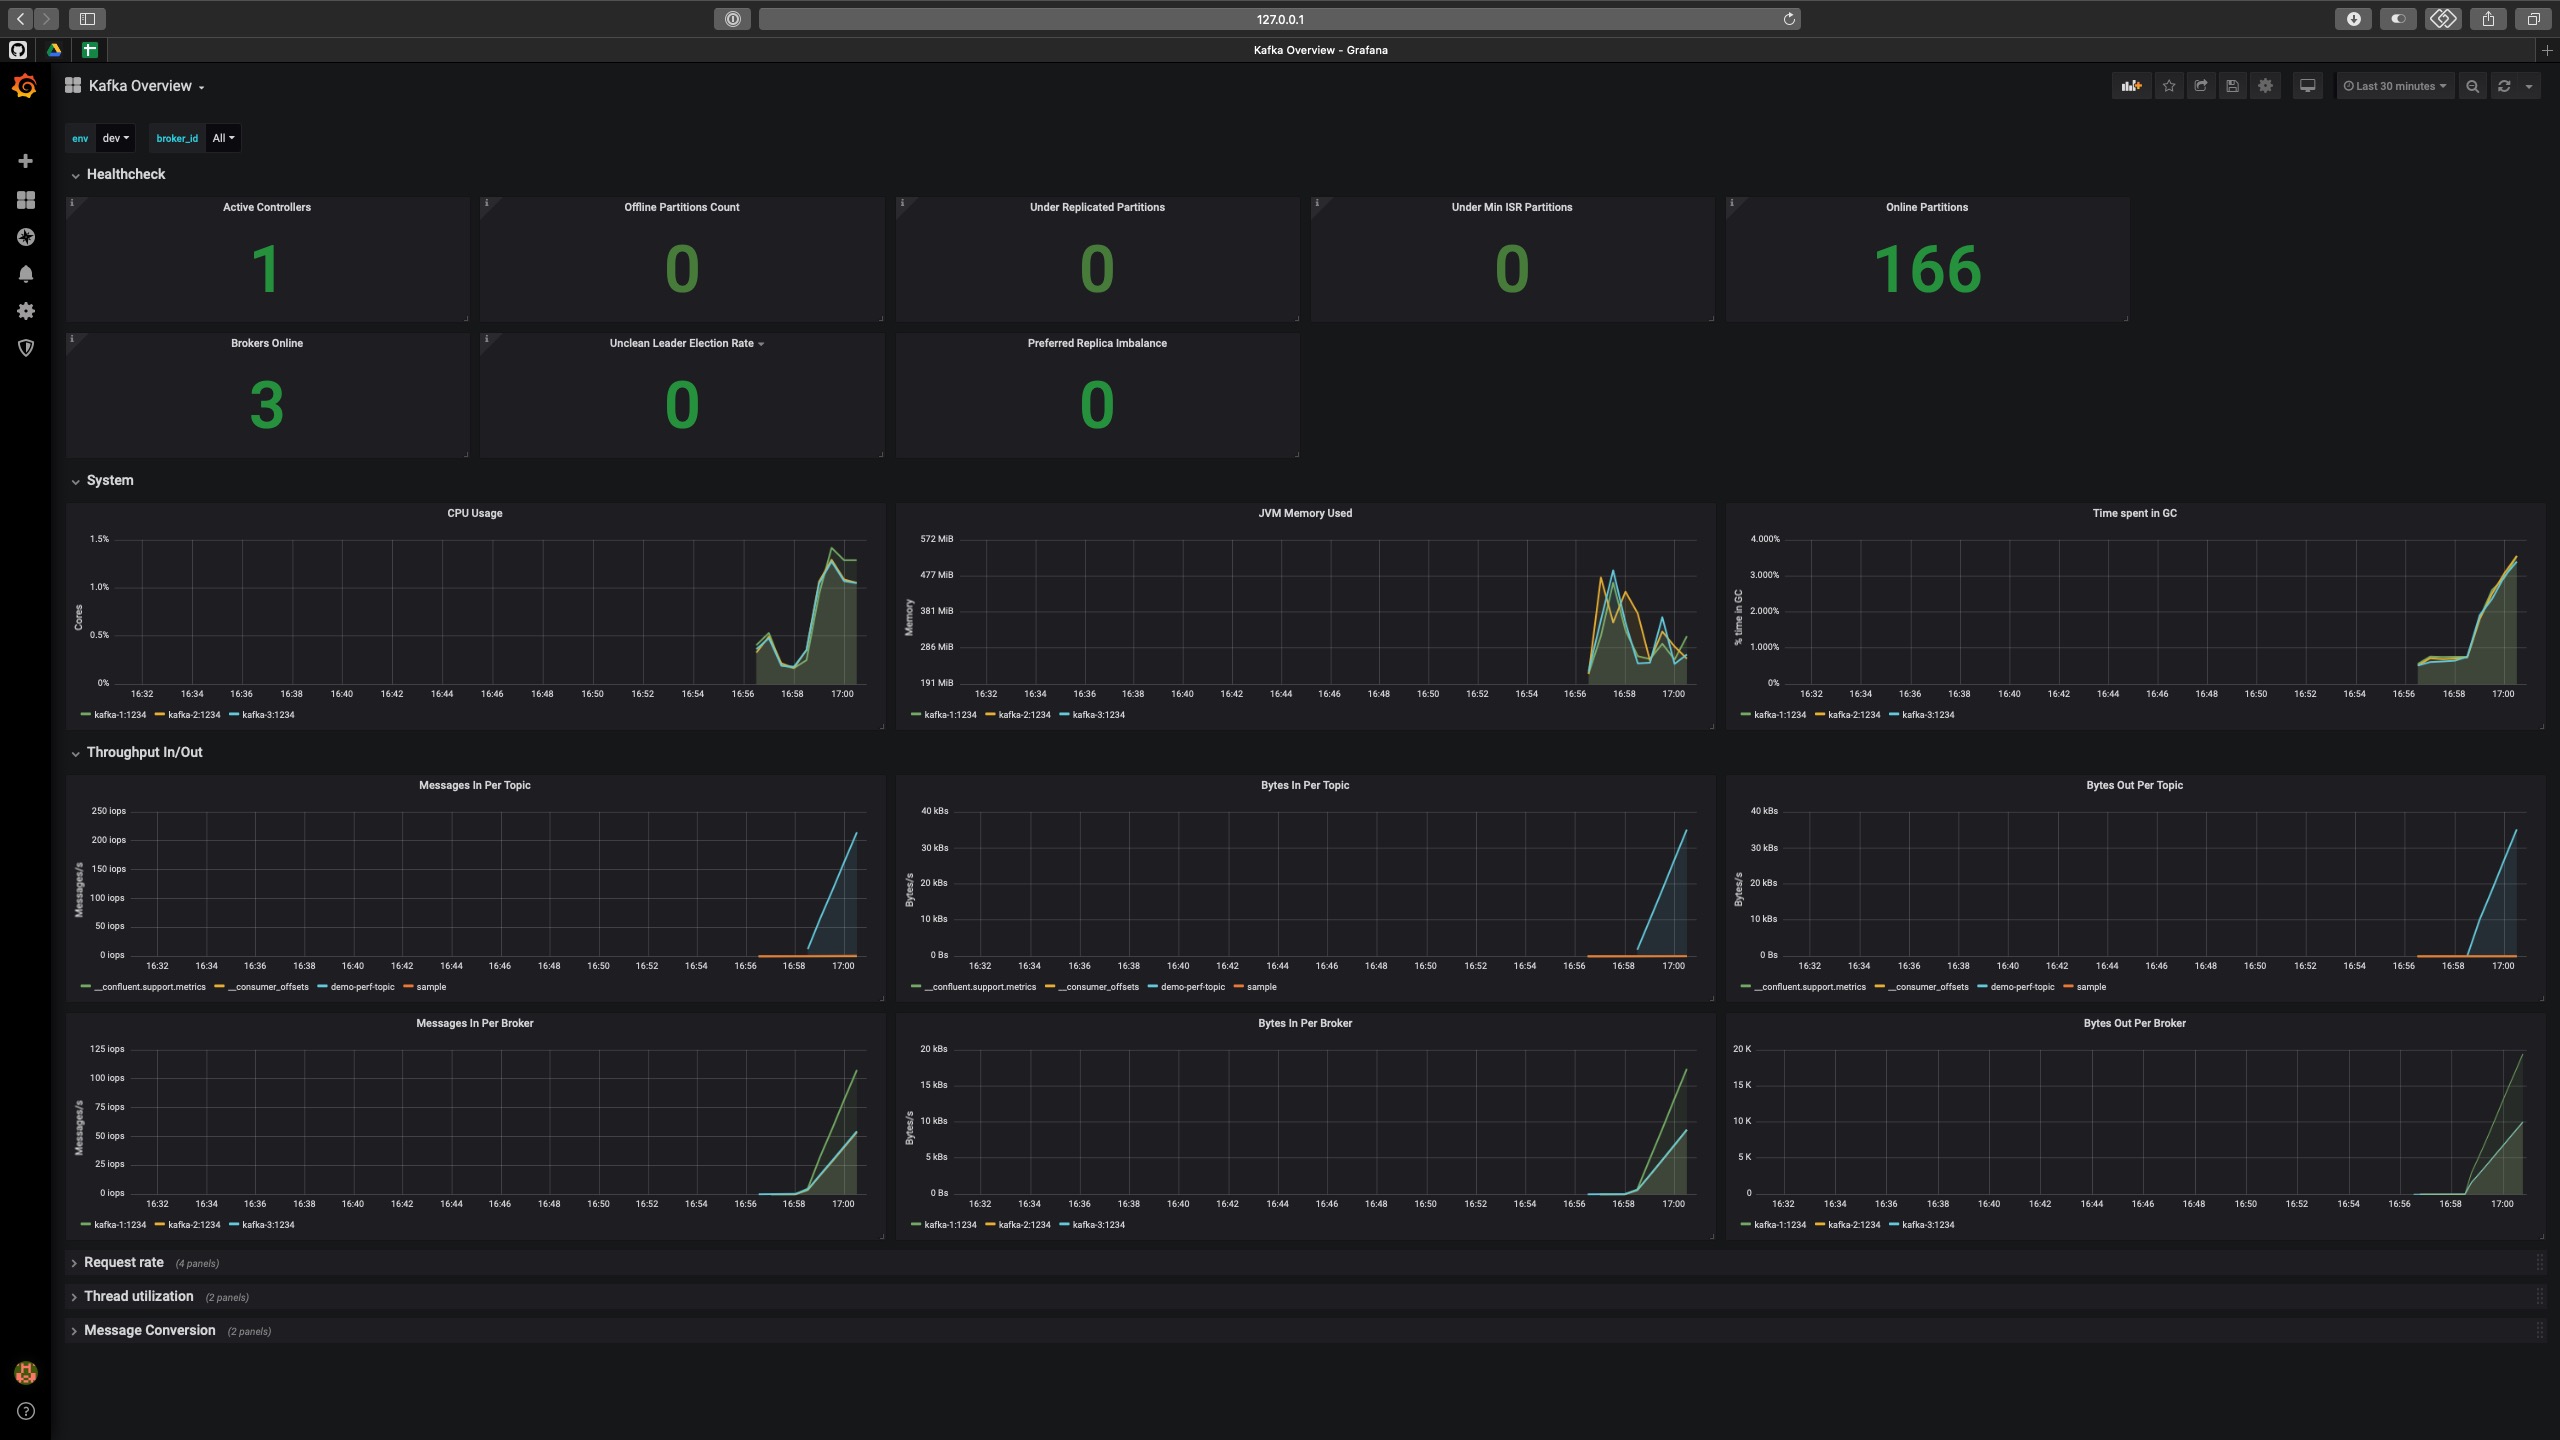
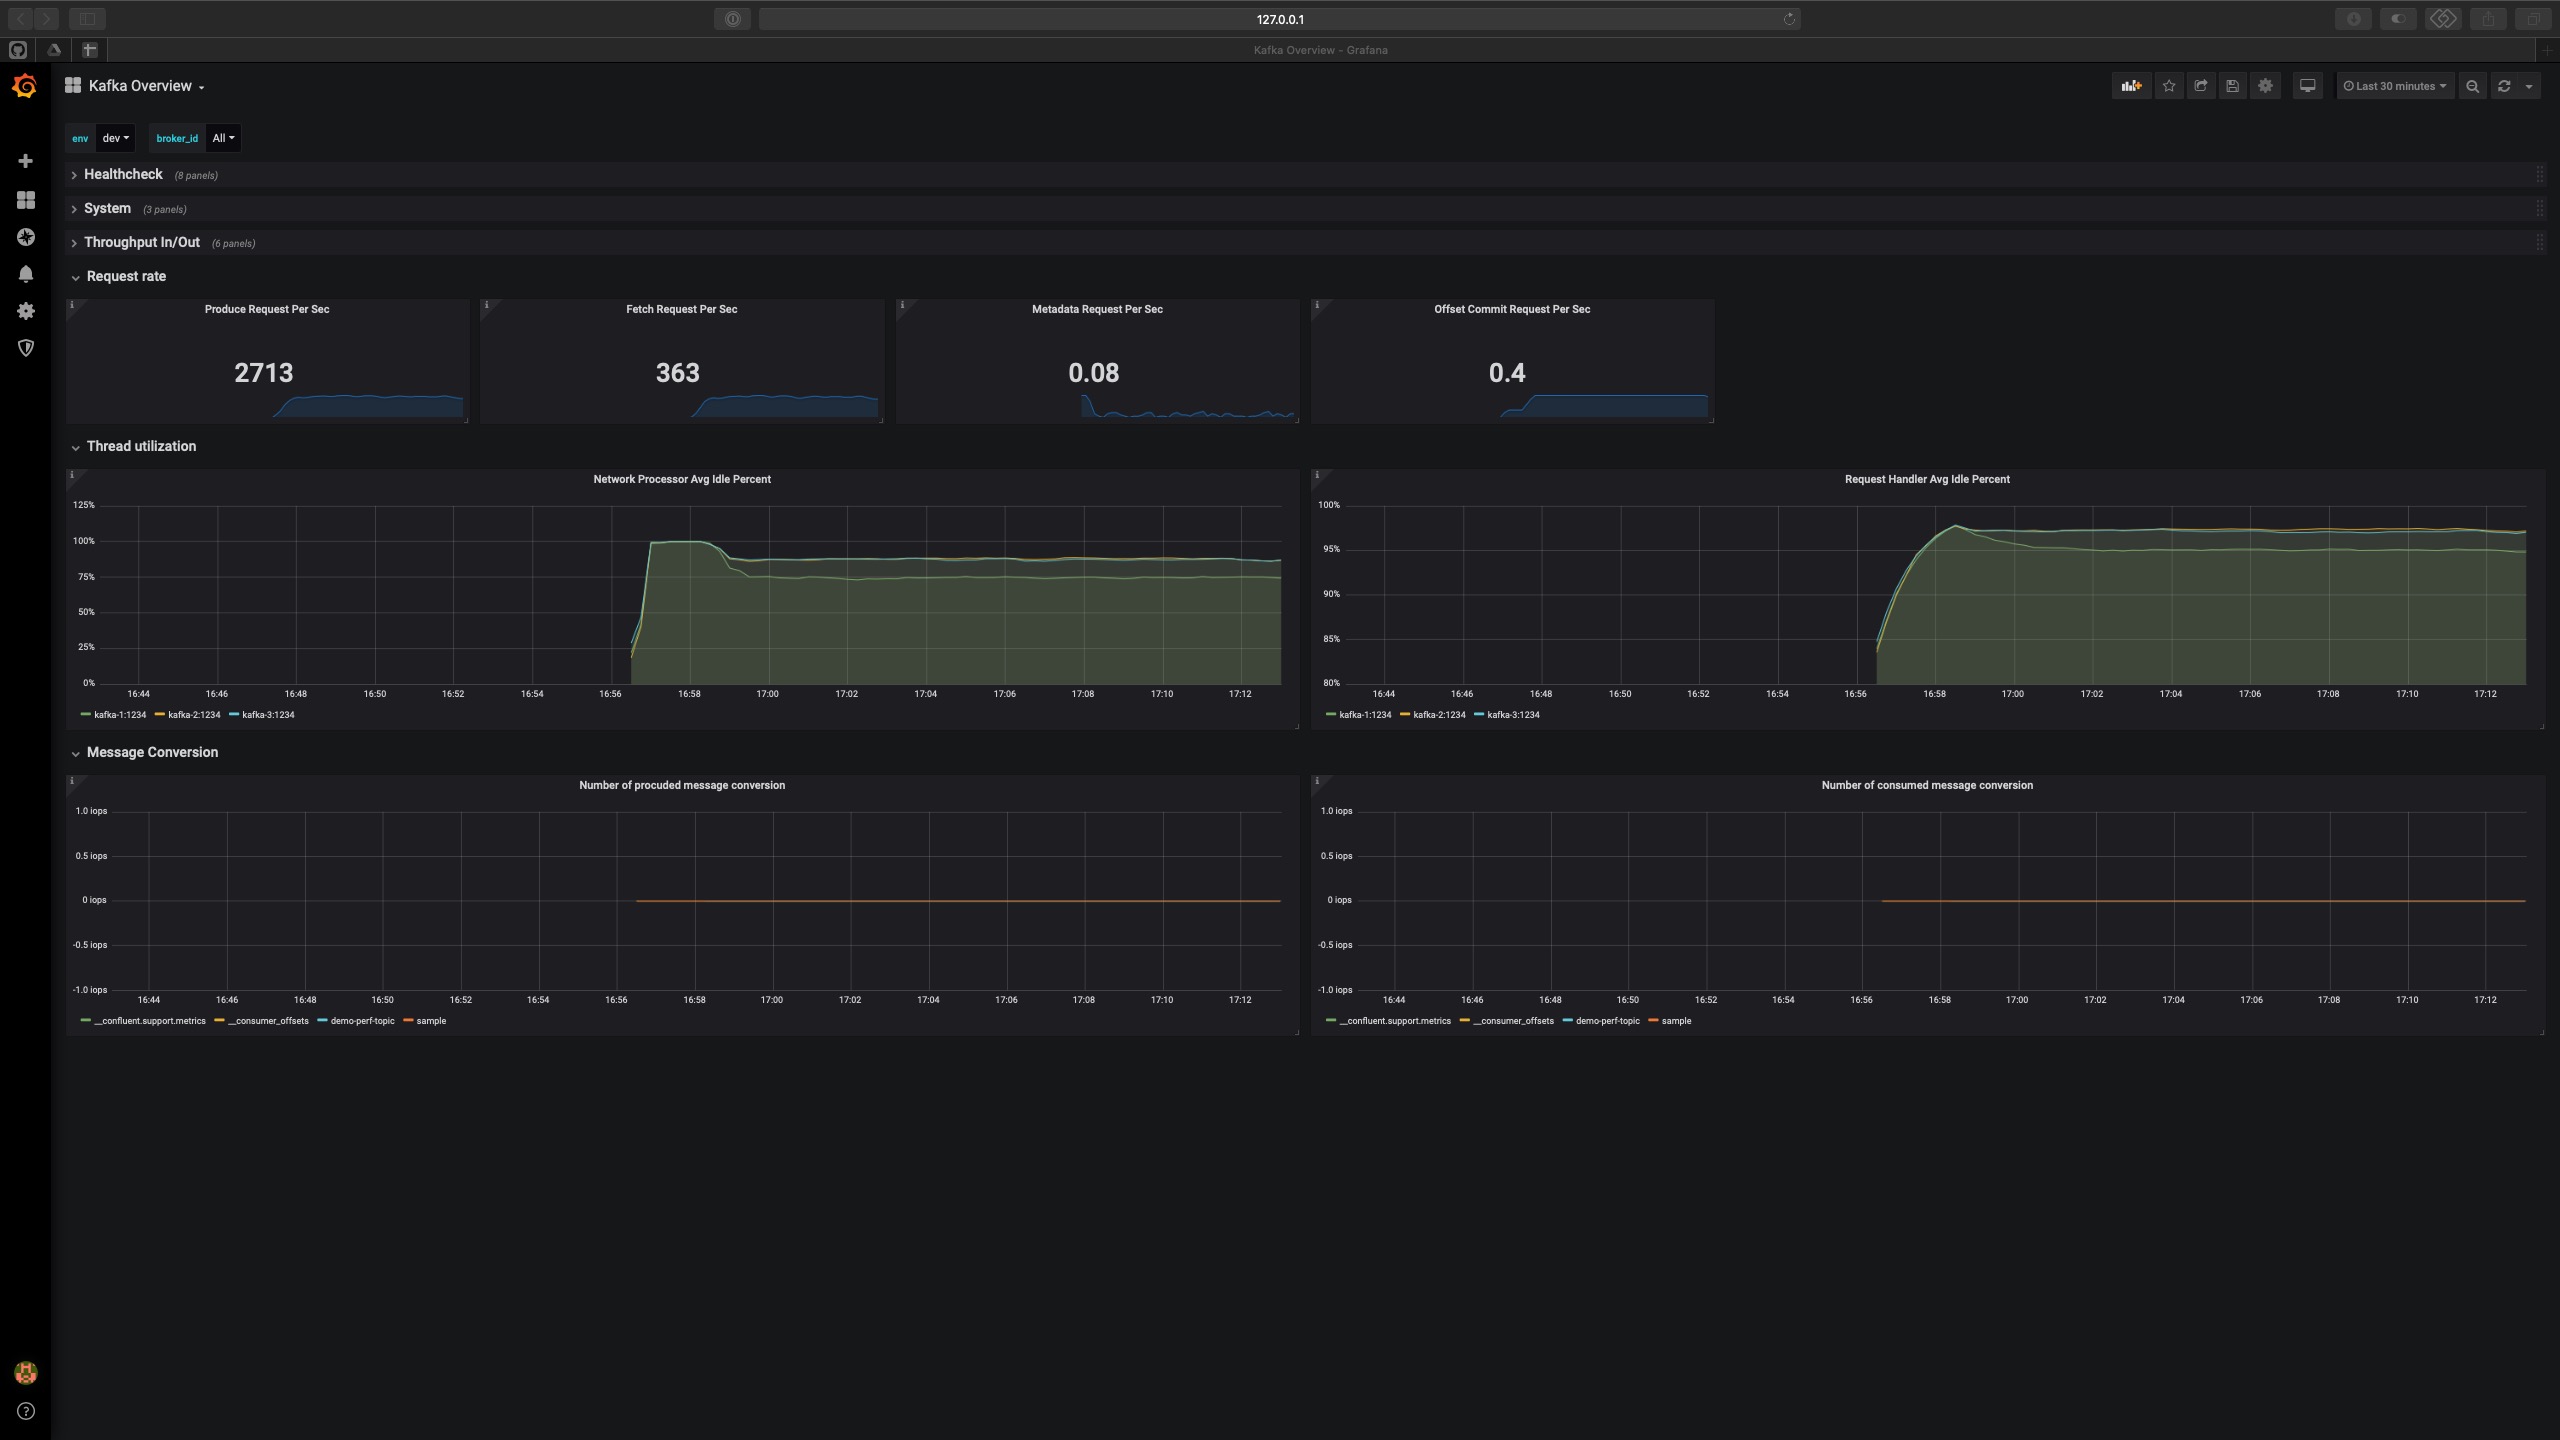
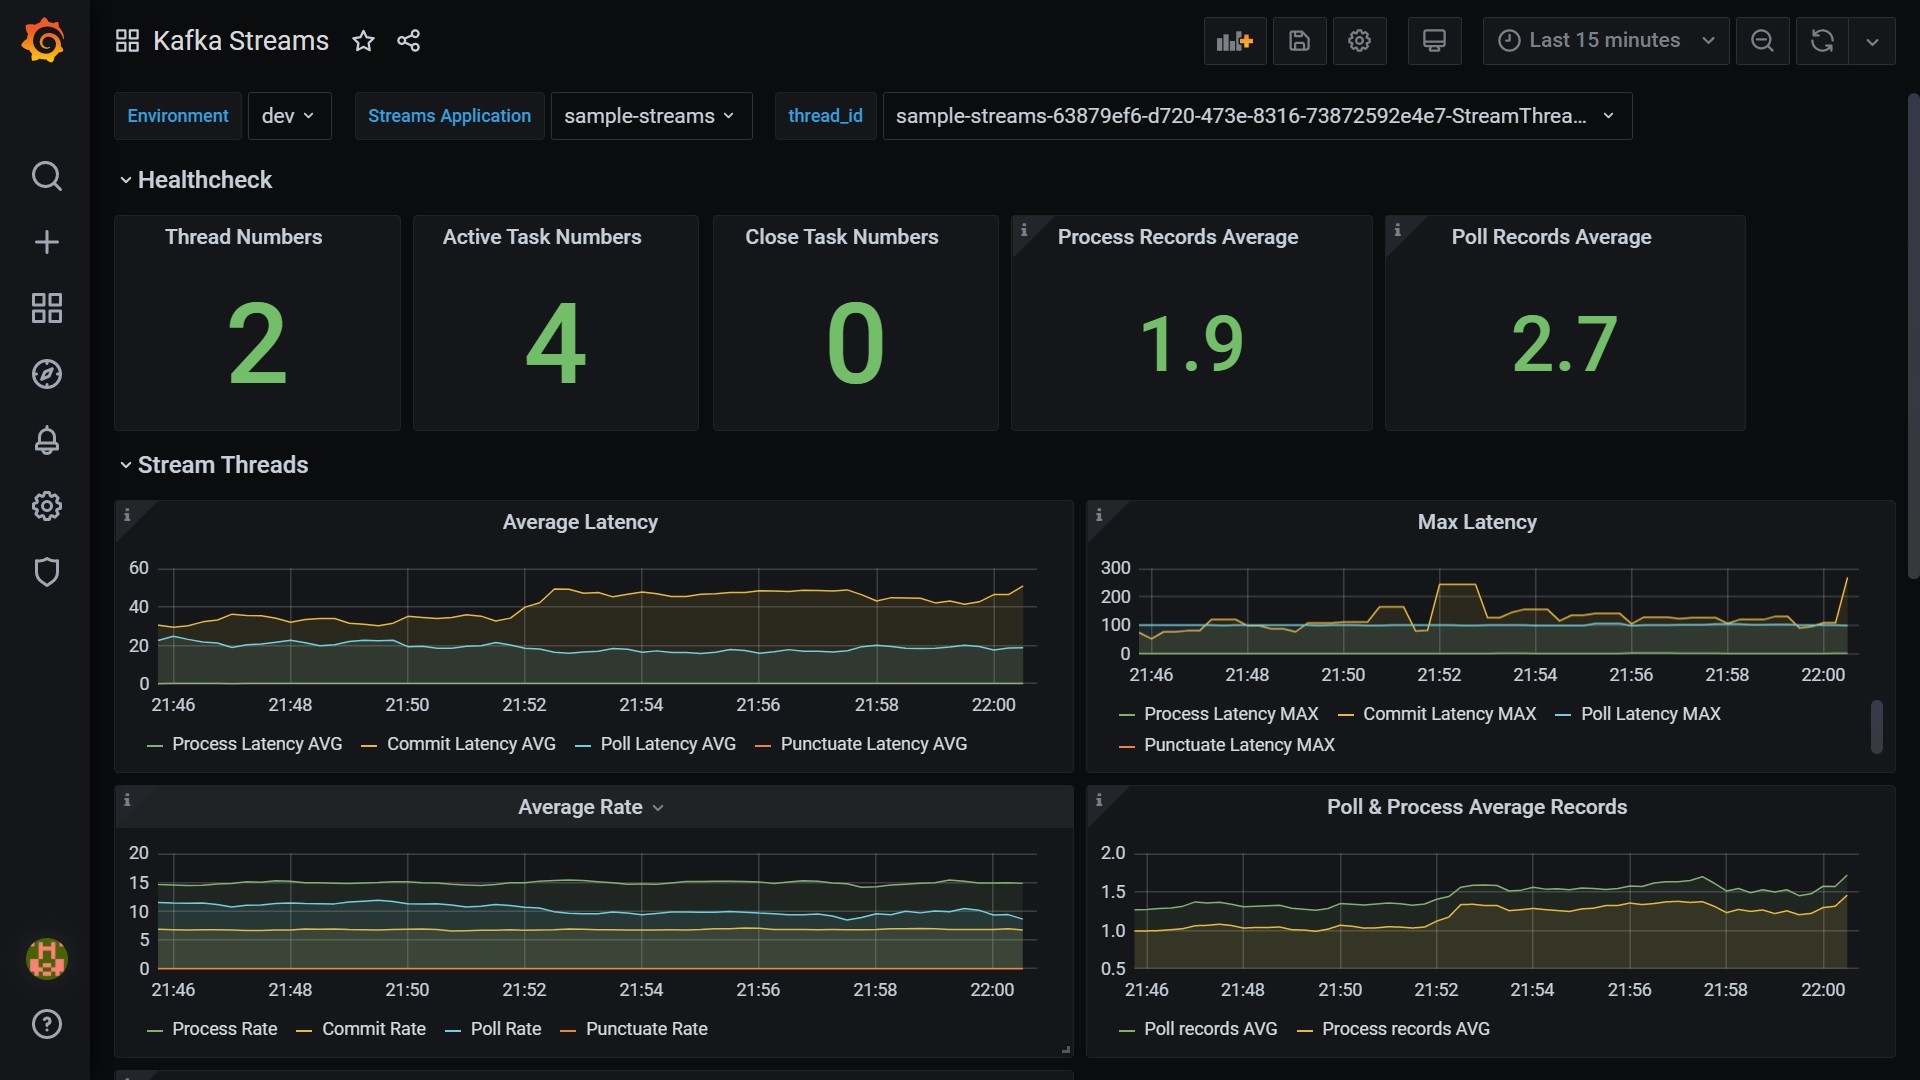
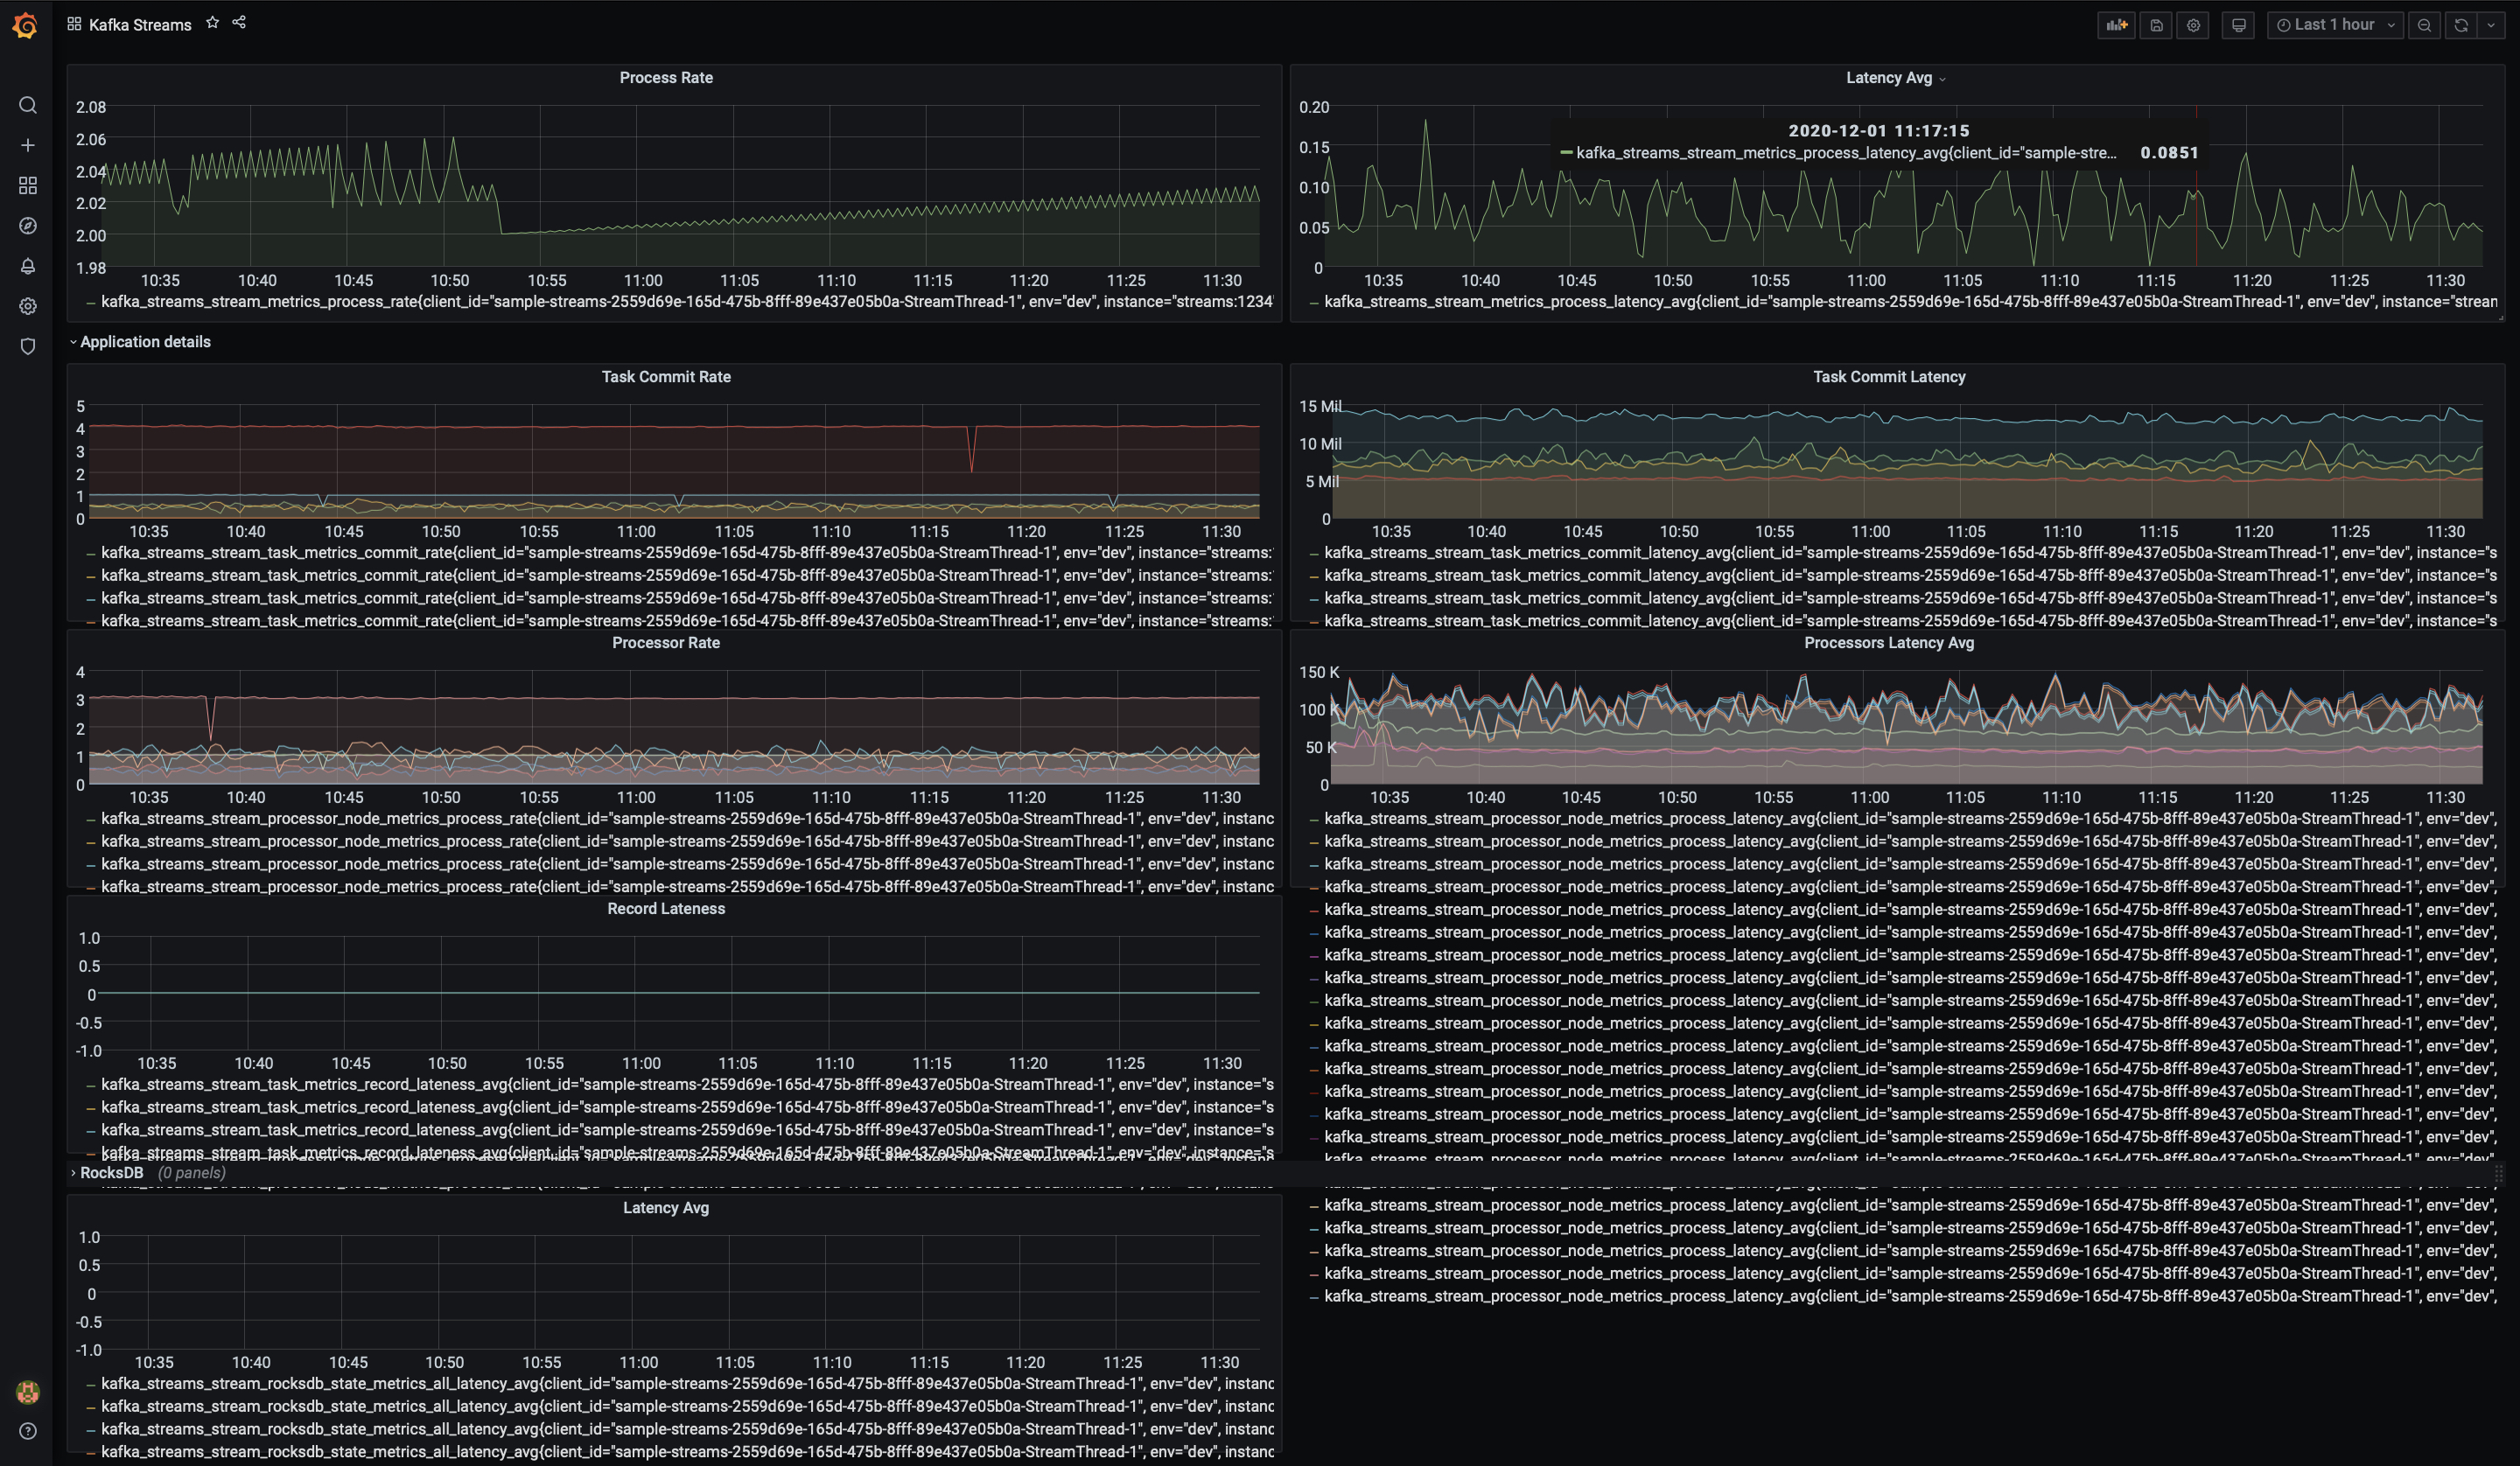
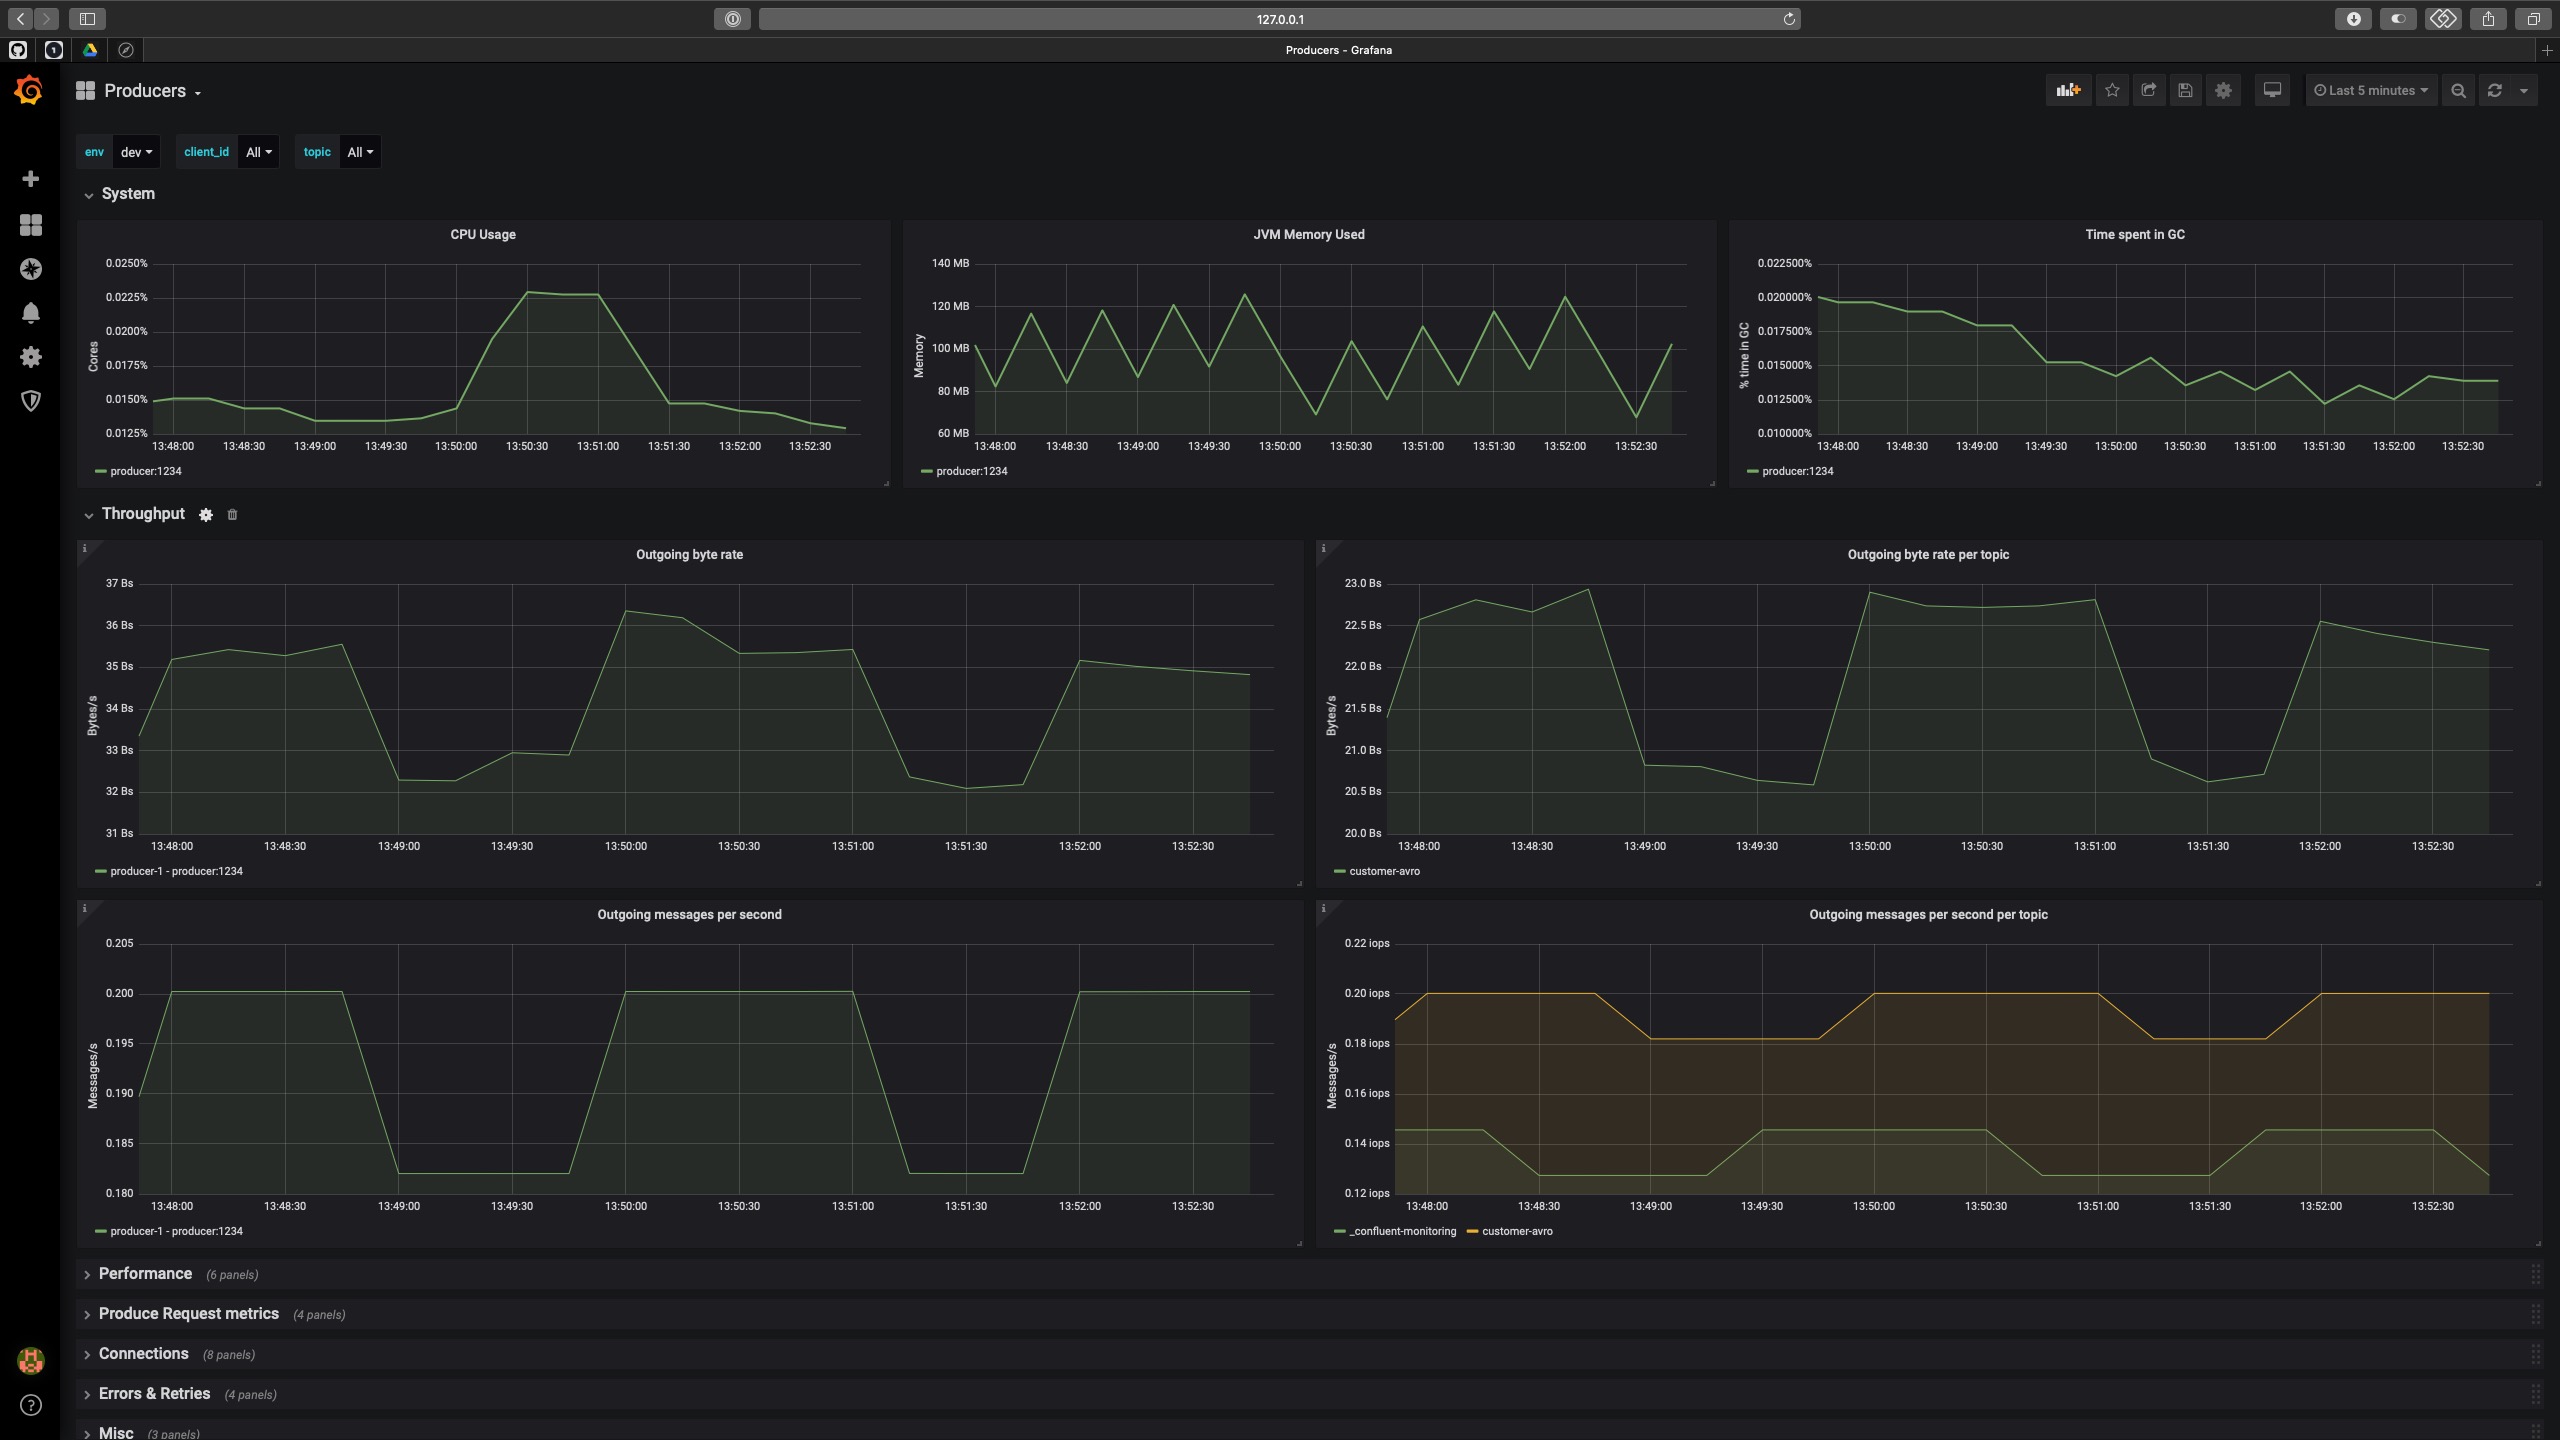
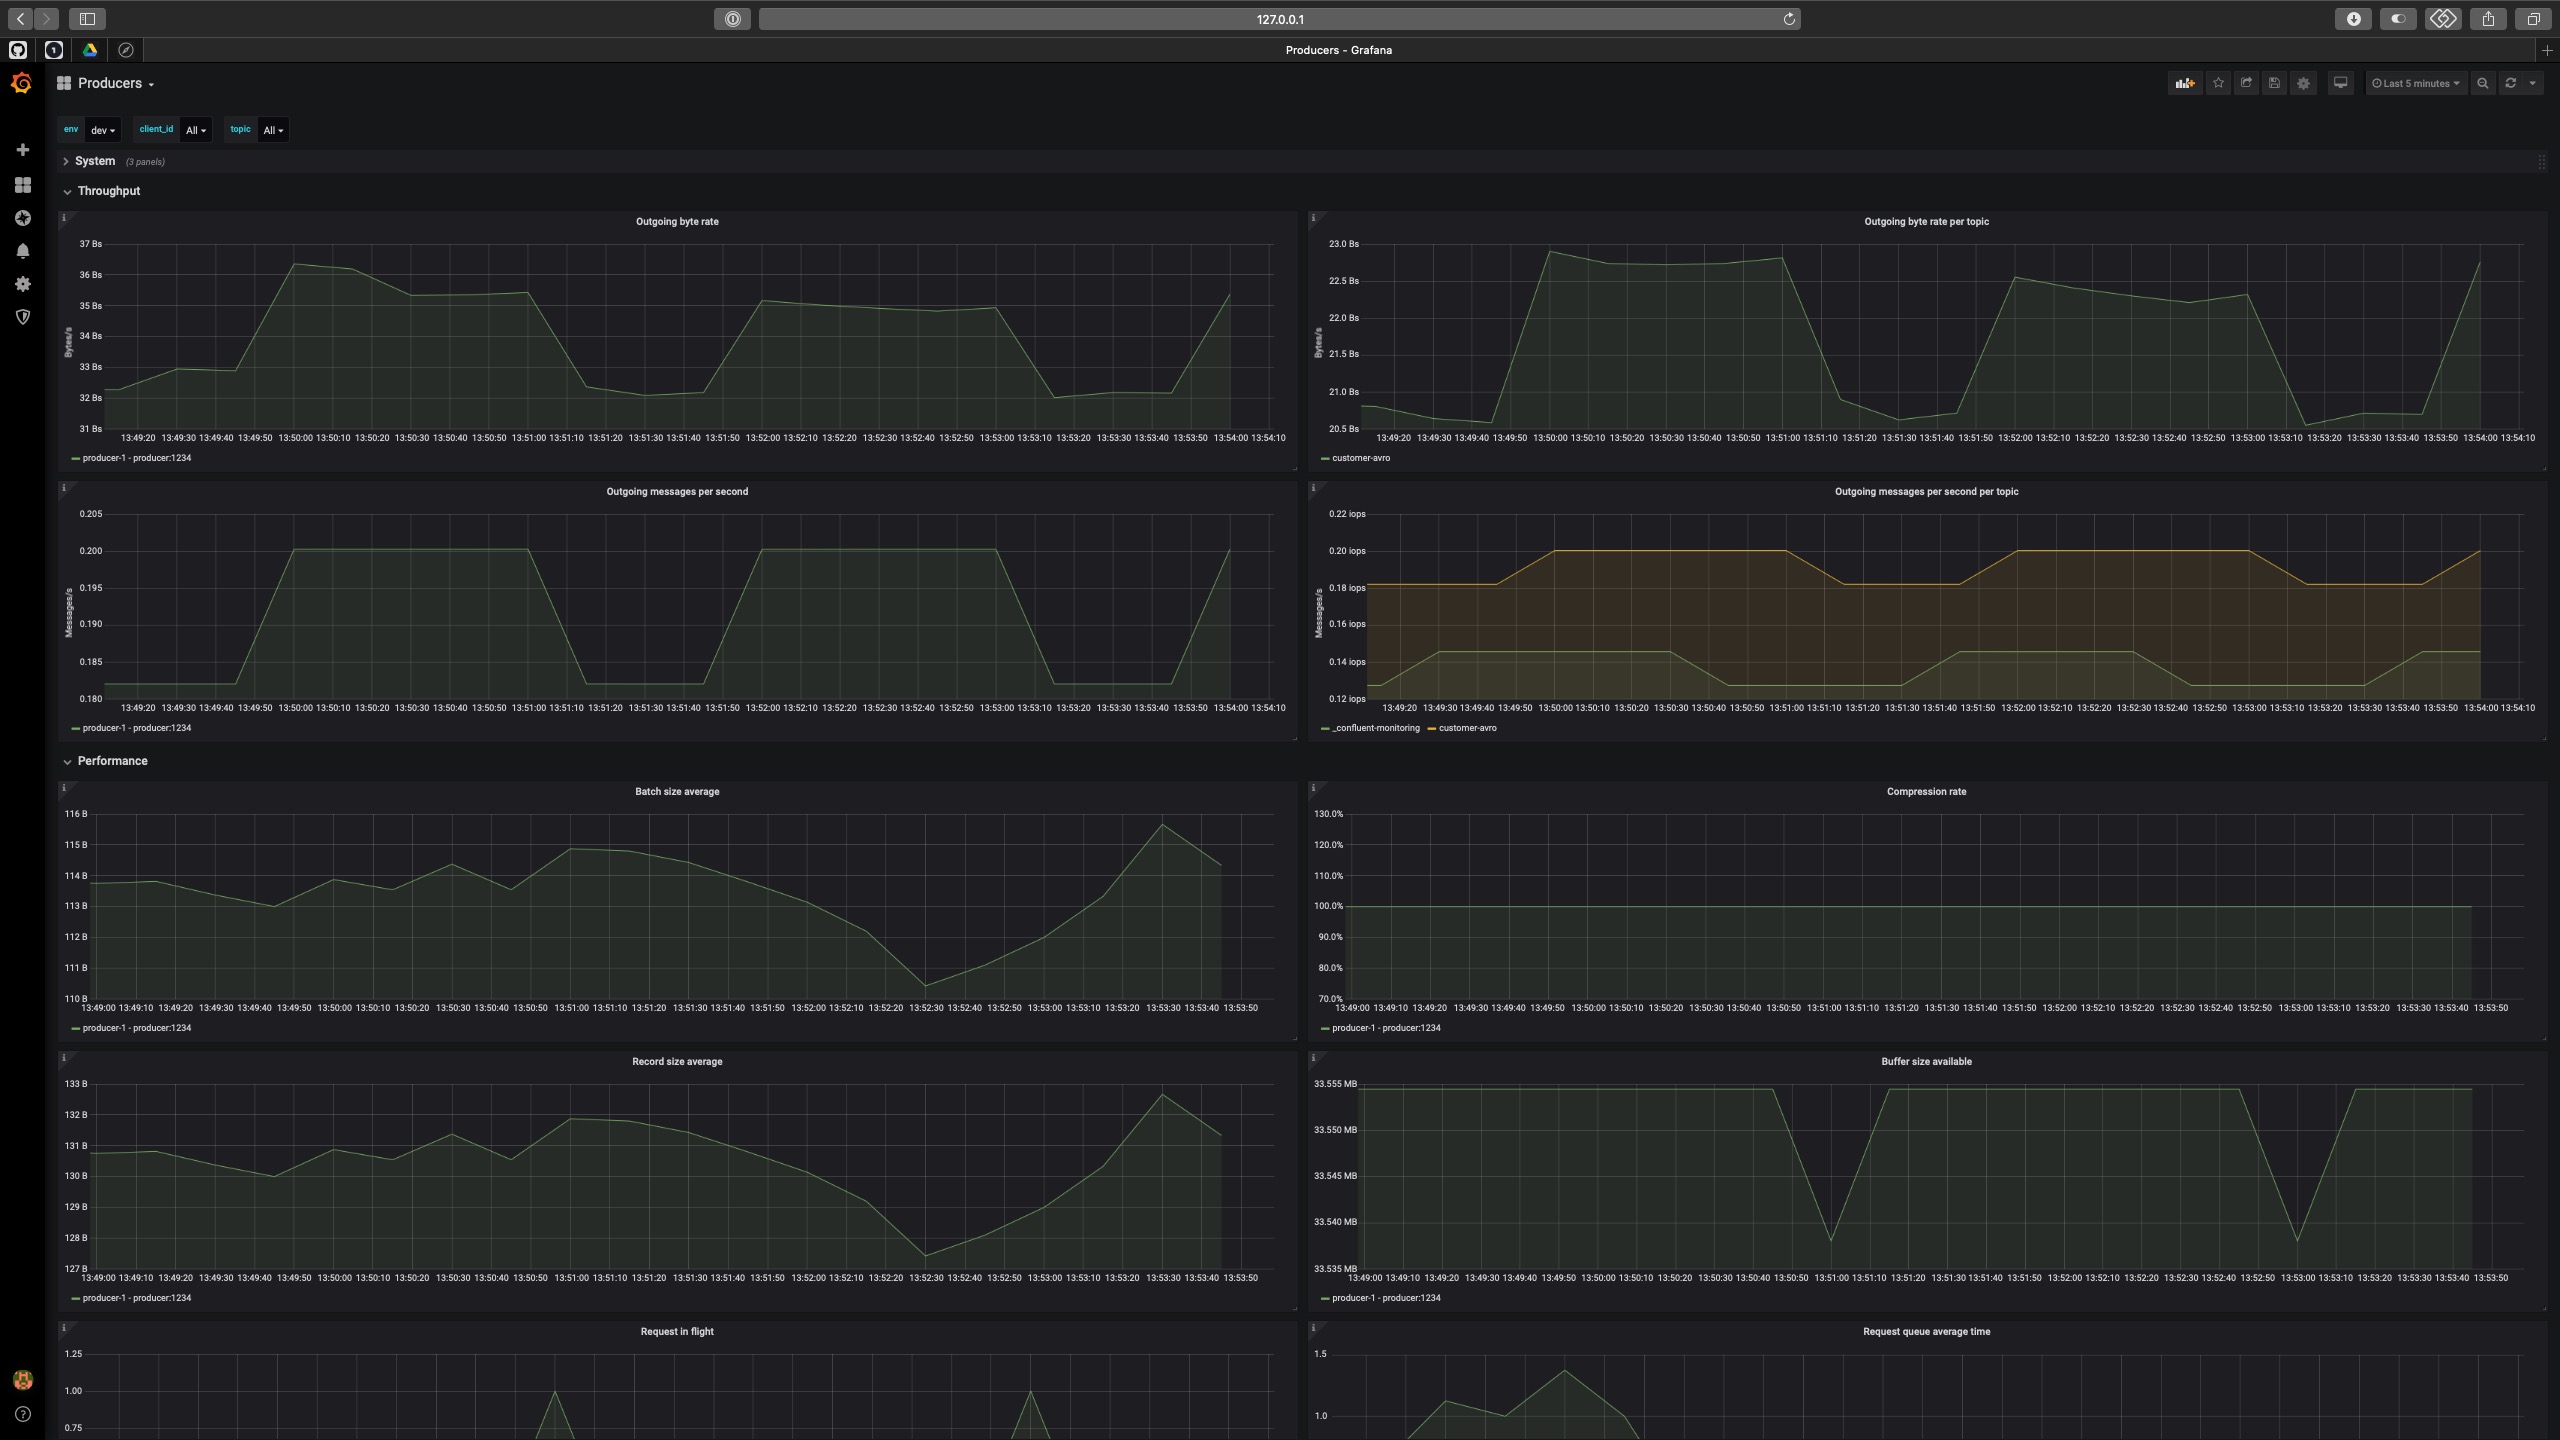
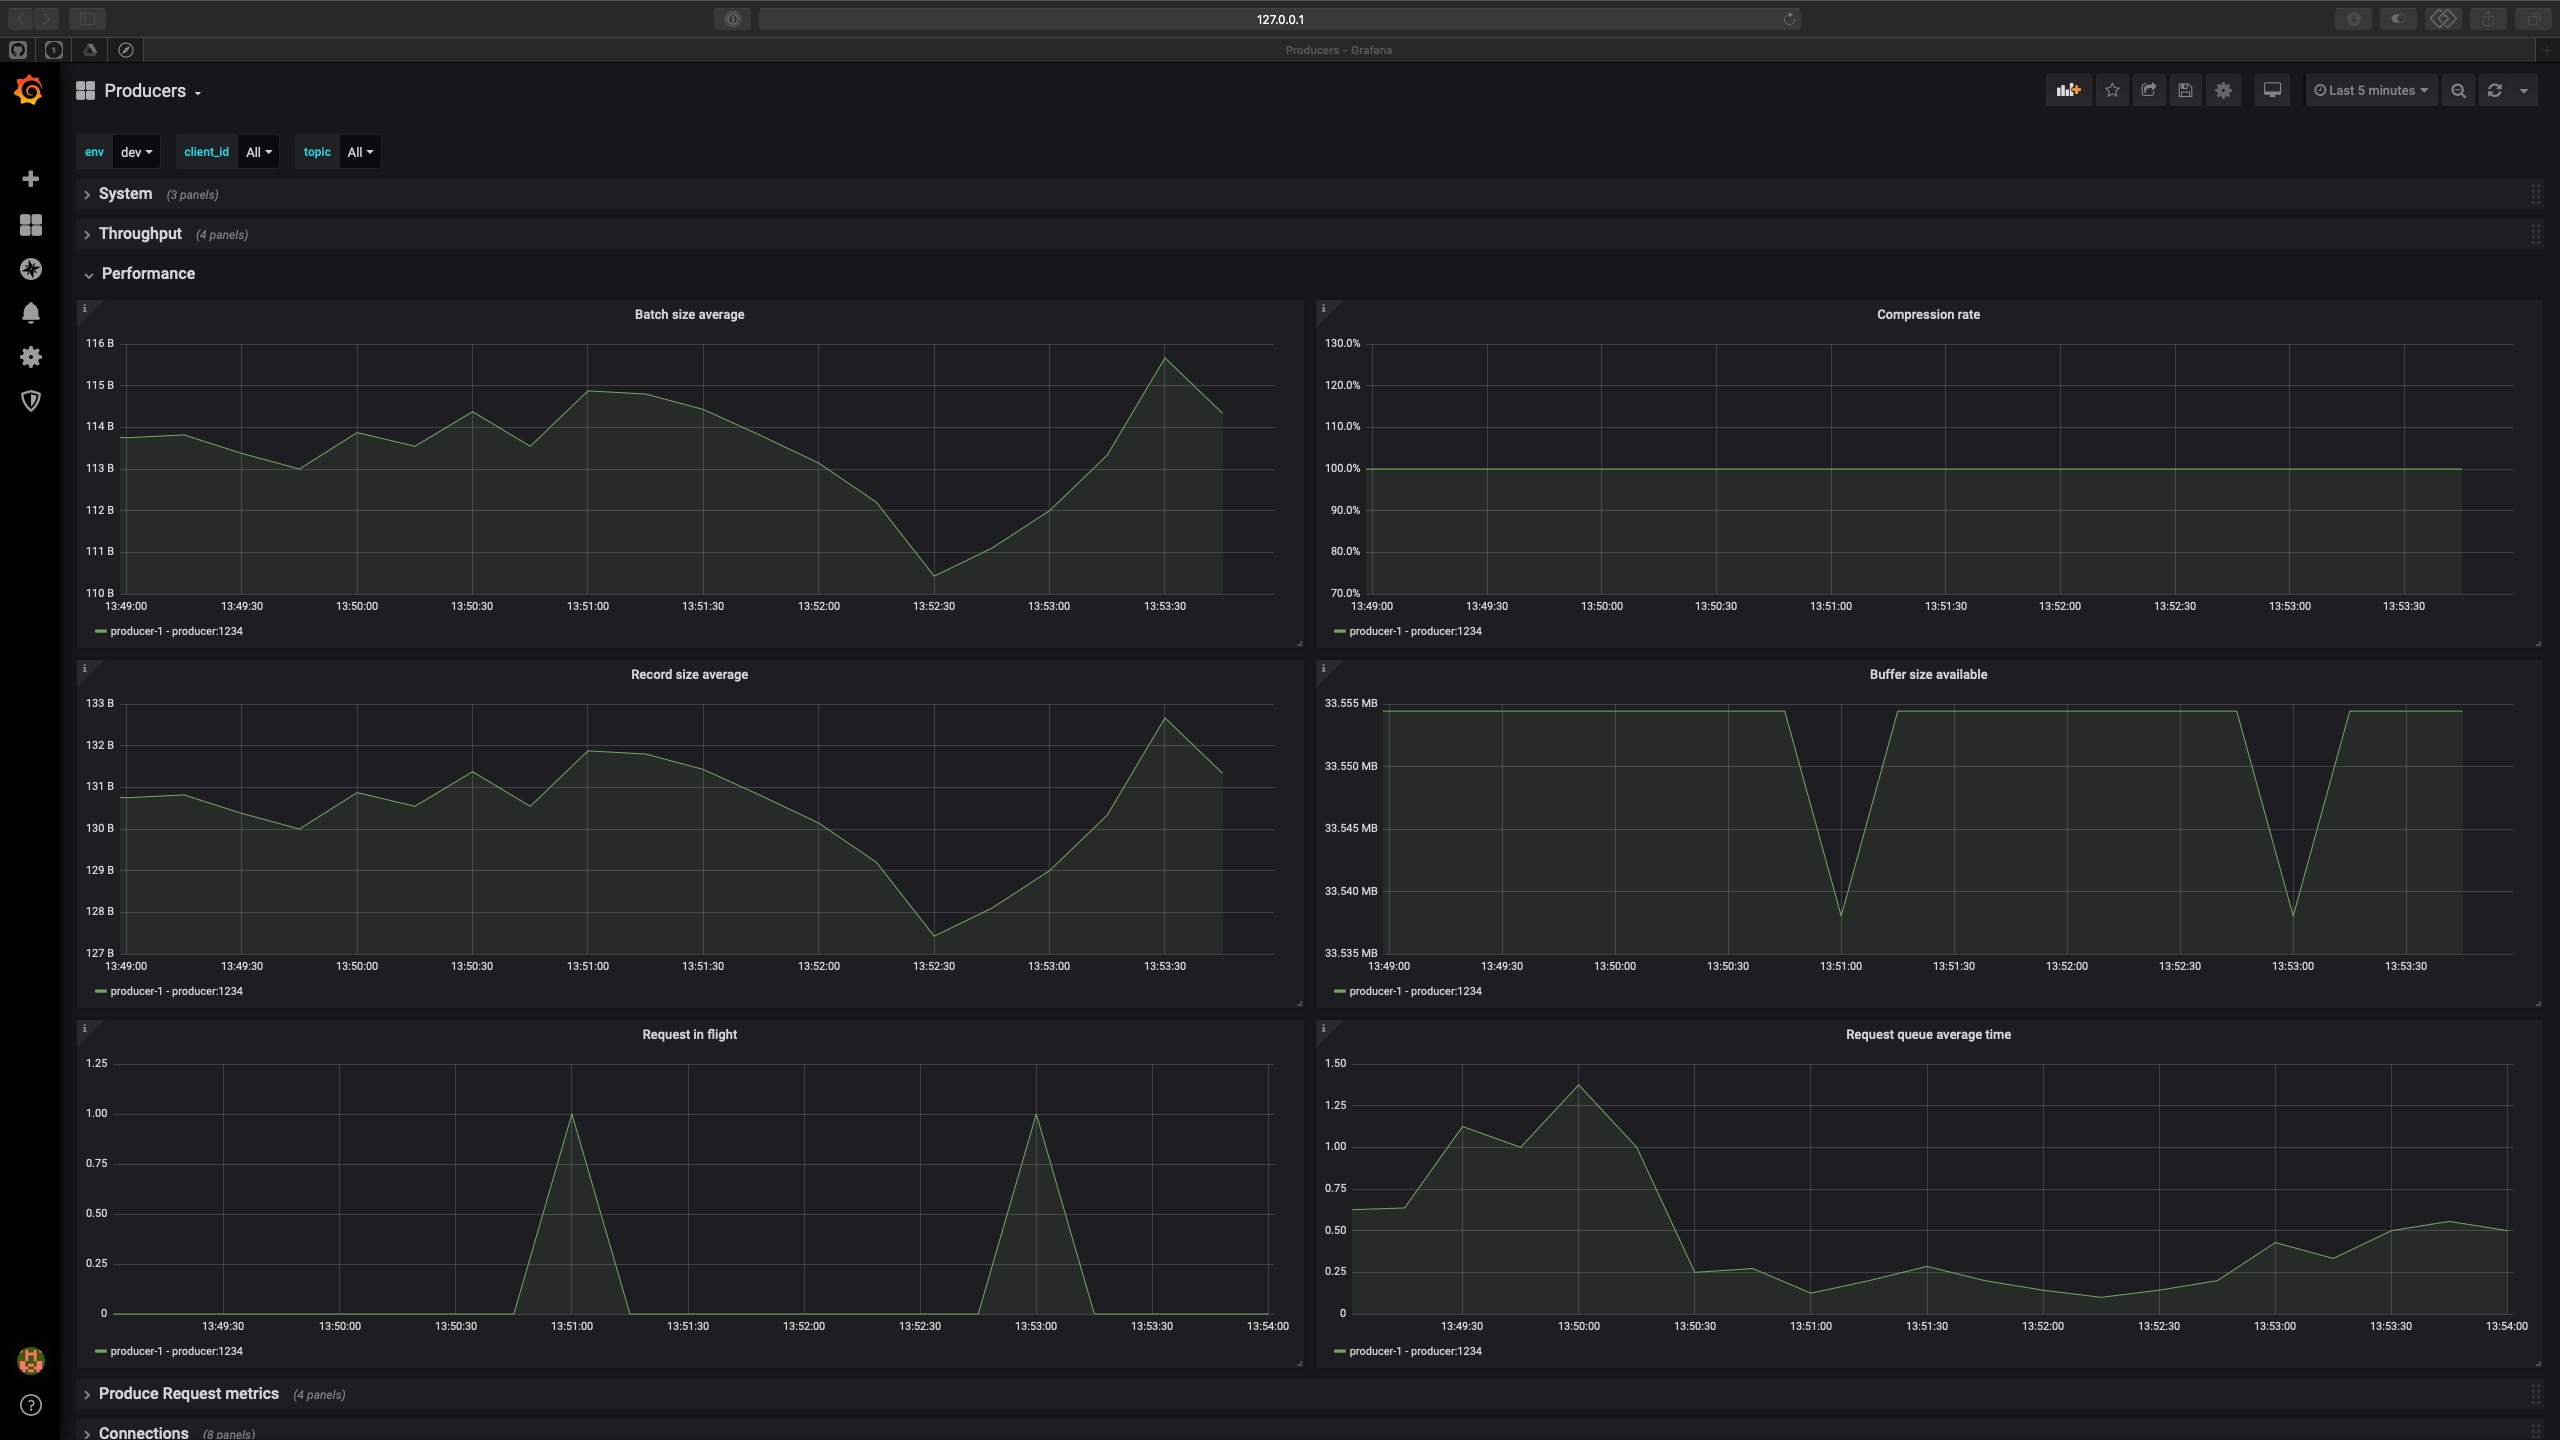
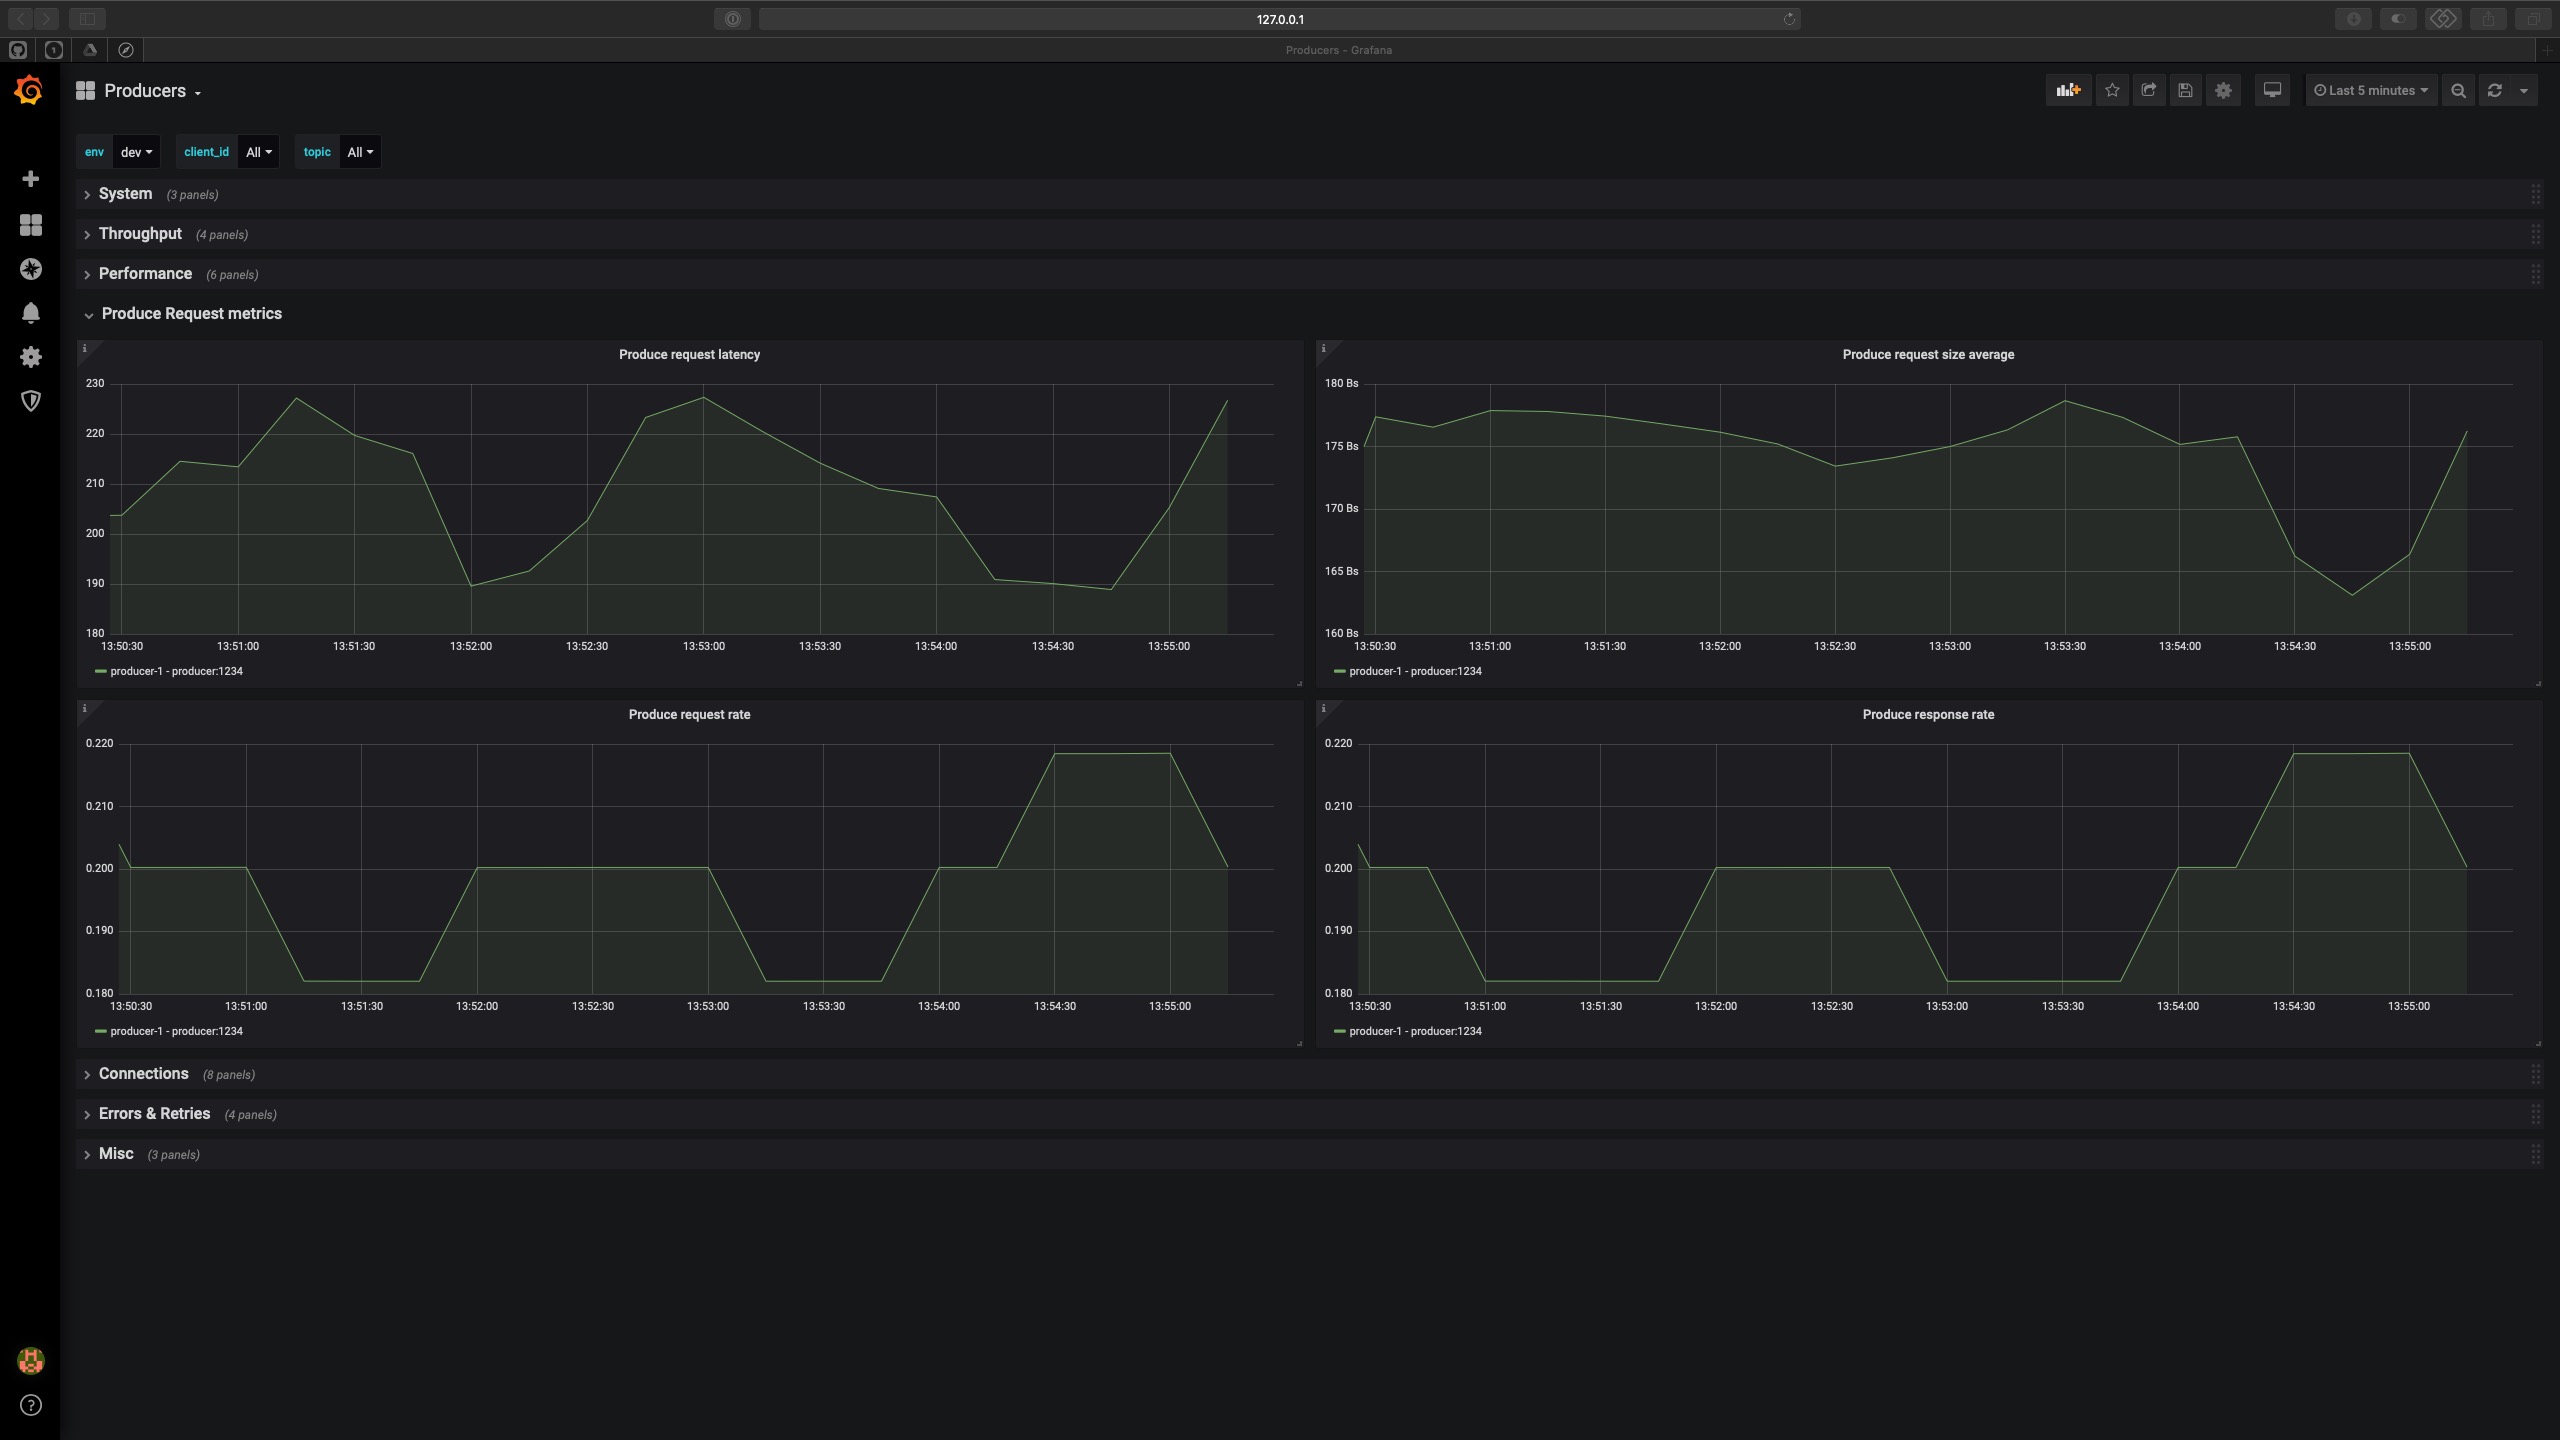
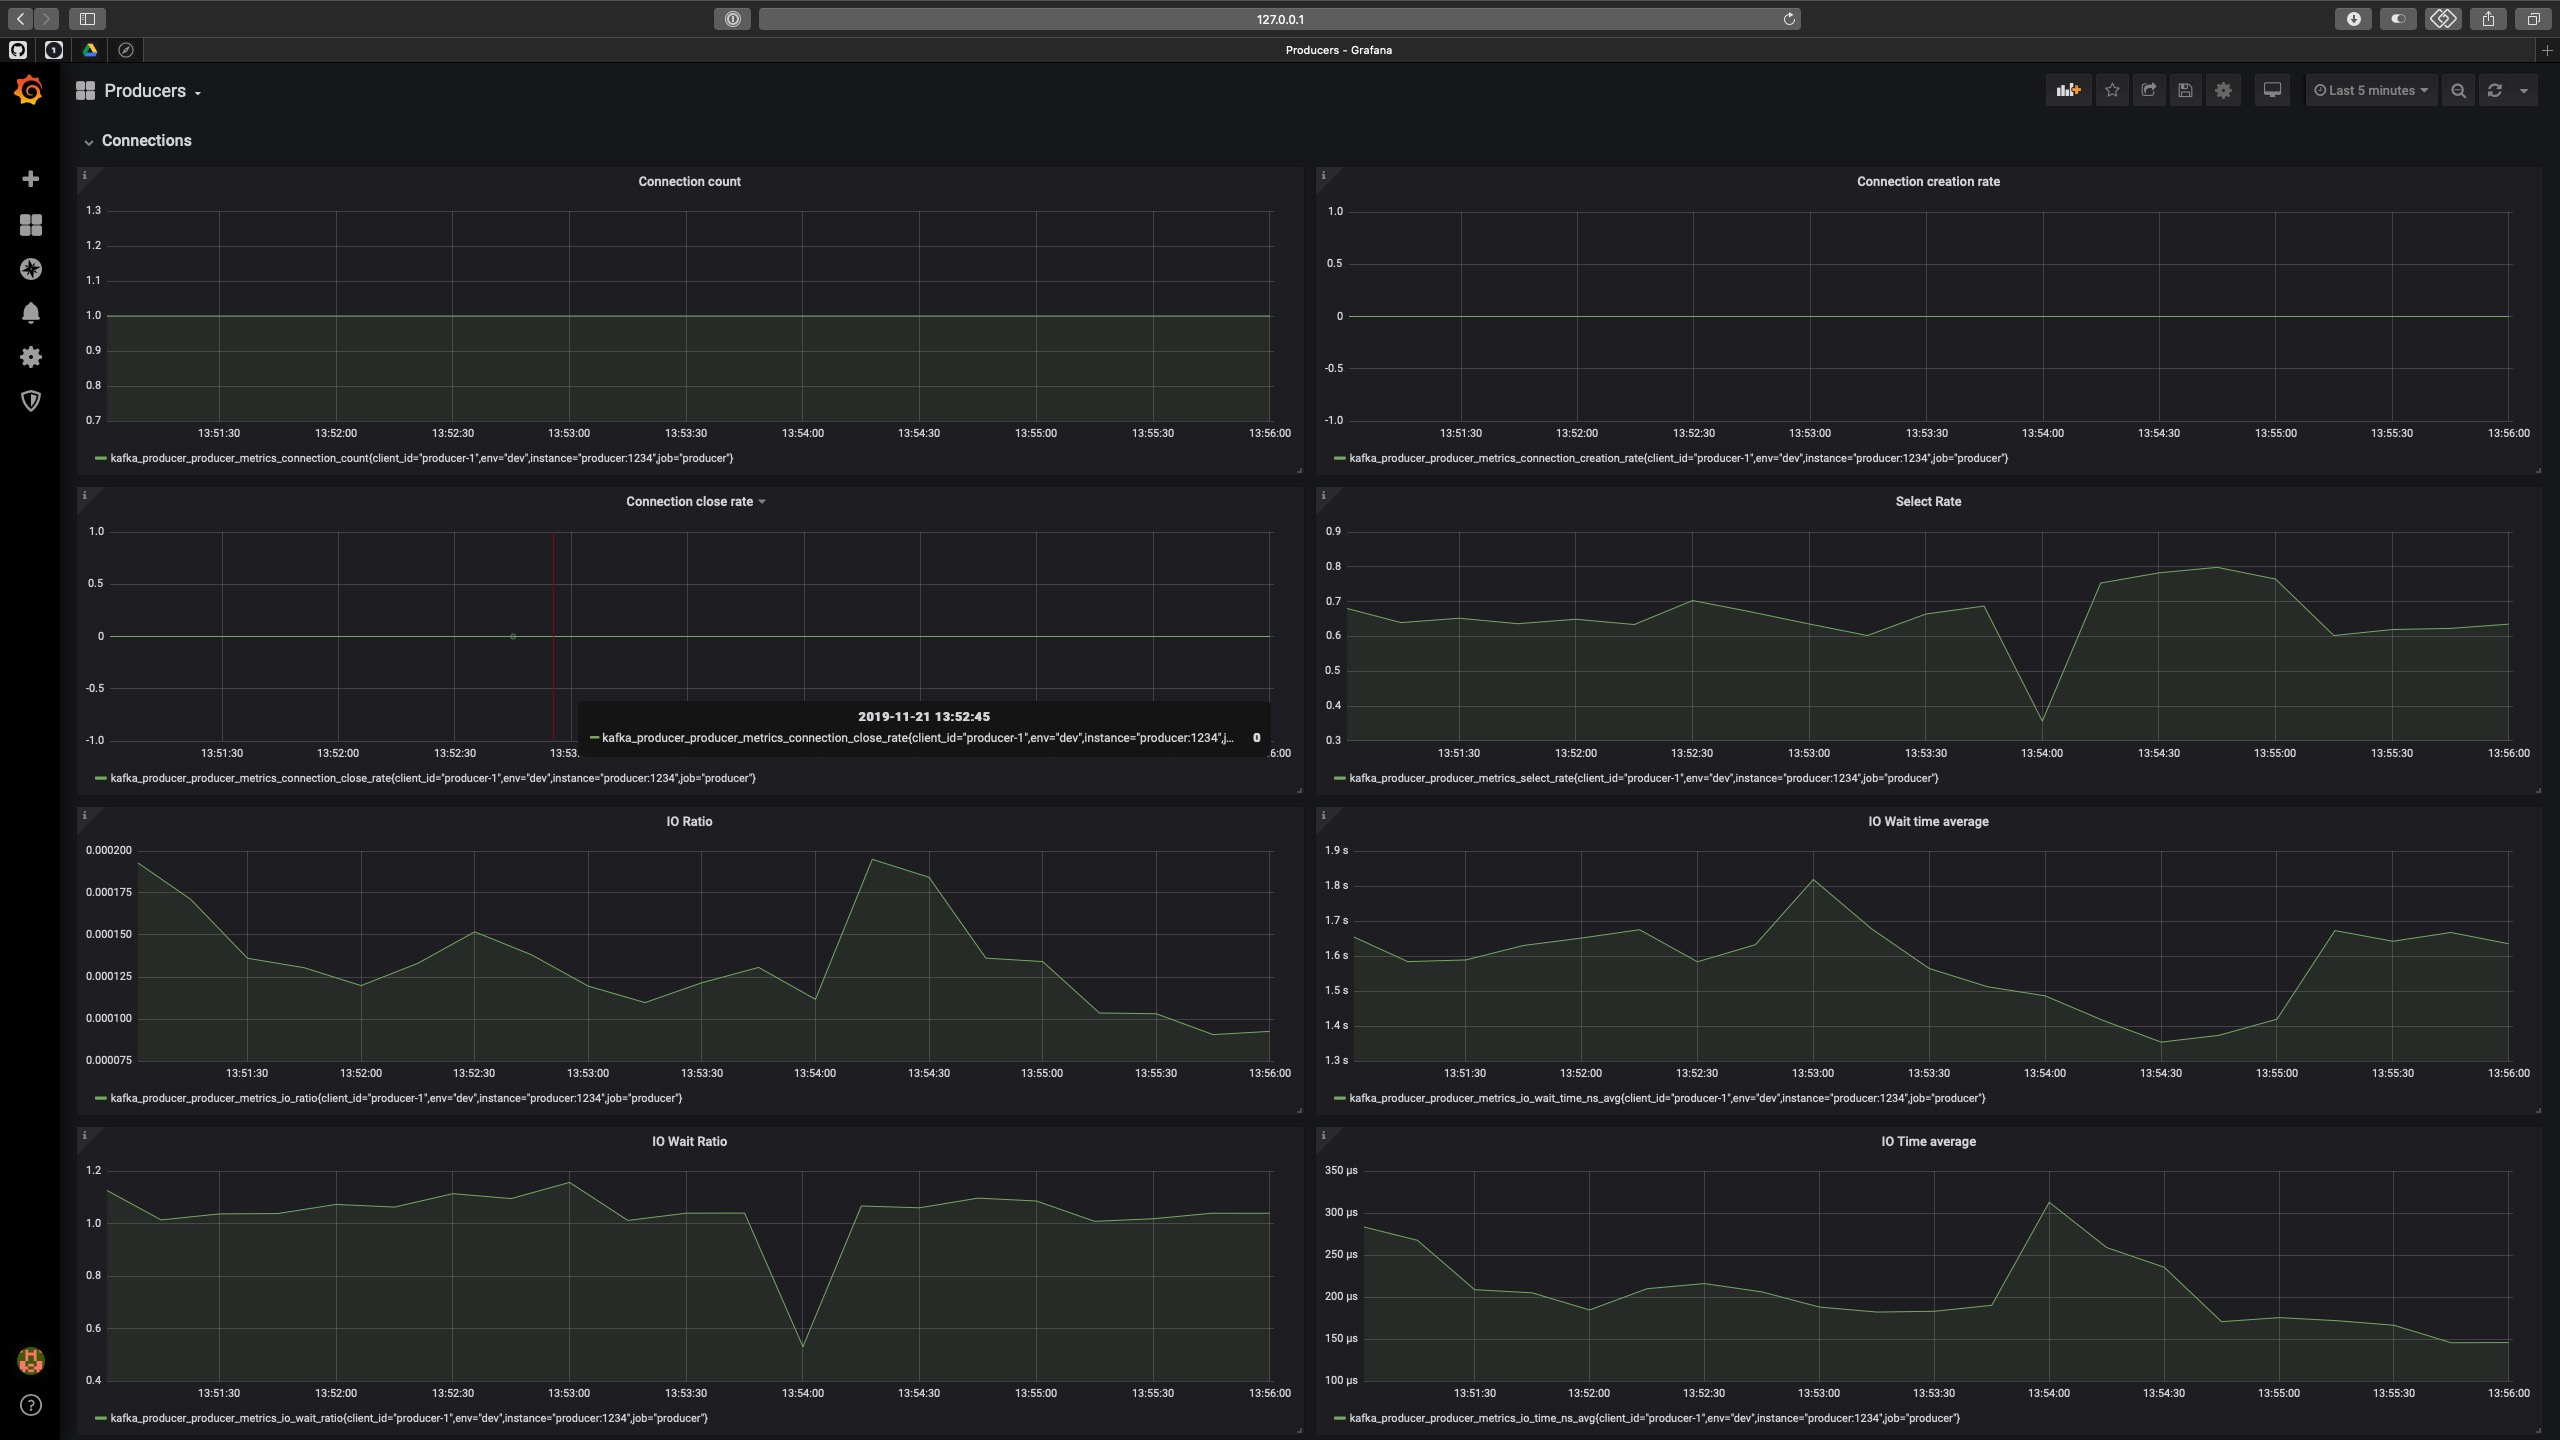
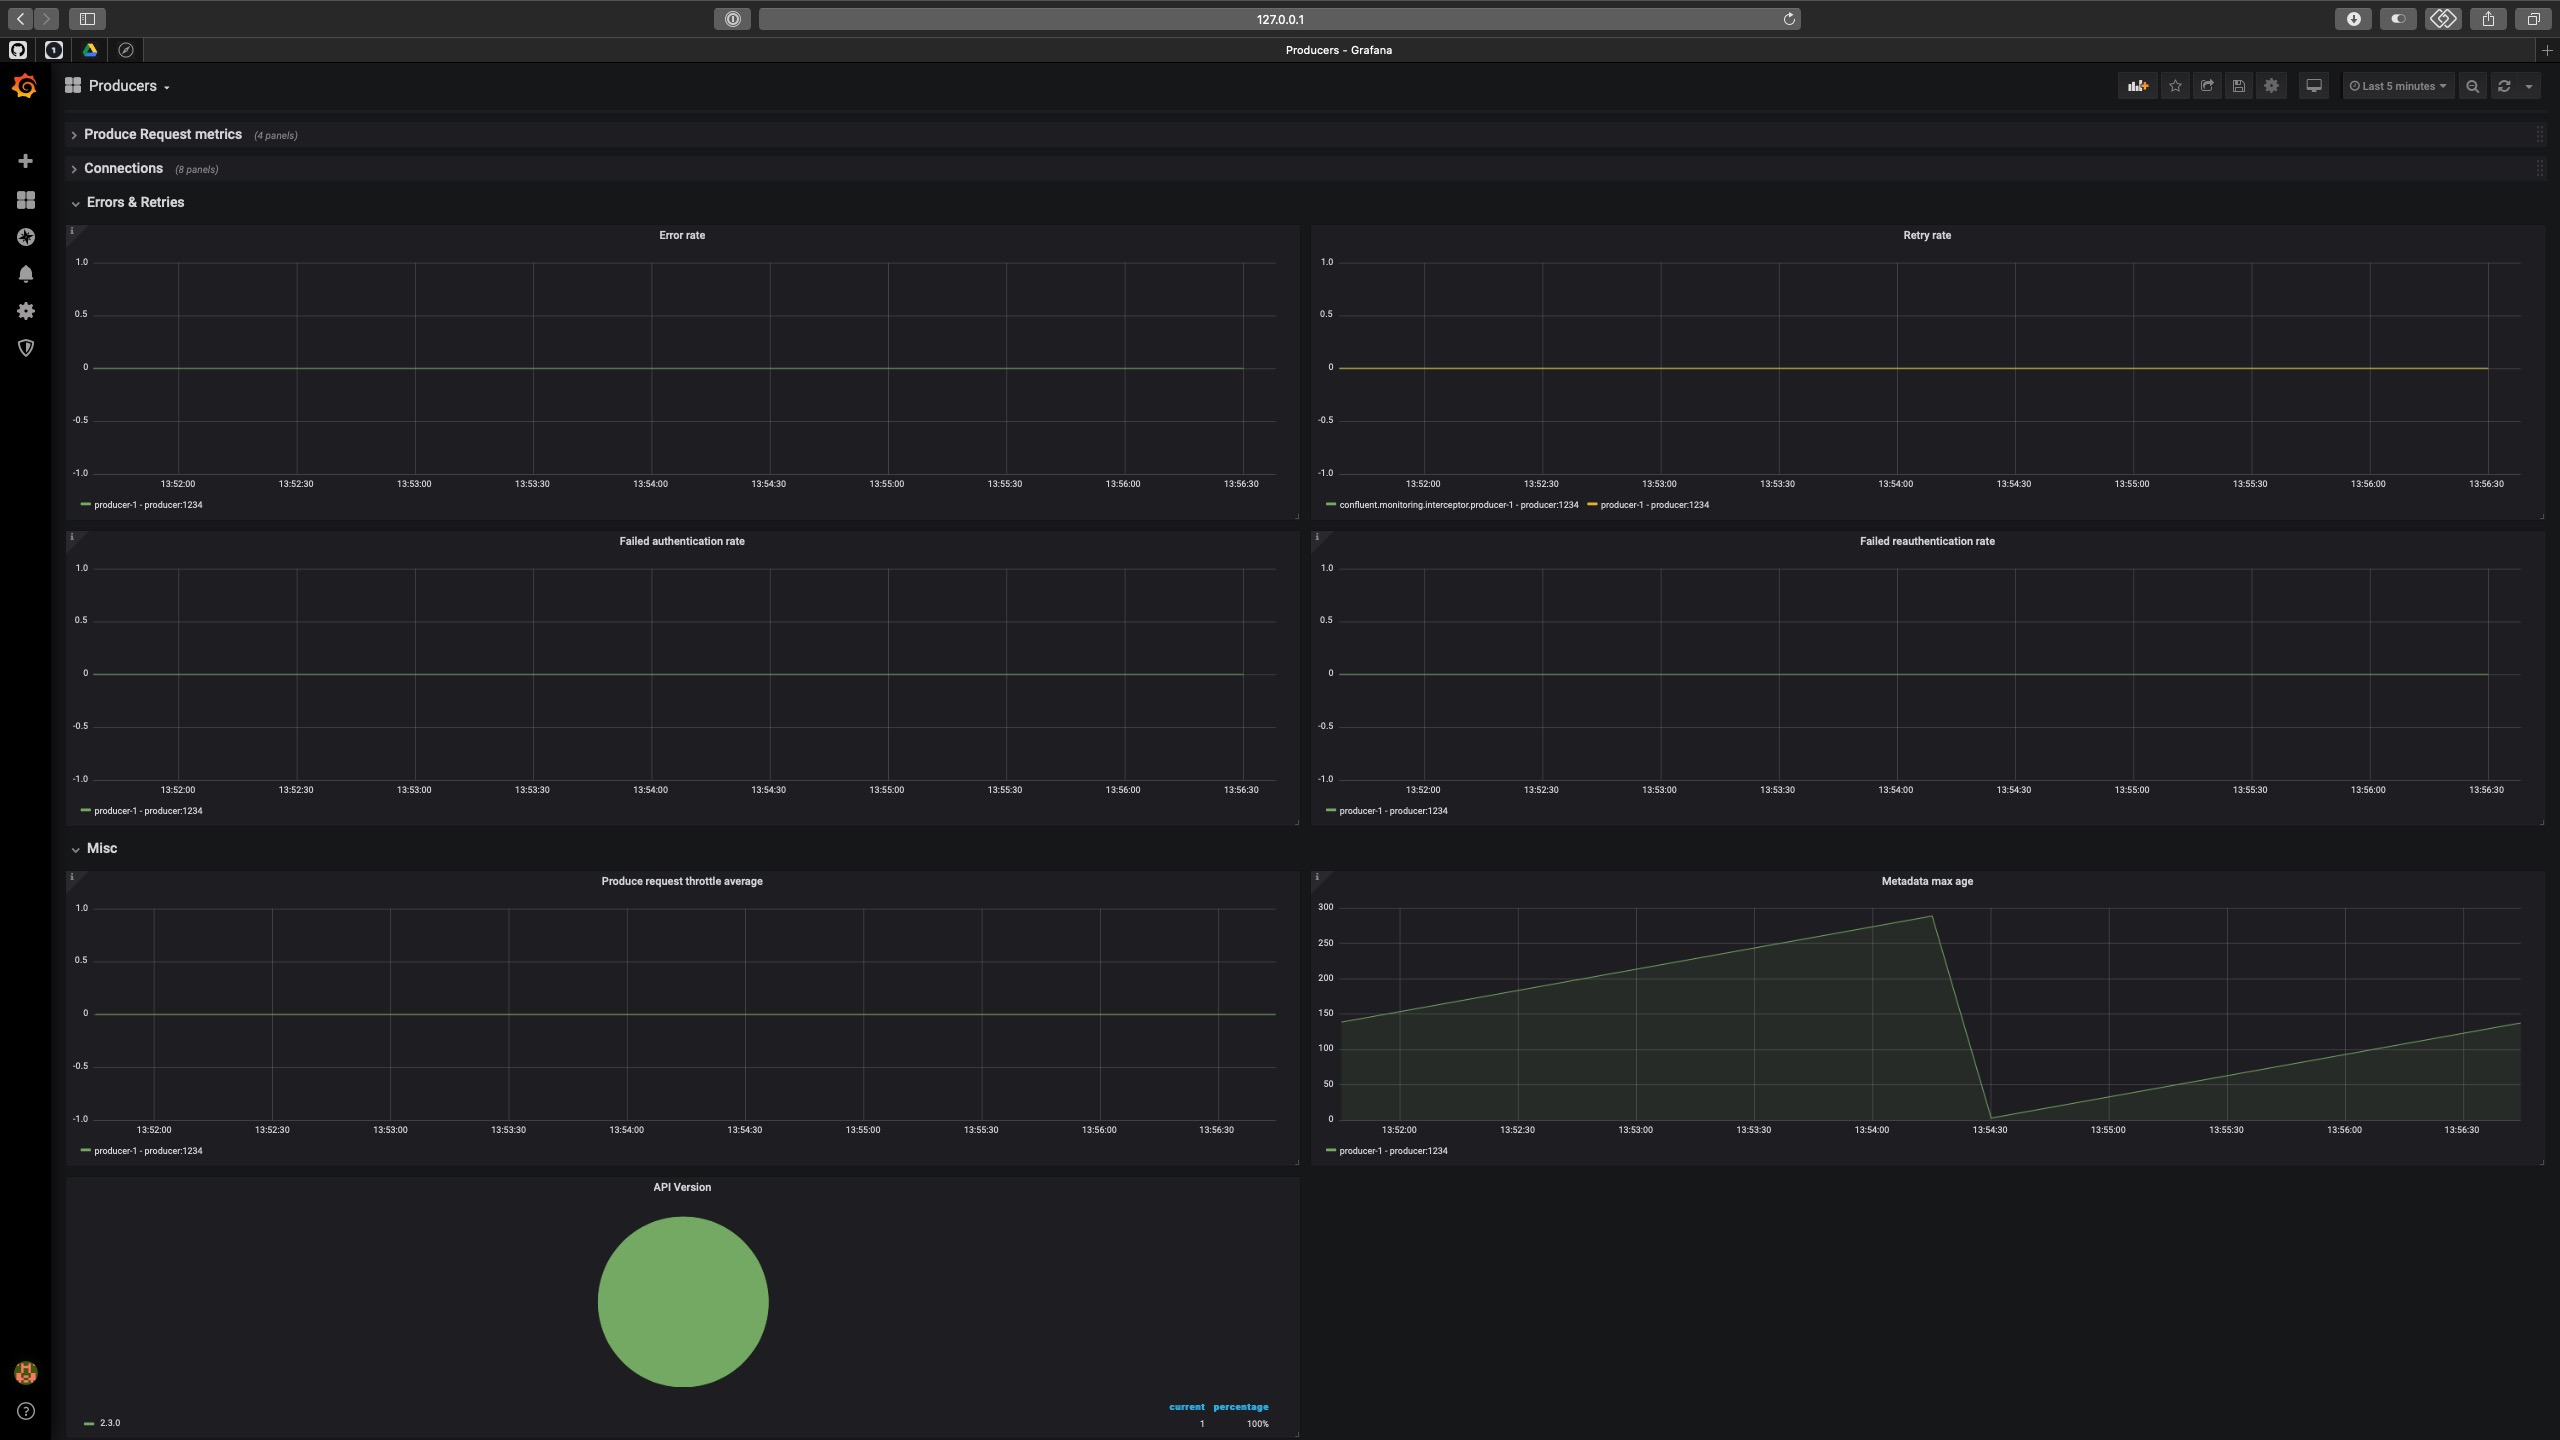
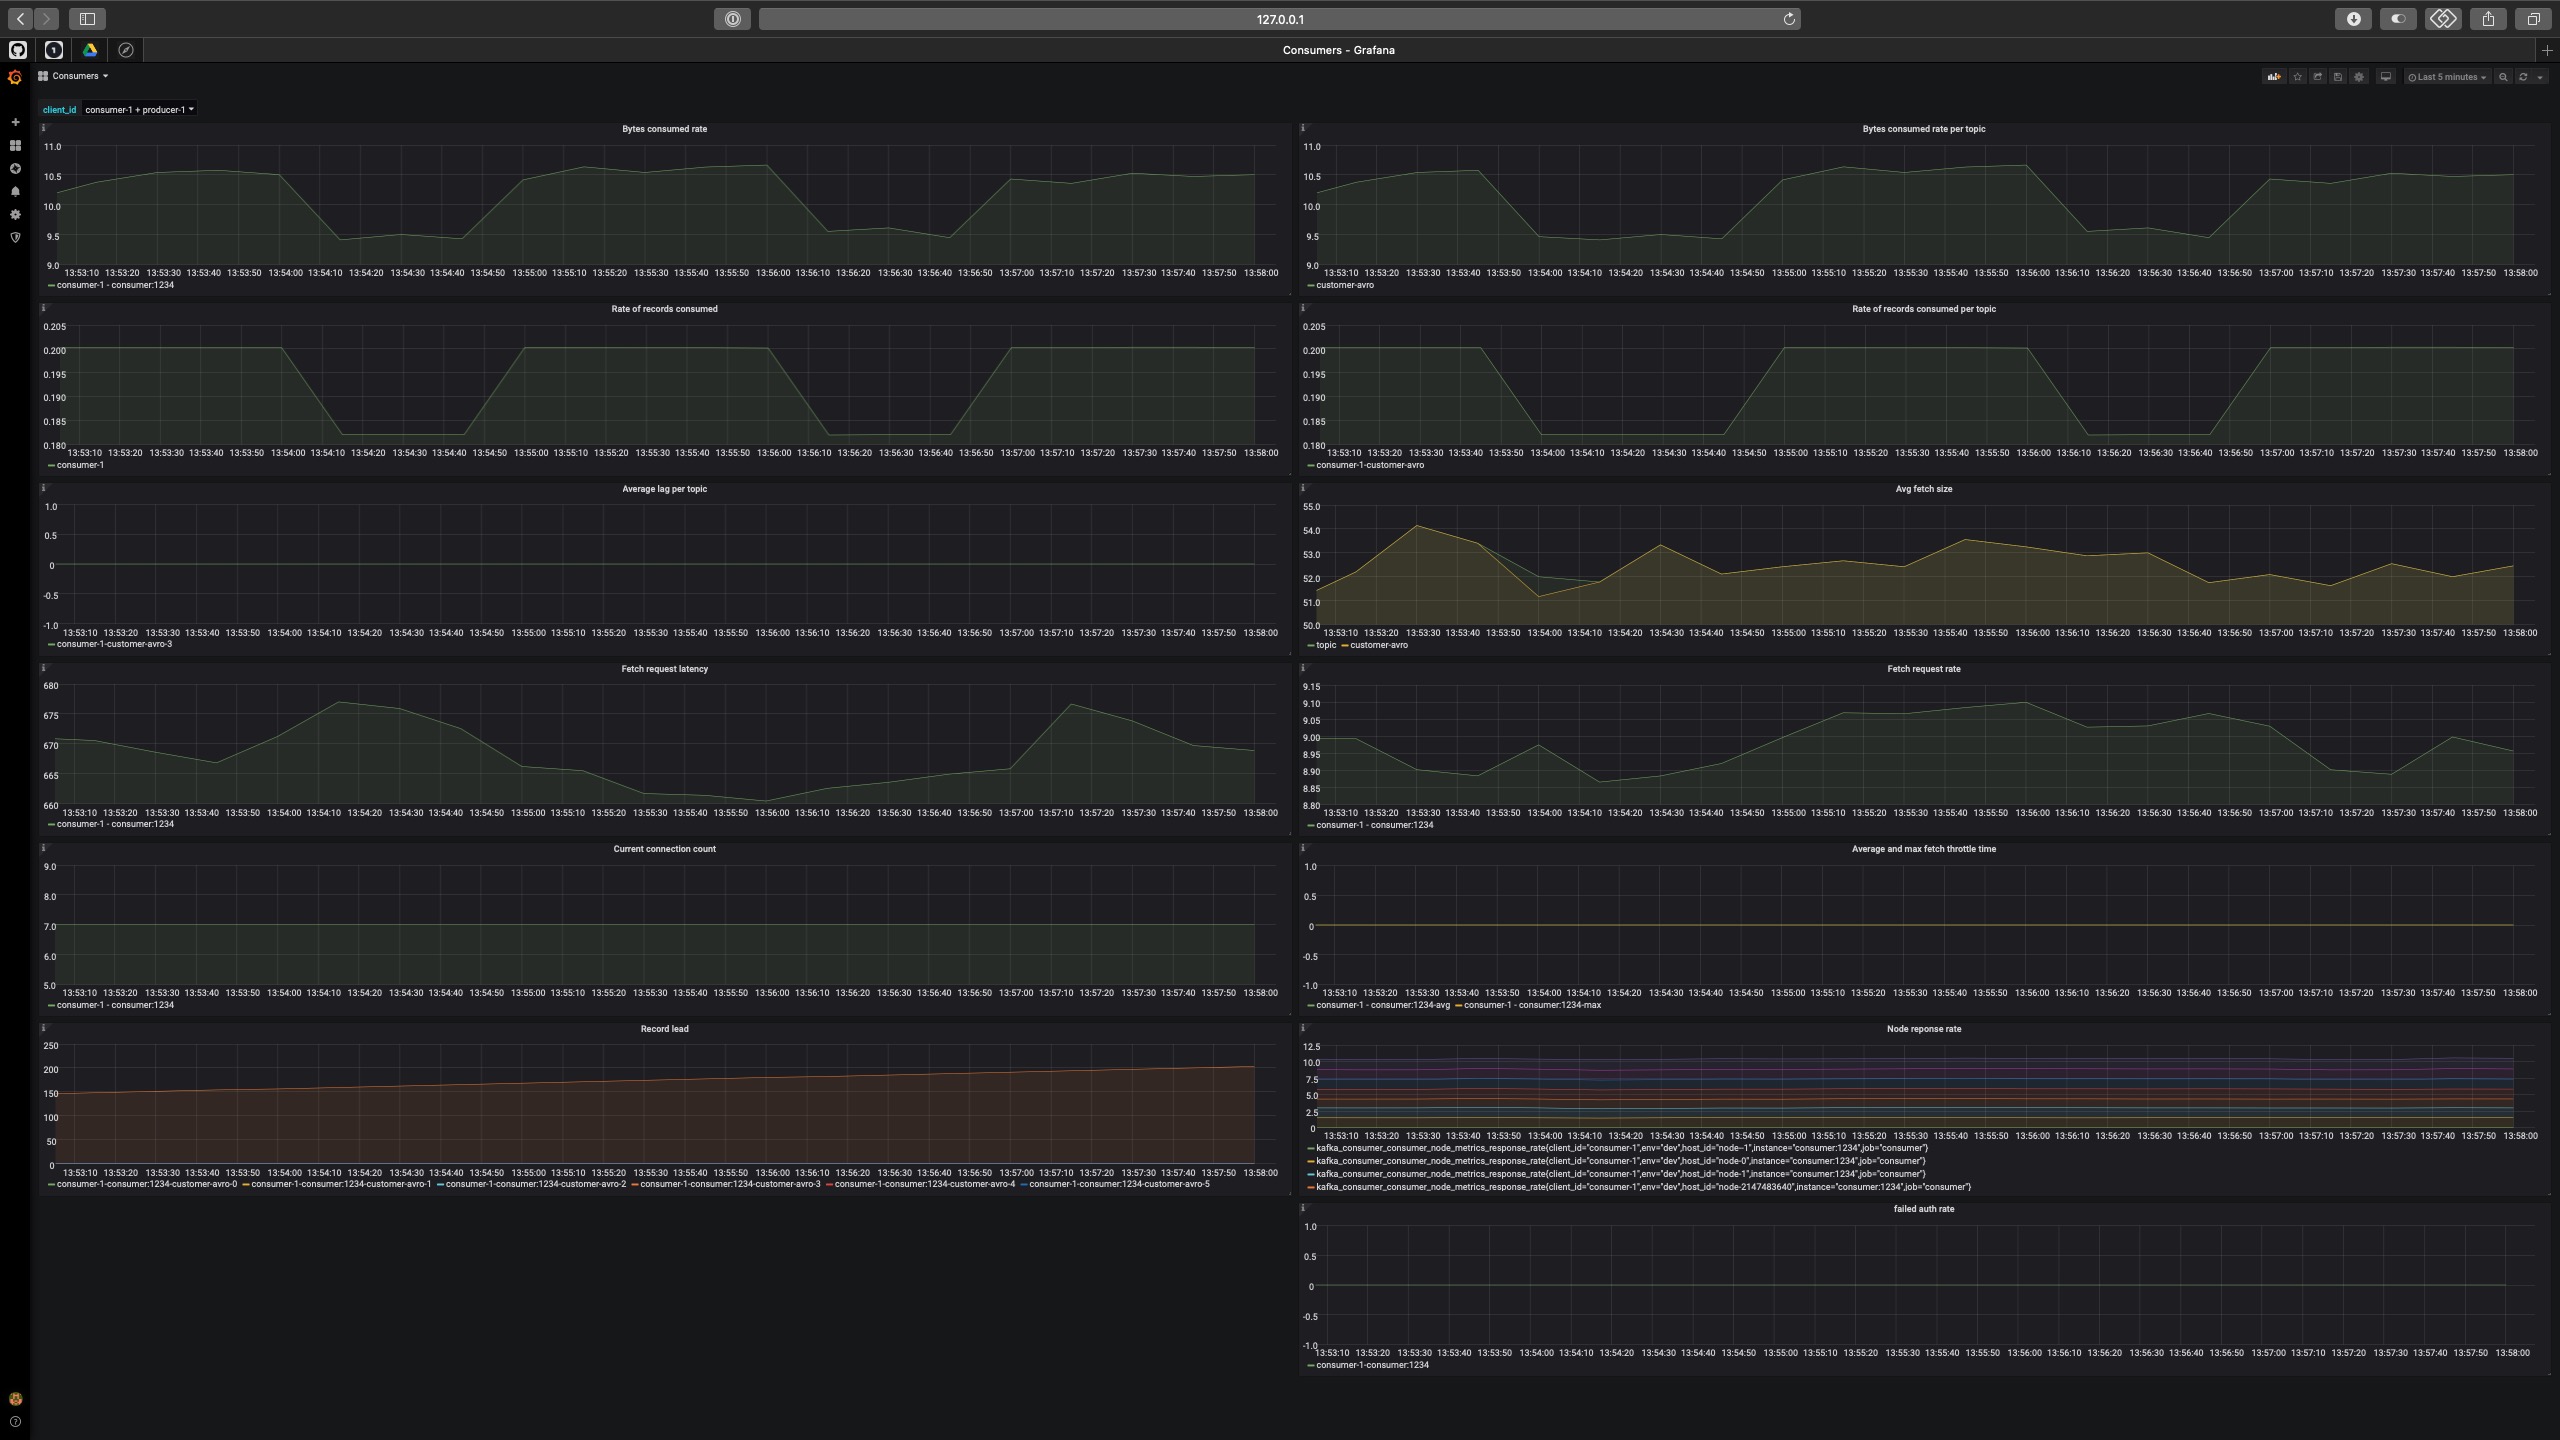
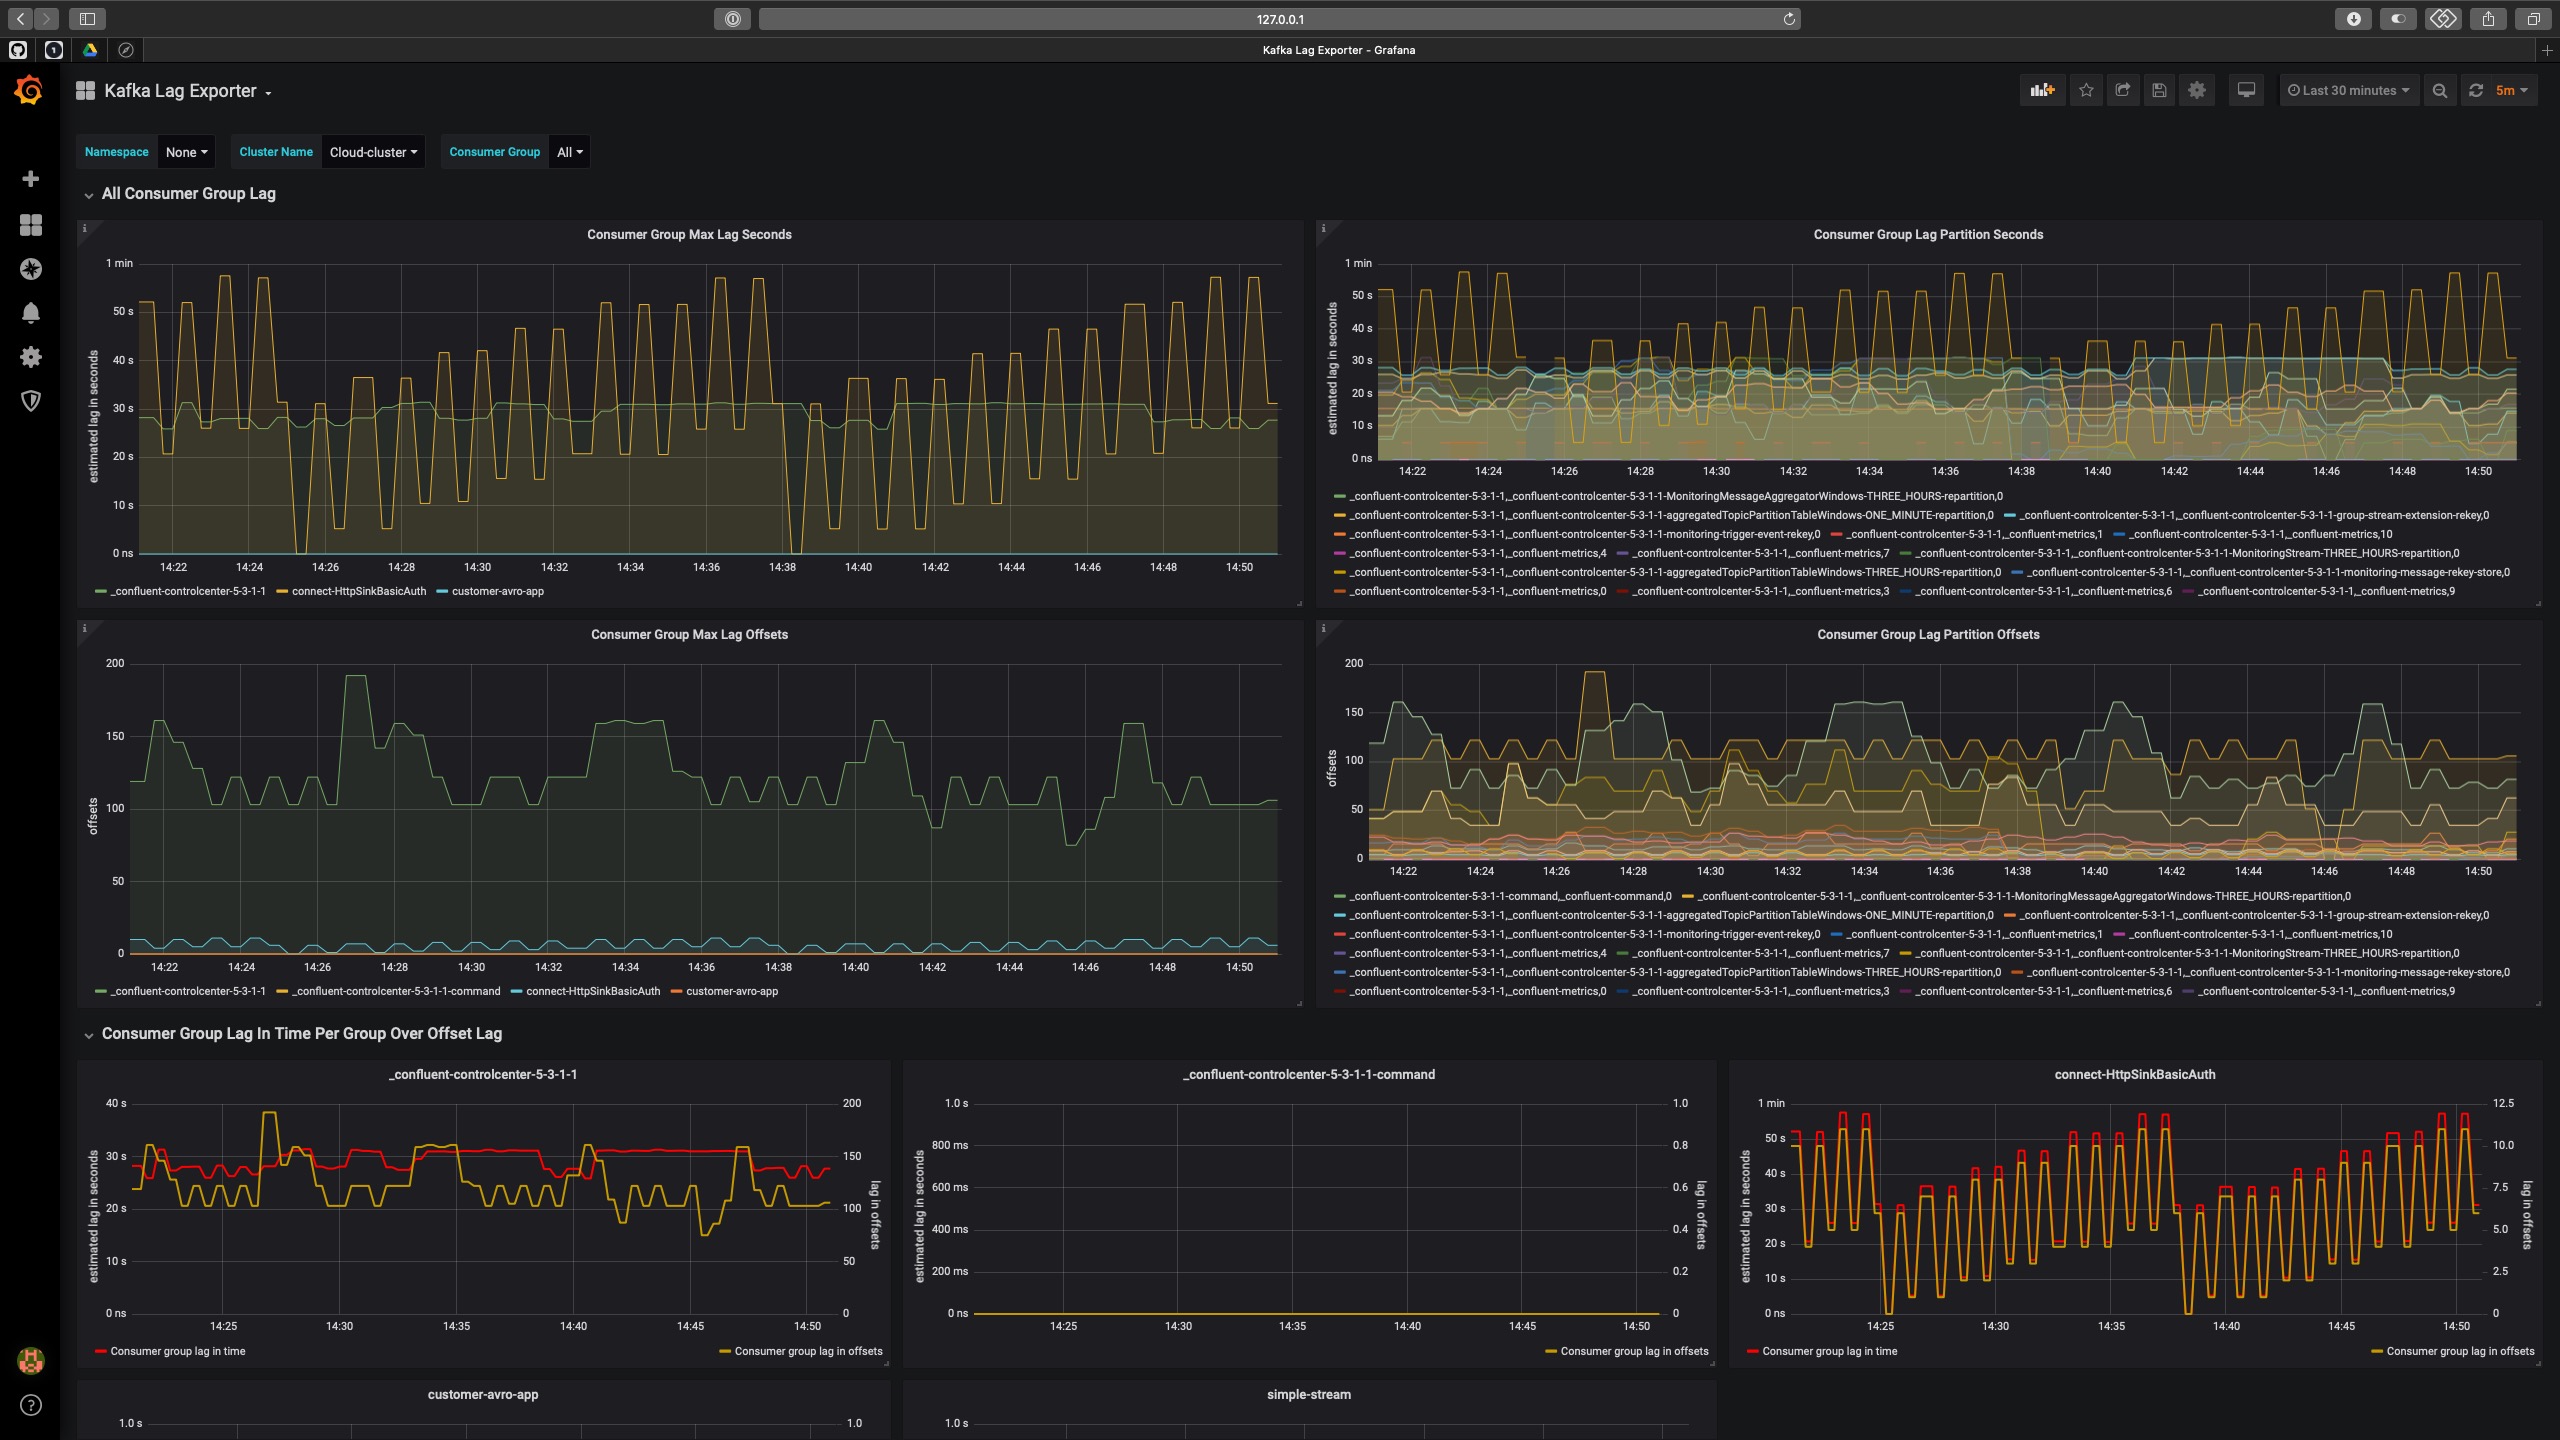
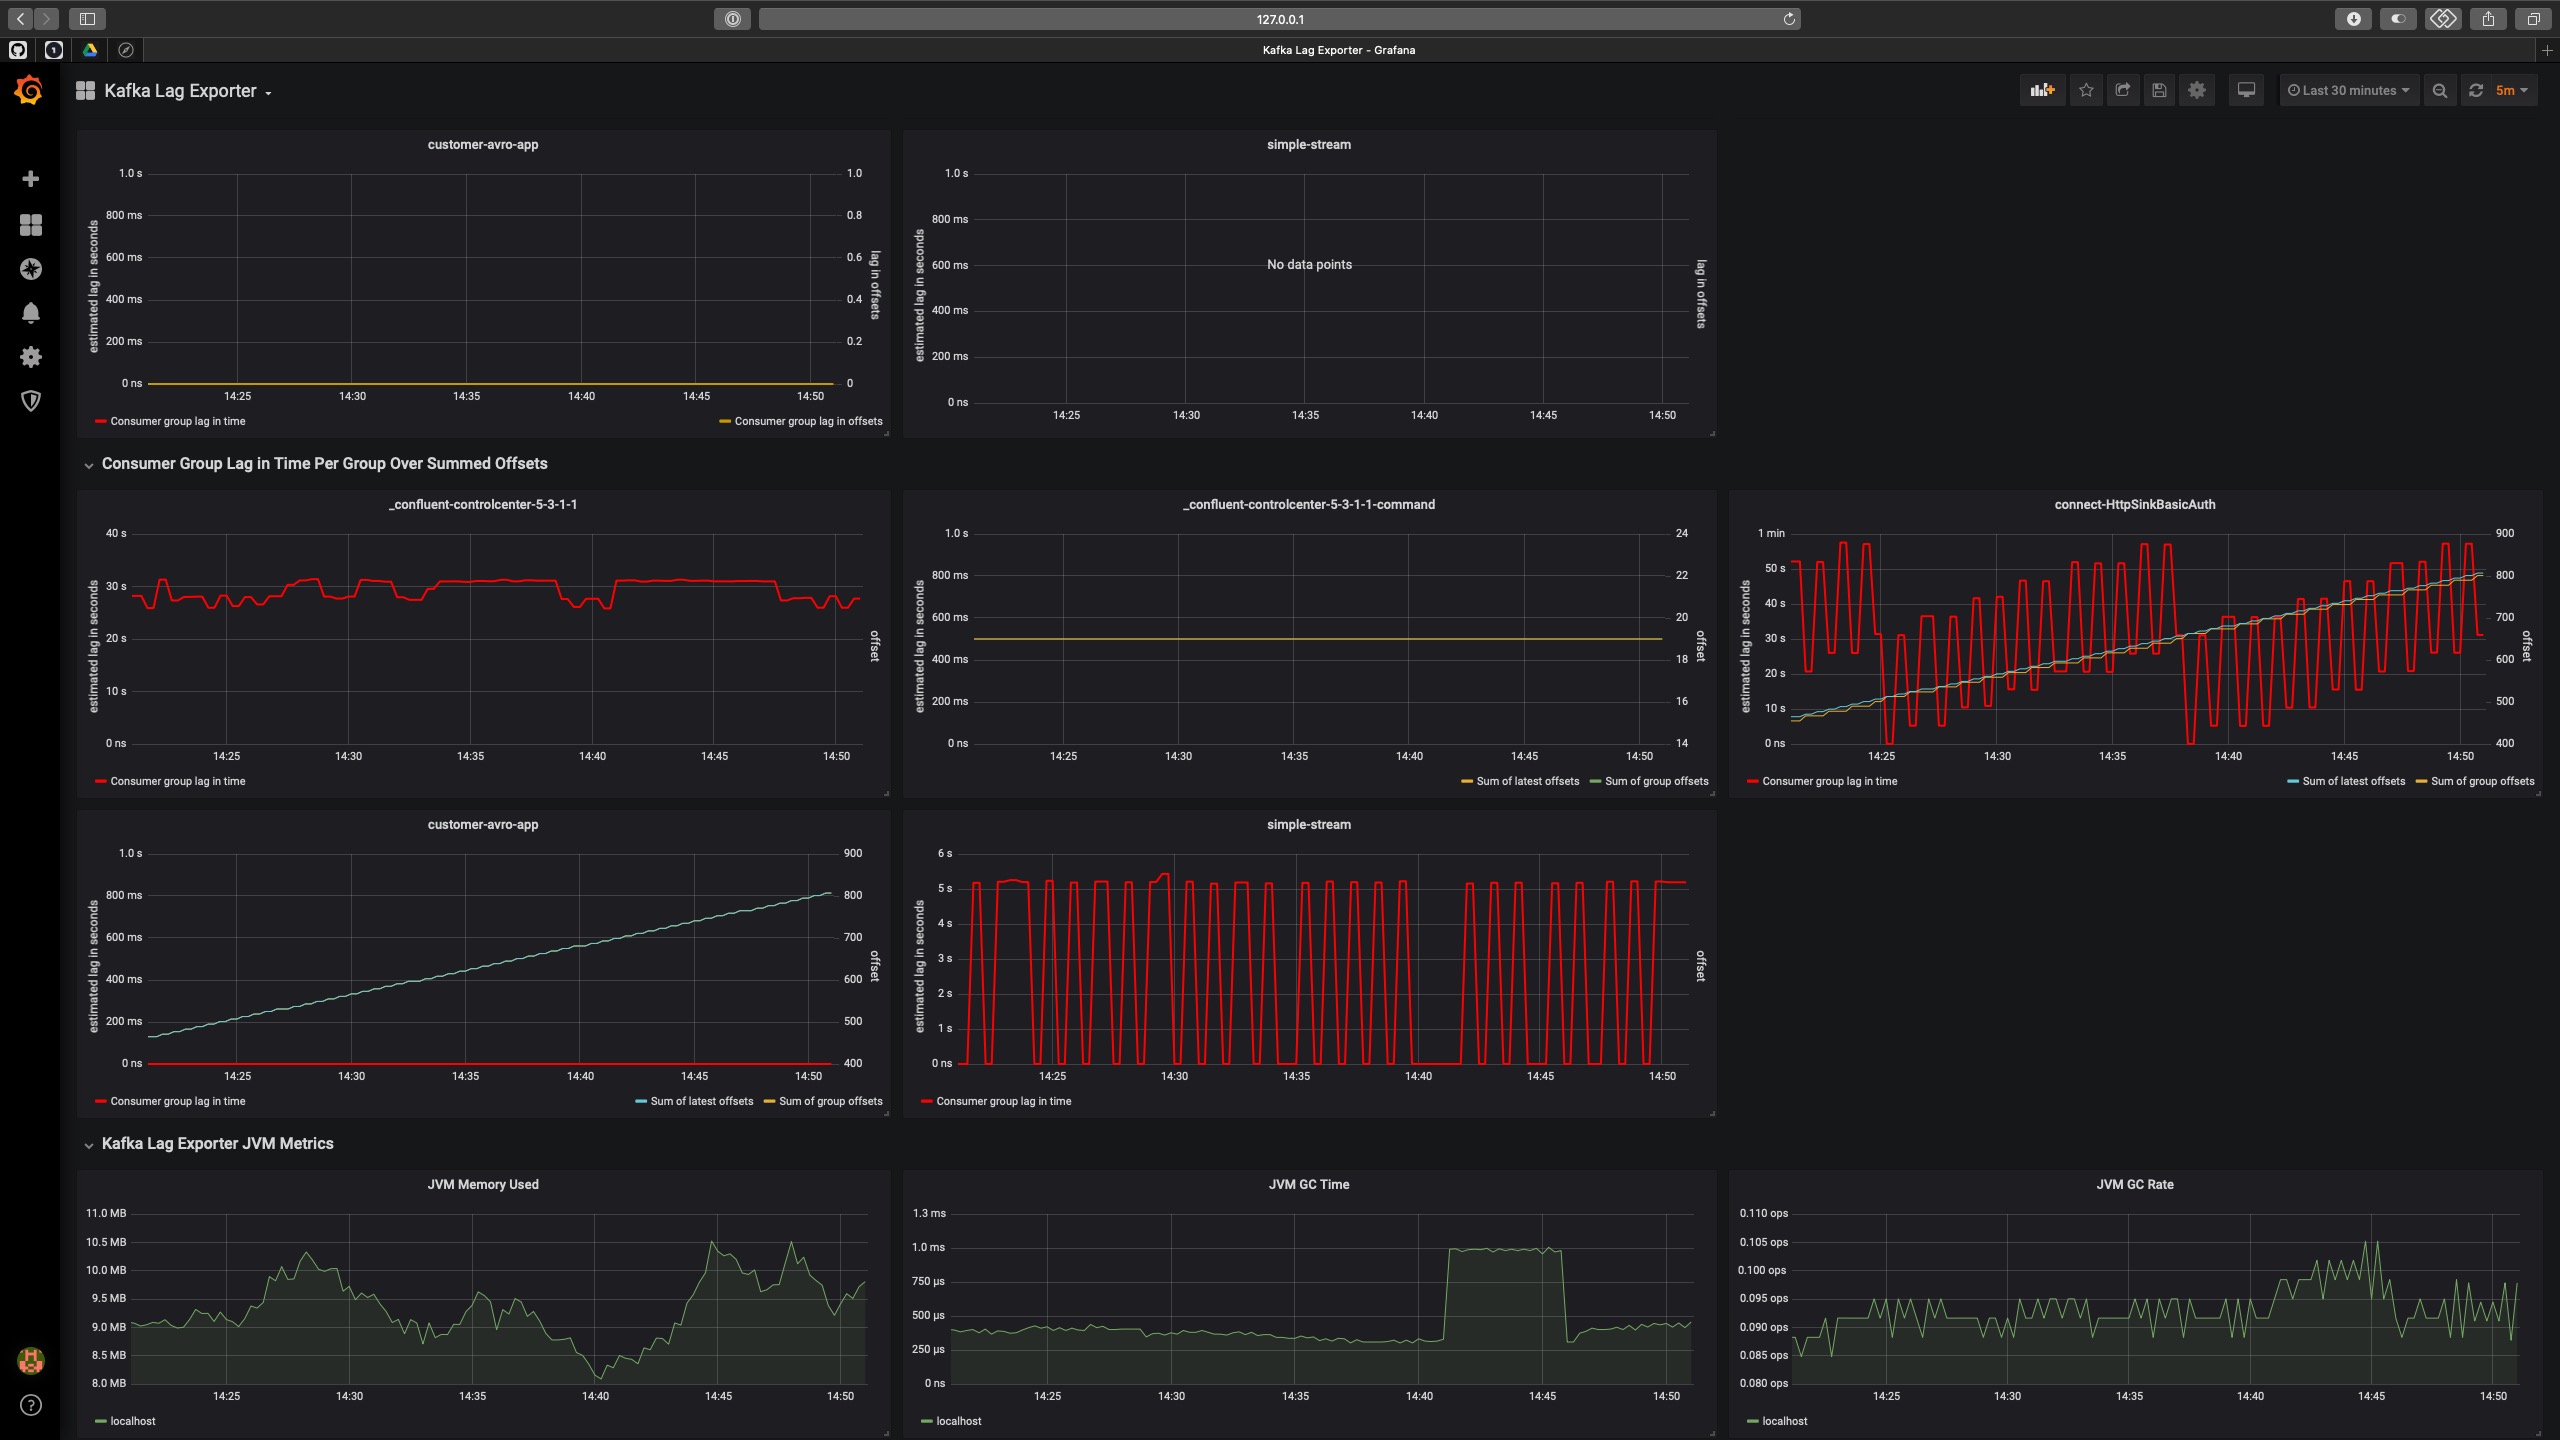
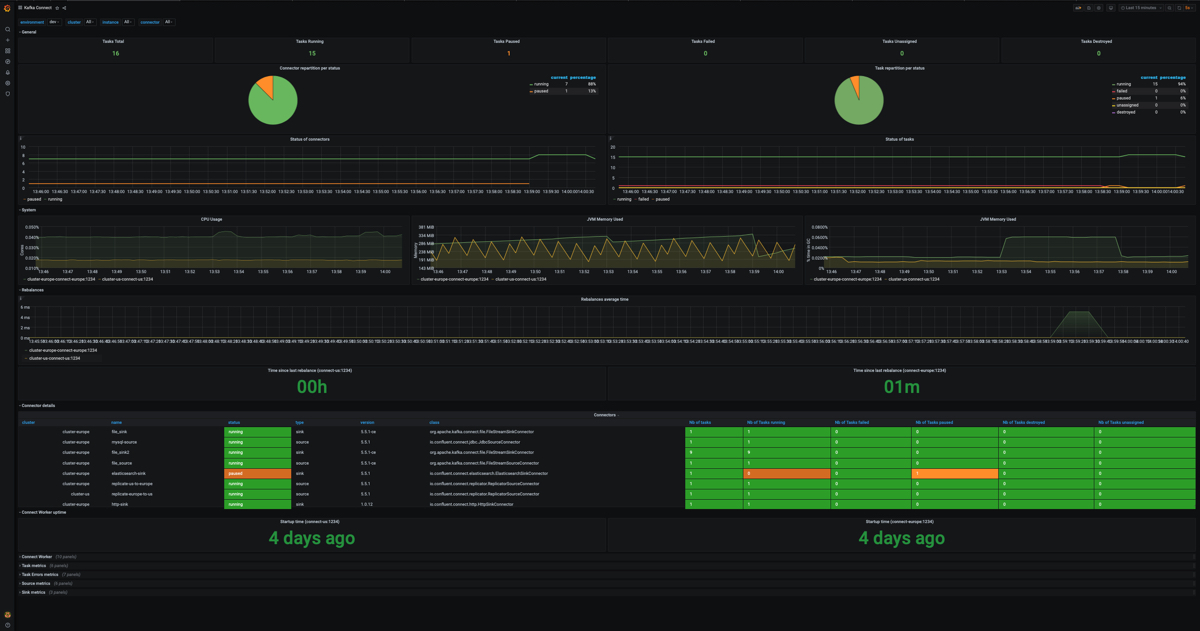
Simple demo of how to monitor Kafka Platform using Prometheus and Grafana.
You need to have docker and docker-compose installed.
git clone https://github.com/jeanlouisboudart/kafka-platform-prometheus.git
cd kafka-platform-prometheusThis repository contains some local docker images including:
- jmx_exporter
- a simple producer
- a simple consumer
To build all images you just need to run:
docker-compose buildTo start the environment simply run the following command
docker-compose up -dOpen a brower and visit http://localhost:3000 (grafana). Login/password is admin/admin.
To destroy the environment simply run the following command to destroy containers and associated volumes:
docker-compose down -vCreate demo-perf-topic with 4 partitions and 3 replicas.
docker-compose exec kafka-1 bash -c 'KAFKA_OPTS="" kafka-topics --create --partitions 4 --replication-factor 3 --topic demo-perf-topic --zookeeper zookeeper-1:2181'Open a new terminal window and generate random messages to simulate producer load.
docker-compose exec kafka-1 bash -c 'KAFKA_OPTS="" kafka-producer-perf-test --throughput 500 --num-records 100000000 --topic demo-perf-topic --record-size 100 --producer-props bootstrap.servers=kafka-1:9092'Open a new terminal window and generate random messages to simulate consumer load.
docker-compose exec kafka-1 bash -c 'KAFKA_OPTS="" kafka-consumer-perf-test --messages 100000000 --threads 1 --topic demo-perf-topic --broker-list kafka-1:9092 --timeout 60000'docker-compose exec connect \
curl -X PUT \
-H "Content-Type: application/json" \
--data '{
"connector.class":"org.apache.kafka.connect.file.FileStreamSinkConnector",
"tasks.max":"4",
"file": "/tmp/test.sink.txt",
"topics": "demo-perf-topic"
}' \
http://localhost:8083/connectors/file-sink/config | jq .Verify that data is written to file /tmp/test.sink.txt:
docker-compose exec connect bash -c 'tail -10 /tmp/test.sink.txt'Create demo-perf-topic-copy with 4 partitions and 3 replicas.
docker-compose exec kafka-1 bash -c 'KAFKA_OPTS="" kafka-topics --create --partitions 4 --replication-factor 3 --topic demo-perf-topic-copy --zookeeper zookeeper-1:2181'docker-compose exec connect \
curl -X PUT \
-H "Content-Type: application/json" \
--data '{
"connector.class":"org.apache.kafka.connect.file.FileStreamSourceConnector",
"tasks.max":"1",
"file": "/tmp/test.sink.txt",
"topic": "demo-perf-topic-copy"
}' \
http://localhost:8083/connectors/file-source/config | jq .Verify that data is written in kafka topic demo-perf-topic-copy:
docker-compose exec kafka-1 bash -c 'KAFKA_OPTS="" kafka-console-consumer -bootstrap-server kafka-1:9092 --topic demo-perf-topic-copy --from-beginning --max-messages 10'This is using kafka-lag-exporter in order to pull consumer lags metrics from kafka cluster and be exported to Prometheus.

