It's very important that the output you feed to the mapper only be from a single MPI rank. Otherwise the present table is going to be a mess.
There is a slurm option that will do this automatically:
srun -l
Then you can use standard tools to isolate it down. For example, grep -E "^15:" <file> > PE15.log to get the rank 15 output.
Another option is to append a unique prefix to the CRAY_ACC_DEBUG output using cray_acc_set_debug_global_prefix from the Cray OpenMP runtime library:
    #include <omp.h>
    ...
    #if _OPENMP
    char prefix[50];
    snprintf(prefix, 50, "PE %d", myRank);
    cray_acc_set_debug_global_prefix(prefix);
    #endif
When you run your code, you need to make sure you have your batch script setup correctly. Start by setting the environment variable:
export CRAY_ACC_DEBUG=3
You also need to modify your run line to such that you prepend a timestamp to any output line. That's easiest to do by piping into a python process:
<your command> 2>&1 | python3 -c 'import sys,time;sys.stdout.write("".join(( " ".join((str(time.clock_gettime(time.CLOCK_MONOTONIC)), line))) for line in sys.stdin ))'
Finally, you'll probably need to do something to synchronize output so you don't have processes clobbering each other. For aprun that can be -T. I'm not sure how to do it for slurm yet, but if you use the -l option suggested above it should work.
For example, here's my batch script for LULESH on Kay:
    #! /bin/bash
    #PBS -l place=scatter
    #PBS -l walltime=1:00:00
    #PBS -l select=1:nodetype=mom-x86_64+8:accelerator_model=Tesla_P100-PCIE-16GB

    module load craype-hugepages8M

    export OMP_NUM_THREADS=2
    cd $PBS_O_WORKDIR
    export CRAY_ACC_DEBUG=3
    aprun -T -n 8 -N 1 -d 2 -S 1 -cc 0,2,4 ./lulesh2.0 -s 250 2>&1 | python3 -c 'import sys,time;sys.stdout.write("".join(( " ".join((str(time.clock_gettime(time.CLOCK_MONOTONIC)), line))) for line in sys.stdin ))'
And here's a sample of the output it produces that the mapper can use:
8559515.76713946 ACC: PE 1: Renable thread affinity
8559515.767176889 ACC: PE 3:            acc  ptr 0
8559515.767178327 ACC: PE 3:            flags: ALLOCATE COPY_HOST_TO_ACC ACQ_PRESENT REG_PRESENT
8559515.767179428 ACC: PE 3:            memory not found in present table
8559515.767180488 ACC: PE 3:            allocate (126506008 bytes)
8559515.767210754 ACC: PE 6:              get new reusable memory, added entry
8559515.767212287 ACC: PE 6:            new allocated ptr (2aab0a000000)
8559515.767213445 ACC: PE 6:            add to present table index 0: host 1009d0d7ac0 to 100a497ced8, acc 2aab0a000000
8559515.76721462 ACC: PE 6:            copy host to acc (1009d0d7ac0 to 2aab0a000000)
8559515.767215734 ACC: PE 6:                internal copy host to acc (host 1009d0d7ac0 to acc 2aab0a000000) size = 126506008
8559515.767318113 ACC: PE 3:              get new reusable memory, added entry
8559515.767319558 ACC: PE 3:            new allocated ptr (2aab0a000000)
8559515.767320637 ACC: PE 3:            add to present table index 0: host 1009d0d7ac0 to 100a497ced8, acc 2aab0a000000
8559515.767323134 ACC: PE 3:            copy host to acc (1009d0d7ac0 to 2aab0a000000)
8559515.767355058 ACC: PE 4:              get new reusable memory, added entry
8559515.767356548 ACC: PE 4:            new allocated ptr (2aab0a000000)
8559515.767412037 ACC: PE 4:            add to present table index 0: host 1009d0d7ac0 to 100a497ced8, acc 2aab0a000000
8559515.767413545 ACC: PE 4:            copy host to acc (1009d0d7ac0 to 2aab0a000000)
8559515.767414743 ACC: PE 4:                internal copy host to acc (host 1009d0d7ac0 to acc 2aab0a000000) size = 126506008
8559515.767444951 ACC: PE 3:                internal copy host to acc (host 1009d0d7ac0 to acc 2aab0a000000) size = 126506008
8559515.767686335 ACC: PE 1: Set Thread Context
8559515.76768775 ACC: PE 1: Start transfer 13 items from /lus/scratch/sabbott/app-lulesh/omp_4.0/lulesh.cc:3228
8559515.767688831 ACC: PE 1:   flags:
You need a Python 3 installation with matplotlib and numpy installed. It can be your laptop, that's fine. An easy way to get running if you don't have them installed already is:
pip3 install --user numpy matplotlib
Grep and redirect the output such that you have a file containing output from only one process. Then you can pass that to the mapper:
python3 mapper.py ACC_PE1.log
Use the script's help option to see other options:
    python3 mapper.py --help
    usage: Parse data movement [-h] [--hmax HMAX] [--mark MARK] [--dumptable]
                               infile

    positional arguments:
    infile       Timestamped input file from CRAY_ACC_DEBUG output

    optional arguments:
    -h, --help   show this help message and exit
    --hmax HMAX  Drop host addresses above this hex address
    --mark MARK  Make a specific device address in the plot
    --dumptable  Dump table entries to stdout during plotting
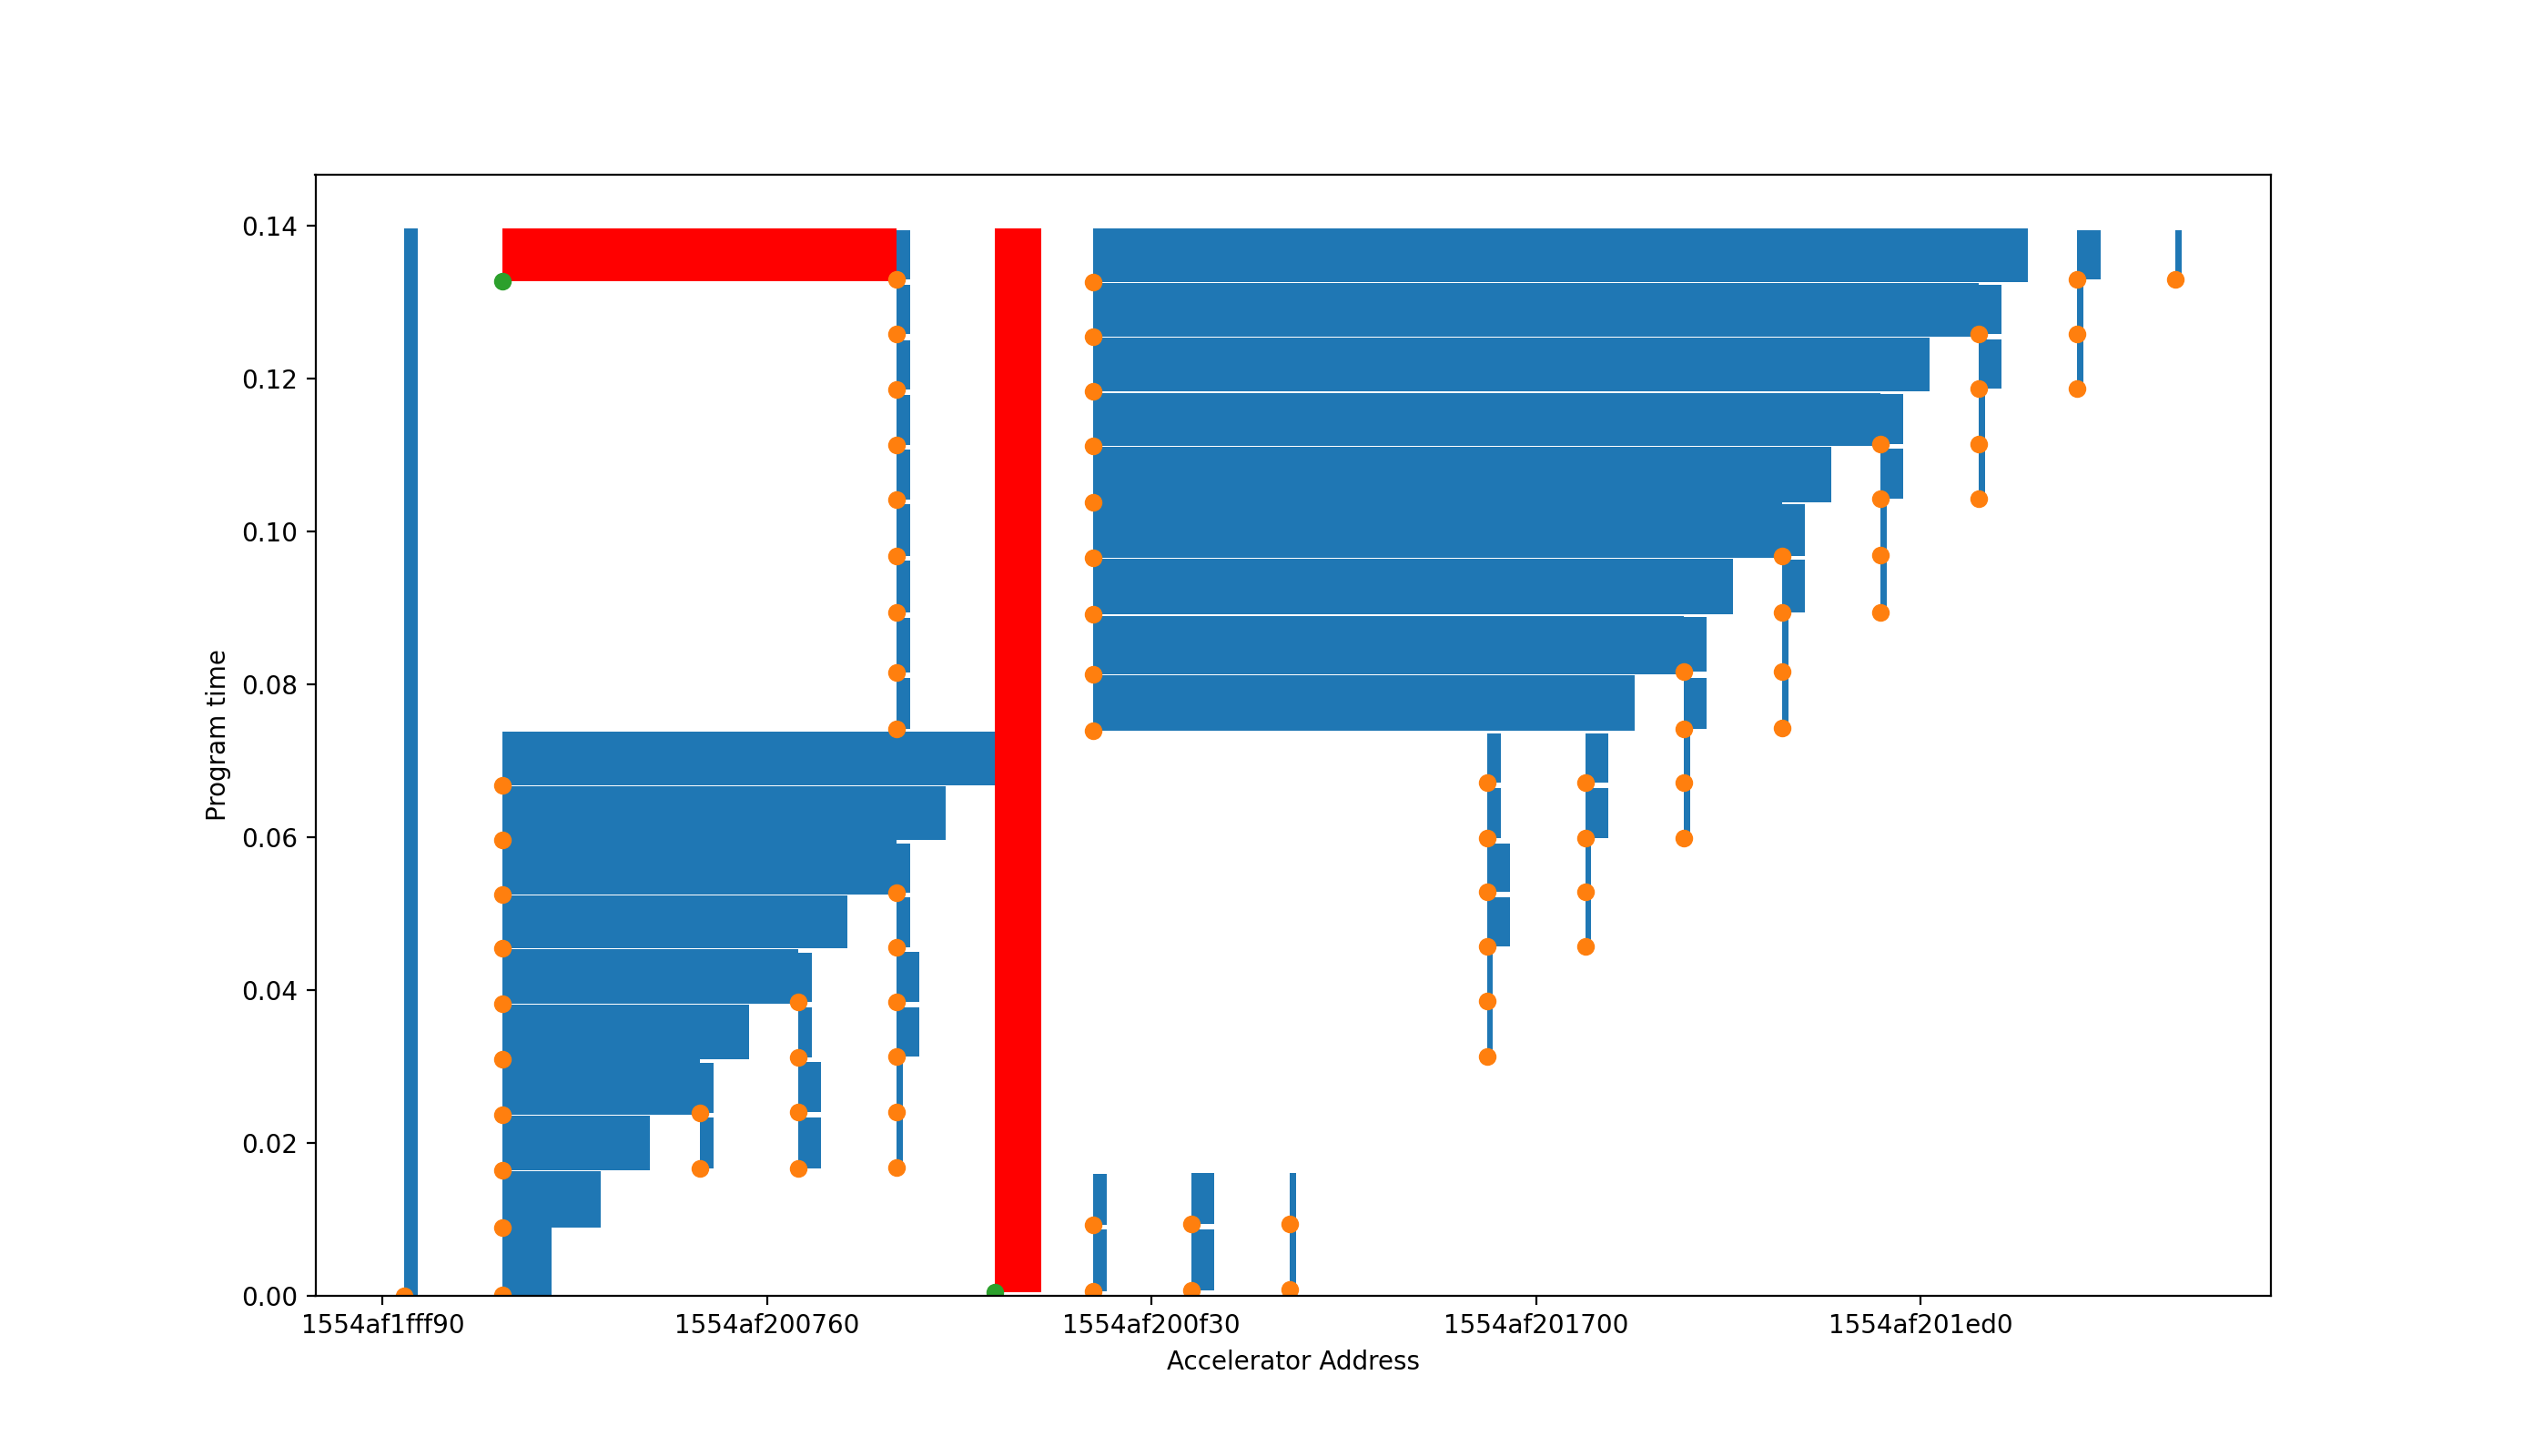
The script currently does some debug prints (which I need to clean up) and produces a plot of the device addresses mapped by the runtime and the application time. If an address was both mapped and unmapped (removed from the present table during application execution) the bar will be blue. If it was mapped but not unmapped it will be red.
An region that is mapped but not unmapped might be bug, for example an enter data region that was mistakenly not paired for an exit data. For this reason one of the debug prints is the values of the open present table entries at application exit, so you can search back through the runtime output to find where you mapped these and if they make sense. Keep in mind that open entried might not be bugs; for example a declare target Fortran module variable will be mapped at application start and never unmapped. If the application terminated prematurely it's very likely there will be many unmapped entries.
Orange dots indicate the initial point of mapping. These are on the plot because otherwise it can be hard to distinguish many small maps from one large map.
There's a sample output included:
$ python3 mapper.py sample.log
Which produces the plot:
This is a quick and dirty debugging tool. If you have issues, reach out to stephen.abbott@hpe.com
