This is a simple grafana alerts operator to provision alerts condiguration.
Refer to helm charts folder for deployment.
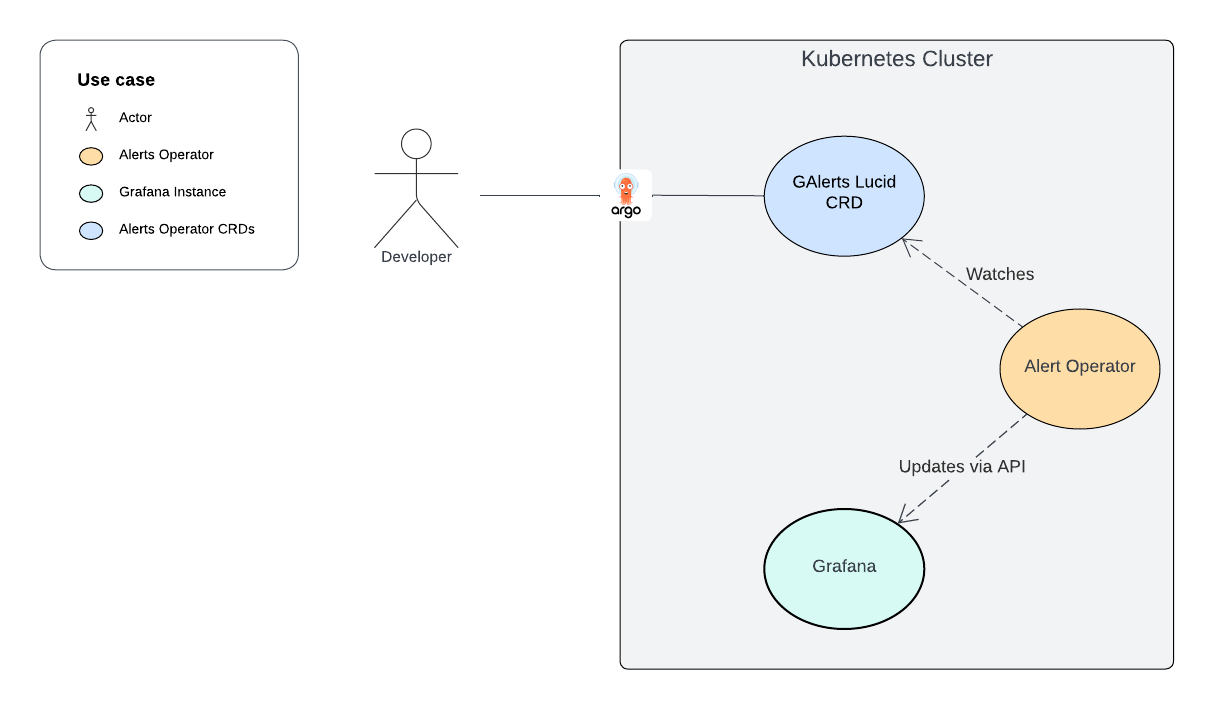
The alert operator is built to simplify the process of writing and admission of grafana alerts and its assets like dashboards, contacts and policies.
It is API-based approach to add and manage the configurations instead of built-in CRDs (ConfigMaps).
The main flow of the solution is captured below.
Compared to the built-in config maps approach, the operator shines in the following traits.
| Feature | Grafana CMs | Alert Operator |
|---|---|---|
| No UID duplication by doing UPSERT operations | ❌ | ✅ |
| Dedicated Logging | ❌ | ✅ |
| Use of Custom CRDs | ❌ | ✅ |
| Support for Provenance Override | ❌ | ✅ |
| Provisioning Model | File | API |
| ArgoCD Deployment | ✅ | ✅ |
In addition, the proposed approach facilitates building observability as an offering per component, where it ships as part of each app. So monitoring and alerting features will ship as part of the standard deployment.
The tool is written in pure python without an operator framework for simplicity.
It uses the SDKs for Grafana and Kubernetes integrations.
Pipeline builds and pushes the image to aws and oci for successful builds on main branch.
To onboard a new application alerts, you can extract the alerts from Grafana UI in API format, then utilize rules attribute in the CRD resource to assign alert rules set to be provisioned. Also, it is possible to attach the related contact points and routes (in API format) within the CRD to be deployed by operator. apiVersion: grafana.abarrak.com/v1alpha1
kind: GrafanaAlertRules
metadata:
  name: {{ name }}
  namespace: monitoring
rules: []
contact_points: []
notification_policies: []
After the deployment the resource will be available within the cluster:
❯ kubectl get galerts.grafana.abarrak.com
NAME                                   AGE
eck-elasticsearch-alert-rules          105d

❯ kubectl describe galerts.grafana.abarrak.com eck-elasticsearch-alert-rules
Name:         eck-elasticsearch-alert-rules
Namespace:    monitoring
Labels:       <none>
Annotations:  argocd.argoproj.io/tracking-id: elasticsearch:grafana.abarrak.com/GrafanaAlertRules:monitoring/eck-elasticsearch-alert-rules
API Version:  grafana.abarrak.com/v1alpha1
Kind:         GrafanaAlertRules
Metadata:
  Creation Timestamp:  2023-11-22T20:37:36Z
  Generation:          4
  Resource Version:    3102554780
  UID:                 7a5354b8-b023-4045-ba18-025932eb3bbc
Rules:                 [
{
    "uid": "ESALERT1",
    "orgID": 1,
    "folderUID": "ELASTIC-FOLDER",
    "ruleGroup": "Elastic Alerts",
    "title": "ESALERT1: Elasticsearch disk alert",
    ...
  }
]
Events:  <none>
To check out when something isn’t working fine, you can tail the logs:
❯ kubectl logs -l name=grafana-alert-operator -f
2024-03-07 11:21:10 INFO     Processing the event with type ADDED
2024-03-07 11:21:10 INFO     Processing folder: spark-1hz
2024-03-07 11:21:10 INFO     folder #spark-1hz updated successfully.
2024-03-07 11:21:10 INFO     Creating 3 Alert Rules
...- Define alerts routing attributes through labels, e.g.: severity, team, environment.
- Utilize annotation to enrich the alerts such as description, dash and panel ld, and runbook link.
- The ability to parametrize dynamic values like thresholds is possible and propagated with helm values.
MIT (2024).