
The (m,n)-mer R package was created to summarize biological data into numerical characteristics. It reads a FASTA file and generates a table describing the conditional frequency distribution of the selected (m,n)-mer in the sequences. This output is combined with class information to generate the feature matrix for classification.
(m,n)-mers are an alternative for k-mers (Figure 1). We proposed the replacement of the unconditional k-mer frequency by the conditional frequency, which represents the relative frequency of the n-mer conditioned to f m-mer that precedes it. For more details and performance comparison, please see Andrade et al., 2022 (in press).

Fig 1. Comparing k-mer to mn-mer relative frequency.
According to Figure 2, the k-mers are represented as (0,k) and the mn-mers as (m,n).

Fig 2. Numeric representation.
The output table (Figure 3) includes the fasta file accession numbers as an ID column, the relative frequency of mn-mers up to 4^k columns, and class information.
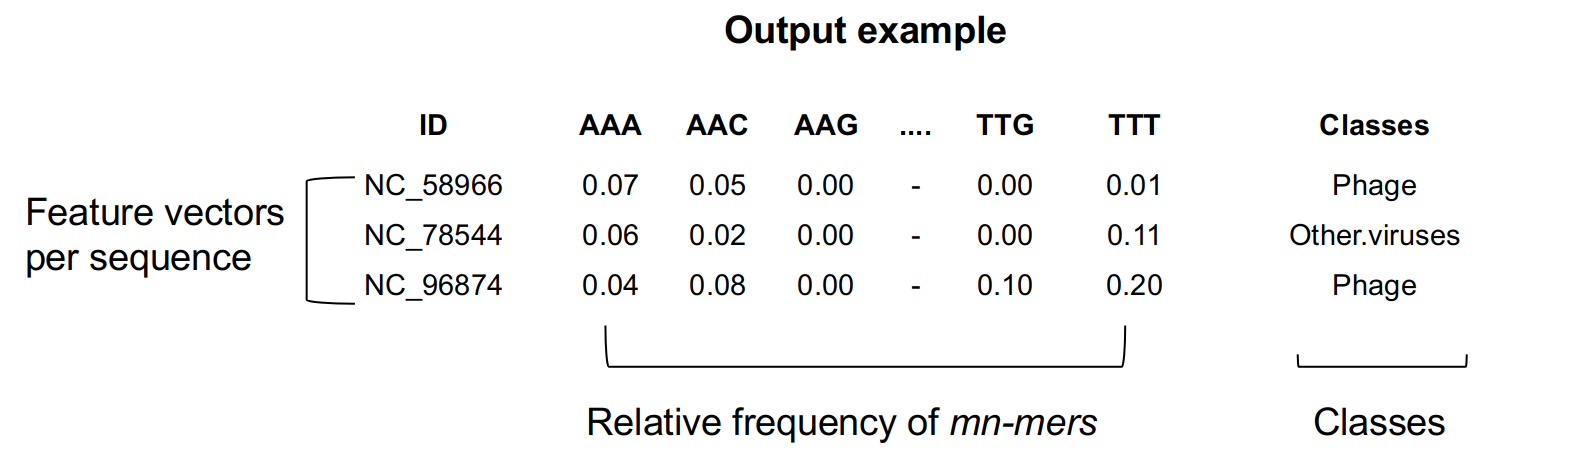 Fig 3. Output example.
R version 4.0.0 or later
library(devtools)

install_github("labinfo-lncc/mnmer", ref="main")
library("mnmer")
dir <-system.file("extdata", package="mnmer")
Assume we need to distinguish between viruses detected in mosquito samples and viruses that exclusively infect plants. The mn function generates the feature matrix using conditional probability from the datasets mosquito vir.fasta and plant vir.fasta. This function can generate both k-mers and mn-mers.
The parameter k is set to choice for k-mer generation, while the parameter m is set to zero. Considering that the k-mers are conditioned to zero bases.
mosquito <- mnmer(file.path(dir, "mosquito_vir.fasta"),2,0)
plant <- mnmer(file.path(dir, "plant_vir.fasta"),2,0)
The k and m parameters are chosen by the user for mn-mer creation. For instance, k = 2 and m = 1 yield the (1,1)-mer, in which one base is conditioned on the frequency of one preceding base.
mosquito <- mnmer(file.path(dir, "mosquito_vir.fasta"),2,1)
plant <- mnmer(file.path(dir, "plant_vir.fasta"),2,1)
Bases other than A, C, T, and G were disregarded.
For classification outside of the mnmer program, we utilize the (1,1)-mer feature matrices. Here's a real-world example of code:
library(data.table)
library(caret)
library(MLeval)

classes <- replicate(nrow(mosquito), "mosquito.vir")
featureMatrix_mosquito <- cbind(mosquito,classes)
classes <- replicate(nrow(plant), "plant.vir")
featureMatrix_plant <- cbind(plant,classes)

featureMatrix <- rbind(featureMatrix_mosquito, featureMatrix_plant)
featureMatrix <- subset(featureMatrix, select = -c(seqid))
train_index <- createDataPartition(featureMatrix$classes, p=0.8, list=FALSE)
train <- featureMatrix[train_index, ]
test <- featureMatrix[-train_index, ]
control <- trainControl(method="cv", summaryFunction=twoClassSummary, classProbs=T, savePredictions = T)
roc <- train(classes ~ ., data=train, method="rf", preProc=c("center"), trControl=control)
res <- evalm(roc) # Make the ROC plot
This classification produces the ROC curve and metrics shown below:

| Metrics | Value |
|---|---|
| AUC | 1.0000 |
| ROC | 1.0000 |
| Sensibility | 0.9500 |
| Specificity | 1.0000 |
ANDRADE, AAS; GRIVET, M; BRUSTOLINI, O; VASCONCELOS, ATR. (m,n)-mer - A Simple and New Statistical Feature for viral Classification. In press.
All data and statistical supplementary tables used in this project are stored at:
https://biotools.labinfo.lncc.br/mnmer/downloads/Supplementary_Material.tar.xz
• Accession numbers for all raw datasets (Acc_numbers.csv);
• Non-redundant fragmented datasets used for Training and Testing (300bp, 1000bp, 3000bp, 5000bp, and 10000bp) (DatasetA.zip, DatasetB.zip, and DatasetC.zip);
• Feature Matrixes for k-mers from each dataset (DatasetA_kmers.zip, DatasetB_kmers.zip, and DatasetC_kmers.zip);
• Feature Matrices for (m,n)-mer from each dataset (DatasetA_mnmers.zip, DatasetB_mnmers.zip, and DatasetC_mnmers.zip);
• All resulting metrics per fragment (DatasetA_results.zip, DatasetB_results.zip, and DatasetC_results.zip);
If you require access to any of the files not listed above, please open an issue on GitHub or email atrv@lncc.br
If you have any queries or find a bug, please submit an issue on GitHub or email atrv@lncc.br.