Prometheus exporter for enviroplus module by Pimoroni
Explore the docs »
View Demo
·
Report Bug
·
Request Feature
- About the Project
- Getting Started
- Usage
- Docker
- Roadmap
- Contributing
- License
- Contact
- Acknowledgements
To get the prometheus enviroplus-exporter up and running I'm assuming you already have Prometheus and Grafana running somewhere. Note: I wouldn't recommend running Prometheus on a Raspberry Pi (using a local SD card) as this could drastically reduce the lifetime of the SD card as samples are written quite often to disk.
- Python3
- To run the enviroplus-exporter you need to have the enviroplus-python library by Pimoroni installed:
curl -sSL https://get.pimoroni.com/enviroplus | bashNote Raspbian Lite users may first need to install git: sudo apt install git
We're going to run the enviroplus-exporter as the user pi in the directory /usr/src/. Adjust this as you wish.
1.Clone the enviroplus-exporter repository
cd
git clone https://github.com/tijmenvandenbrink/enviroplus_exporter.git
sudo cp -r enviroplus_exporter /usr/src/
sudo chown -R pi:pi /usr/src/enviroplus_exporter
2.Install dependencies for enviroplus-exporter
pip3 install -r requirements.txt3.Install as a Systemd service
cd /usr/src/enviroplus_exporter
sudo cp contrib/enviroplus-exporter.service /etc/systemd/system/enviroplus-exporter.service
sudo chmod 644 /etc/systemd/system/enviroplus-exporter.service
sudo systemctl daemon-reload
4.Start the enviroplus-exporter service
sudo systemctl start enviroplus-exporter5.Check the status of the service
sudo systemctl status enviroplus-exporterIf the service is running correctly, the output should resemble the following:
pi@raspberrypi:/usr/src/enviroplus_exporter $ sudo systemctl status enviroplus-exporter
● enviroplus-exporter.service - Enviroplus-exporter service
   Loaded: loaded (/etc/systemd/system/enviroplus-exporter.service; disabled; vendor preset: enabled)
   Active: active (running) since Fri 2020-01-17 14:13:41 CET; 5s ago
 Main PID: 30373 (python)
    Tasks: 2 (limit: 4915)
   Memory: 6.0M
   CGroup: /system.slice/enviroplus-exporter.service
           └─30373 /usr/bin/python /usr/src/enviroplus_exporter/enviroplus_exporter.py --bind=0.0.0.0 --port=8000

Jan 17 14:13:41 wall-e systemd[1]: Started Enviroplus-exporter service.
Jan 17 14:13:41 wall-e python[30373]: 2020-01-17 14:13:41.565 INFO     enviroplus_exporter.py - Expose readings from the Enviro+ sensor by Pimoroni in Prometheus format
Jan 17 14:13:41 wall-e python[30373]: Press Ctrl+C to exit!
Jan 17 14:13:41 wall-e python[30373]: 2020-01-17 14:13:41.581 INFO     Listening on http://0.0.0.0:8000
6.Enable at boot time
sudo systemctl enable enviroplus-exporterIf you are using an Enviro (not Enviro+) add --enviro=true to the command line (in the /etc/systemd/system/enviroplus-exporter.service file) then it won't try to use the missing sensors.
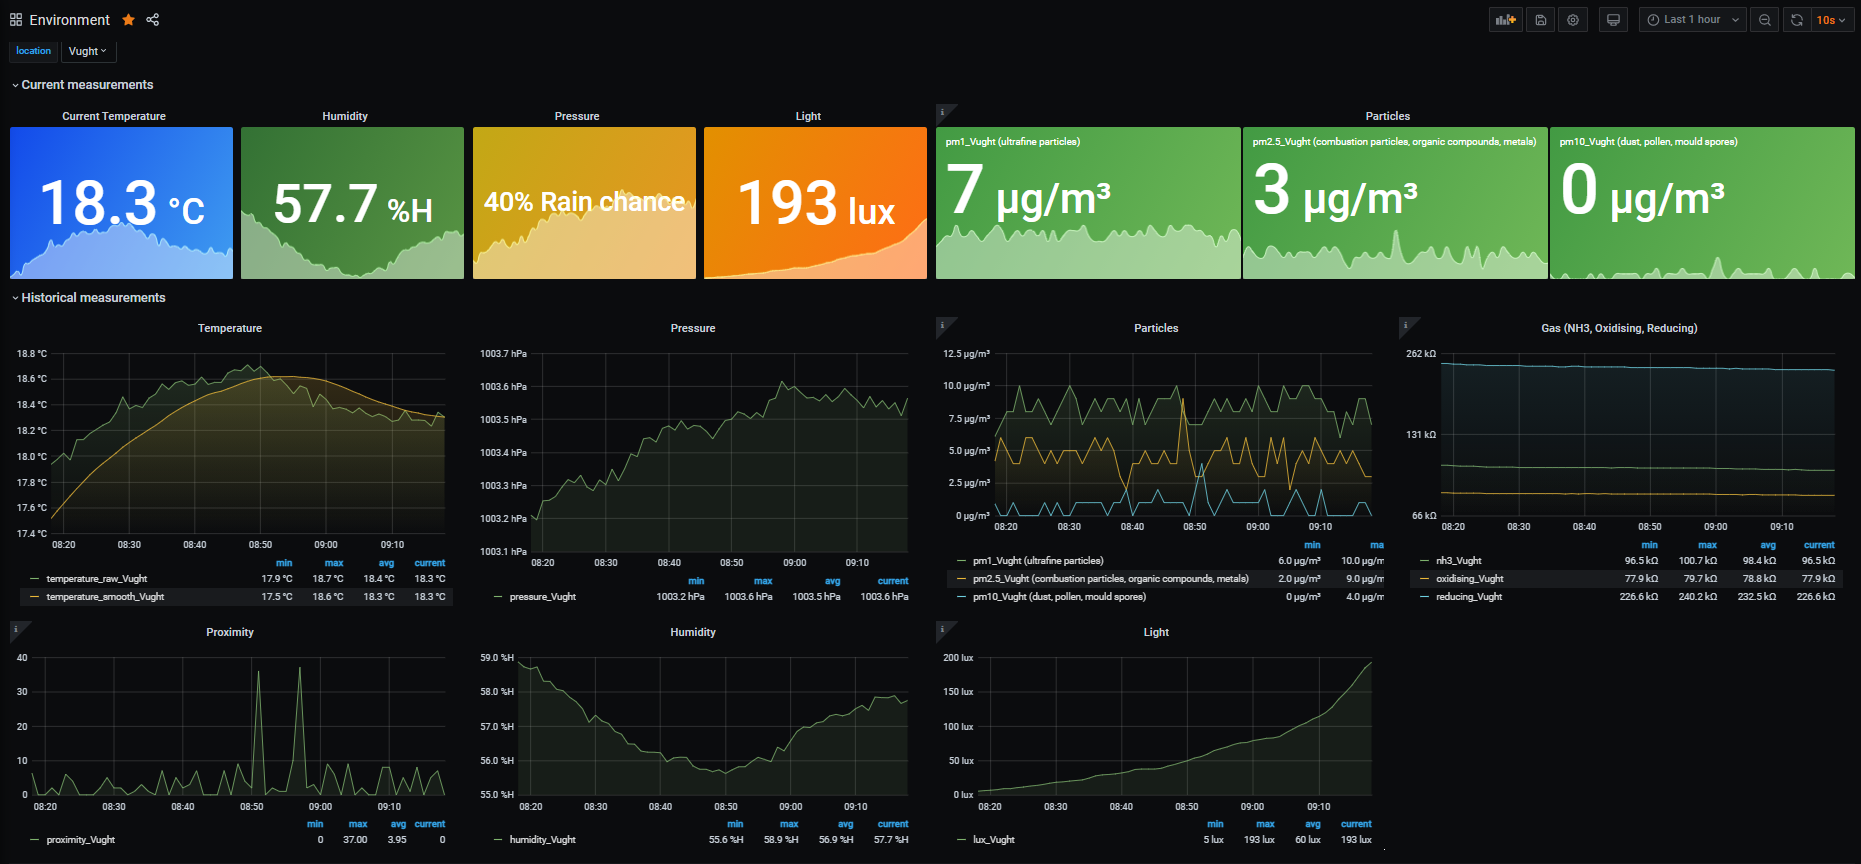
So now we've setup the Prometheus enviroplus-exporter we can start scraping this endpoint from our Prometheus server and get a nice dashboard using Grafana.
If you haven't setup Prometheus yet have a look at the installation guide here.
Below is a simple scraping config:
# Sample config for Prometheus.

global:
  scrape_interval:     15s # By default, scrape targets every 15 seconds.
  evaluation_interval: 15s # By default, scrape targets every 15 seconds.
  # scrape_timeout is set to the global default (10s).

  # Attach these labels to any time series or alerts when communicating with
  # external systems (federation, remote storage, Alertmanager).
  external_labels:
      monitor: 'external'

# Load and evaluate rules in this file every 'evaluation_interval' seconds.
rule_files:
  # - "first.rules"
  # - "second.rules"

# A scrape configuration containing exactly one endpoint to scrape:
# Here it's Prometheus itself.
scrape_configs:
  # The job name is added as a label `job=<job_name>` to any timeseries scraped from this config.
  - job_name: 'prometheus'

    # Override the global default and scrape targets from this job every 5 seconds.
    scrape_interval: 15s
    scrape_timeout: 15s

    # metrics_path defaults to '/metrics'
    # scheme defaults to 'http'.

    static_configs:
    - targets: ['localhost:9090']

  - job_name: node
    # If prometheus-node-exporter is installed, grab stats about the local
    # machine by default.
    static_configs:
    - targets: ['localhost:9100']

    # If environmentplus-exporter is installed, grab stats about the local
    # machine by default.
  - job_name: environment
    static_configs:
    - targets: ['localhost:8000']
      labels:
        group: 'environment'
        location: 'Amsterdam'

    - targets: ['newyork.example.com:8001']
      labels:
        group: 'environment'
        location: 'New York'
I added two labels to the targets group: environment and location: SomeLocation. The Grafana dashboard uses these labels to distinguish the various locations.
I published the dashboard on grafana.com. You can import this dashboard using the the ID 11605. Instructions for importing the dashboard can be found here.
There is a Dockerfile available if you'd like to run as a docker container.
1.Building
docker build -t enviroplus-exporter .
2.Running
docker run -d enviroplus-exporter -d -p 8000:8000 --device=/dev/i2c-1 --device=/dev/gpiomem --device=/dev/ttyAMA0 enviroplus-exporter
Using BuildKit you can build Raspberry Pi compatible images on an amd64.
docker buildx build --platform linux/arm/v7,linux/arm64/v8 .
To run this image under Kubernetes you'll need to recreate the docker --device options above.
In the Pod spec:
spec:
  containers:
    - name: ...
      volumeMounts:
        - { mountPath: /dev/i2c-1,   name: dev-i2c-1 }
        - { mountPath: /dev/gpiomem, name: dev-gpiomem }
        - { mountPath: /dev/ttyAMA0, name: dev-uart-0 } # For the PMS5003 on the Enviro+ only
      securityContext:
        privileged: true
  volumes:
    - name: dev-i2c-1
      hostPath: { path: /dev/i2c-1, type: CharDevice }
    - name: dev-gpiomem
      hostPath: { path: /dev/gpiomem, type: CharDevice }
    - name: dev-uart-0
hostPath: { path: /dev/ttyAMA0, type: CharDevice }See the open issues for a list of proposed features (and known issues).
Contributions are what make the open source community such an amazing place to be learn, inspire, and create. Any contributions you make are greatly appreciated.
- Fork the Project
- Create your Feature Branch (
git checkout -b feature/AmazingFeature) - Commit your Changes (
git commit -m 'Add some AmazingFeature') - Push to the Branch (
git push origin feature/AmazingFeature) - Open a Pull Request
Distributed under the MIT License. See LICENSE for more information.


