The original motivation of this model is to solve problem when there exist imperfect detection of counting number of birds/presence of tigers, meanwhile, not all sites are occupied by certain birds, which cause zero inflate, we need to model theses factors at the same time. People have already developed Zero-Inflated N-Mixture Model,(Joseph et al. 2009) for this situation.
But there is still one problem remain, especially when conducting large scale studies. Basic N-Mixture model and Zero Inflated N-Mixture models are still GLM type model, which means linear assumptions are still remained, which cause, for example, density of species was assumed to be linear related to a certain environment. One can add square or cubic terms, but have to try every options which may cause p-hacking.
Better way to count for non-linear relationship was needed. When detections are perfect (e.g. you can count every individual in a site if there exist some), people have already developed Zero-Inflated GAMs , (Hai Liu and Kung-Sik Chan 2010) which is a semi-parametric way to fit a Zero-Inflated Poisson model.
Combine these two model's strength is possible, by substitute Poisson distribution in COZIGAM using N-Mixture distribution, and useing the same algorithm of COZIGAM, we can develop a GAM version of Zero-Inflated N-Mixture Model.
BBS data will be used as a case to test the model.
The main function ZIGAM.R consists of 2 functional parts. A GAM version Zero-Inflated N-mixture Model and a GAM version of single species Occupancy model. Likelihood of the model directly follows Zero-Inflated N-Mixture Model,(Joseph et al. 2009) and Occupancy model. But the way of fitting it changed to GAM rather than GLM. The main algorithm generally follows the EM and modified PIRLS method suggested by R package COZIGAM , (Hai Liu and Kung-Sik Chan 2010). The EM-PIRLS will iterate until converge.
For the zero inflated N-mixture model, instead of using traditional linear regression strategy, here we use GAM version of all process including occupancy, latent lambda and detection probabilities. By adding one more EM step for the main Poisson-Binomial distribution we can deal with the missing observation of occupancy and latent n at the same time. Three GAMs for psi, lambda and p are fitted with "pseudo-data" generated from Estep of the EM algorithm and coupled usint the modified PIRLS. Though the point estimation of parameters comes from MPLE, the CI adopts a Bayesian frame work, follow the Laplacian approximation suggested by COZIGAM paper.
For the GAM-occupancy model, since the process is much simpler (no latent lambda), the algorithm of COZIGAM can be directly used to obtain the point estimation of parameters, but CI also adopts the Bayesian-Laplacian approximation approach.
Simulation have been done for a simple additive case without interaction terms, two environmental factors and one detection factor were simulated. Psi were set to be linear with env.1 and env.2, lambda has a bimodal relation to env.1 and unimodal relation with env.2, detection rate p is linear with env.1 and det.1 while no relation with env.2. Same setting with 100, 400 and 900 sites, 10, 20 and 40 repeats were tested. Difference between fit and real value was evaluated using relative 1-norm difference. Reaction curves were drew to compare the fit curves and real ones.
Results showed that the model is a data-hungry method which ask for 400 or more sites and 10 repeats. For 100 sites EM-PIRLS even did not converge. Relative difference according to 1-norm was 6.5% for psi, 12% for lambda and 5.8% for p in the 900 sites simulation. Detailed "landscape" evaluation can be found in Fig.4. Compare of reaction curve can be seen in Fig.1~3. There can be a scaling factor different for lambda and constant different for psi and p.
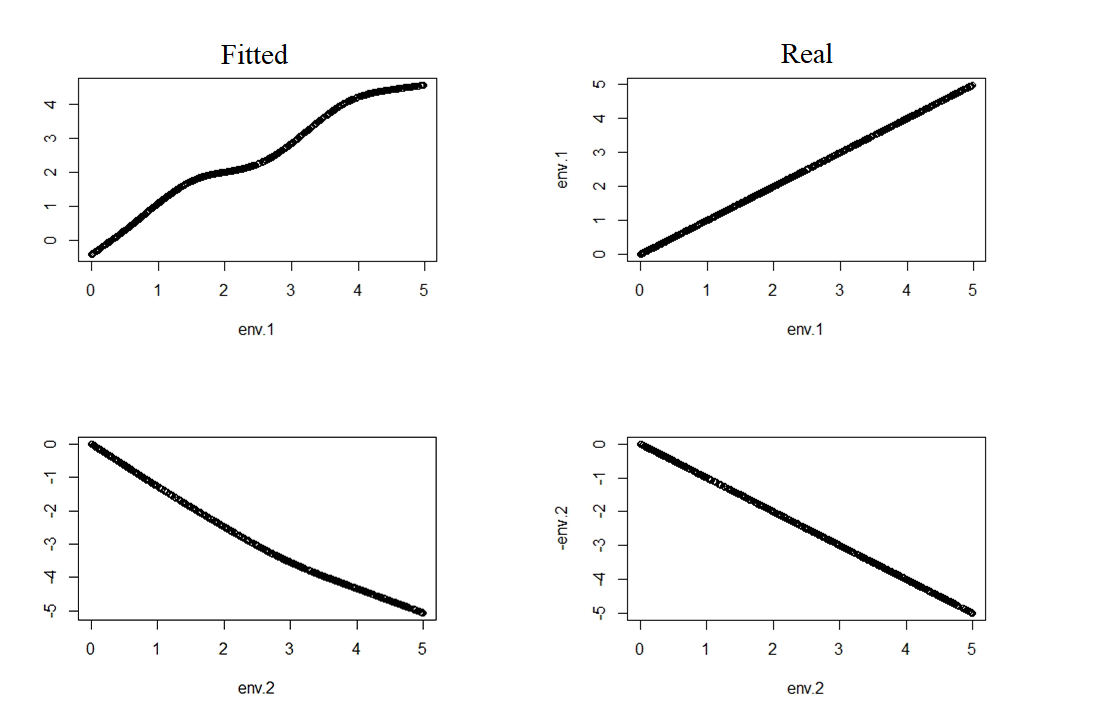 Fig.1 Reaction cure of psi, allow a additive constant difference.
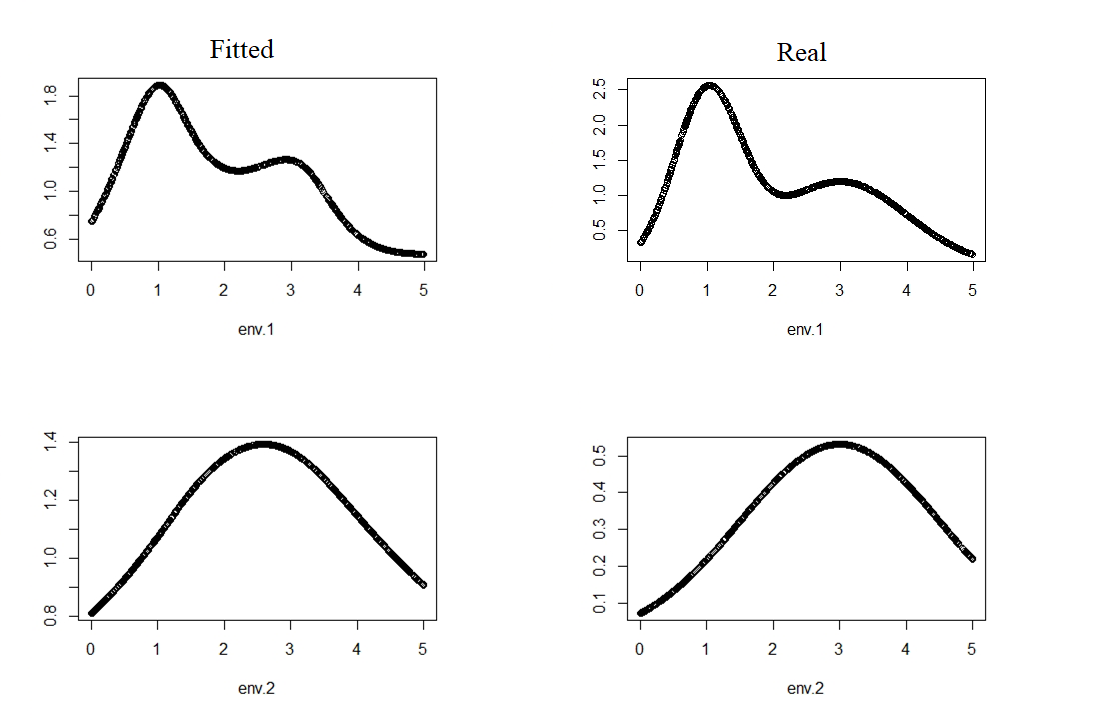 Fig.2 Reaction cure of lambda, allow a constant factor difference.
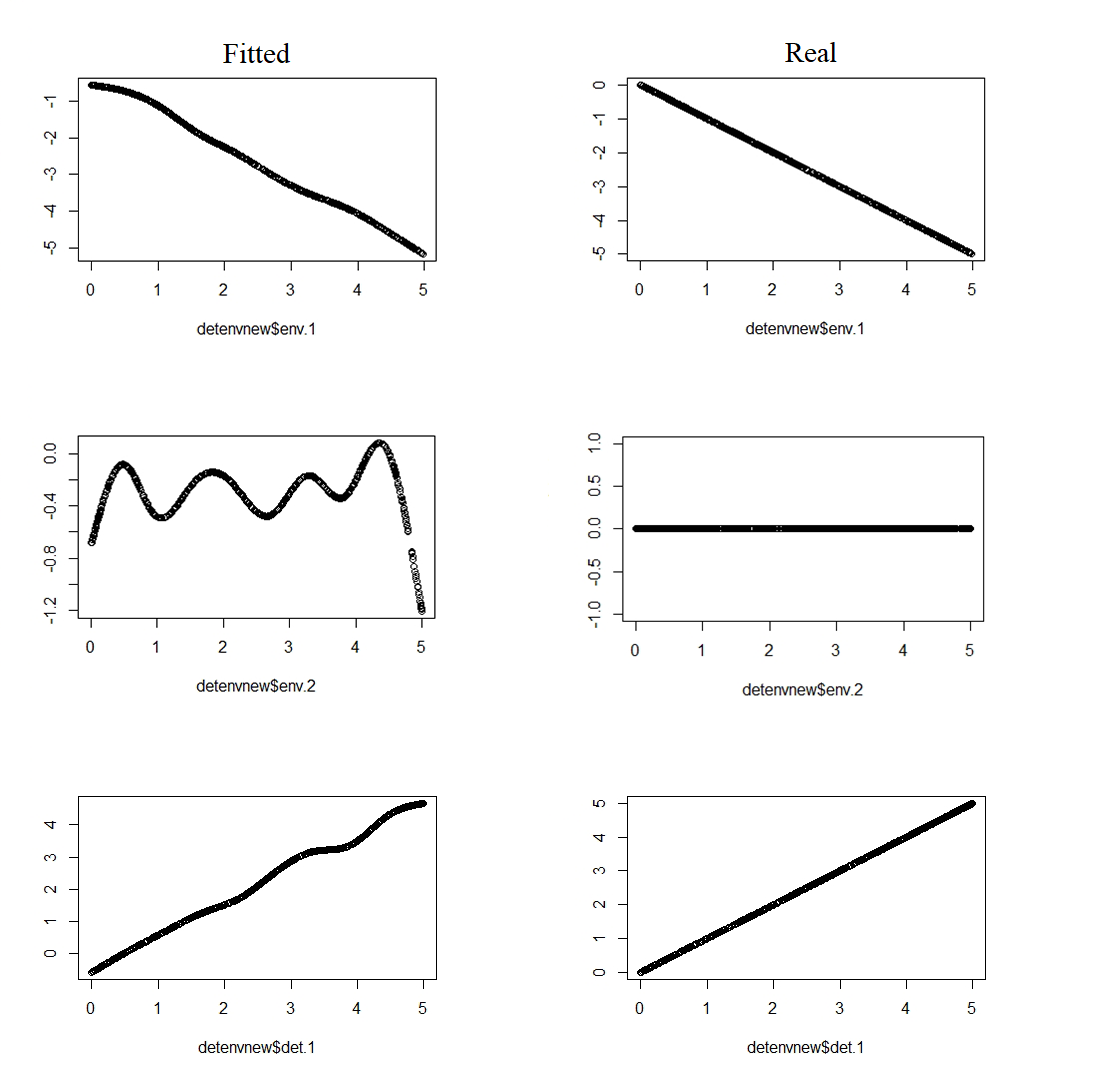 Fig.3 Reaction cure of p, allow a additive constant difference.
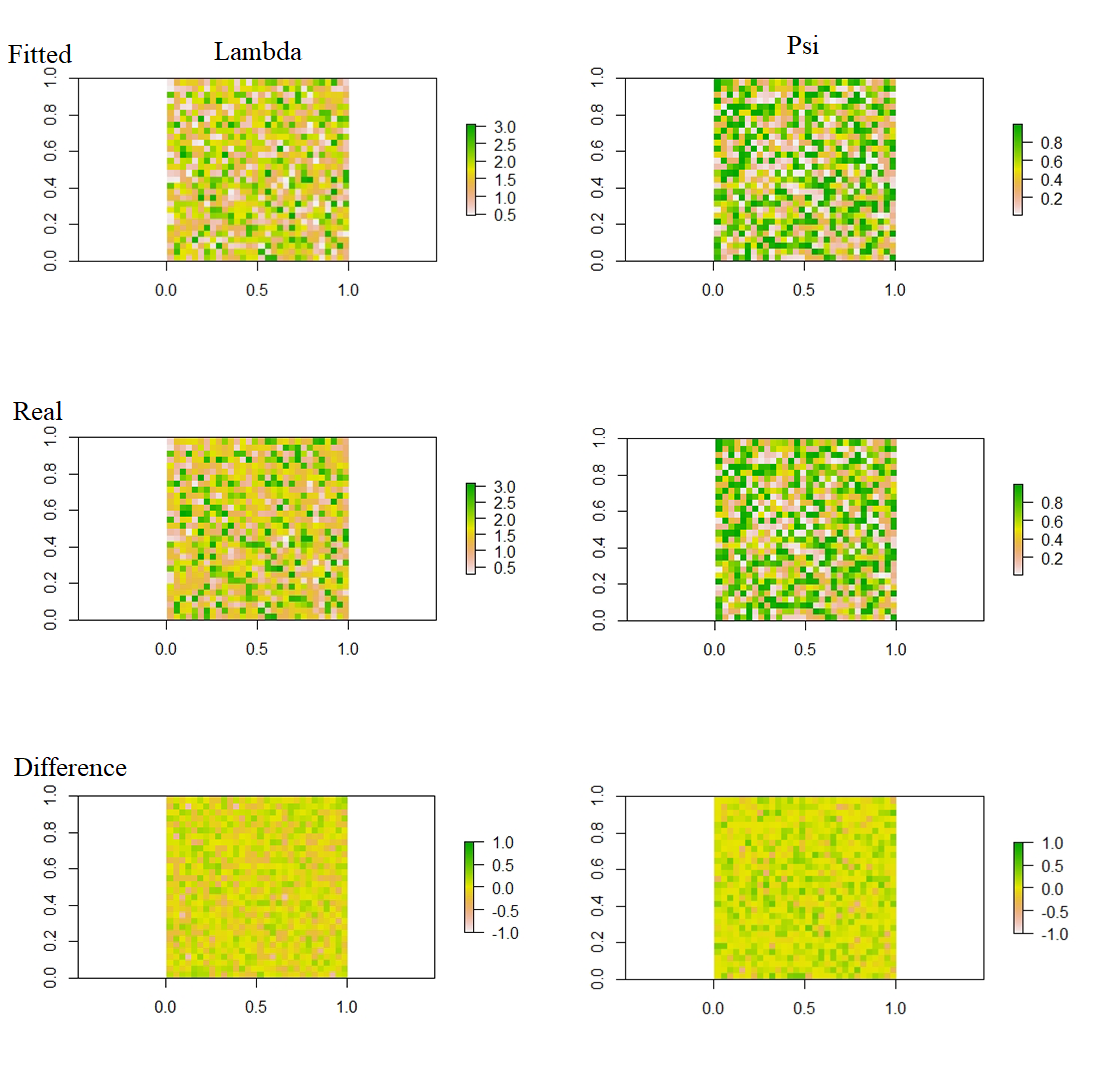 Fig.4 Lambda and Psi across the "landscape"