This GitHub repository is created to share the experimental data which is presented at the 42nd International Conference on Ocean, Offshore and Arctic Engineering (OMAE 2023) in Melbourne, Australia in the form of a conference paper 'Experimental Modeling of Water-Wave Interactions with a Flexible Beam'[1]. The paper has already been accepted for publication and will be available but only behind a paywall. A talk will also be delivered at OMAE 2023. The figure and the explanation mentioned here are taken from the paper. The paper presents a series of fluid-structure-interaction (FSI) experiments for studying water-wave interactions with a flexible beam in a wide range of sea conditions thus yielding a variety of FSI test-case data. The experimental campaign is carried out at the Maritime Research Institute Netherland's (MARIN's) concept basin. The concept basin is a 220m-long, 4m-wide and 3.6m-deep rectilinear basin with a carriage that can transverse along the basin's length. One end of the basin is equipped with a waveflap wavemaker to generate water waves while the other end has a wave-breaking beach to avoid wave reflection. The schematic diagram of the concept wave basin is shown in Fig. 1.
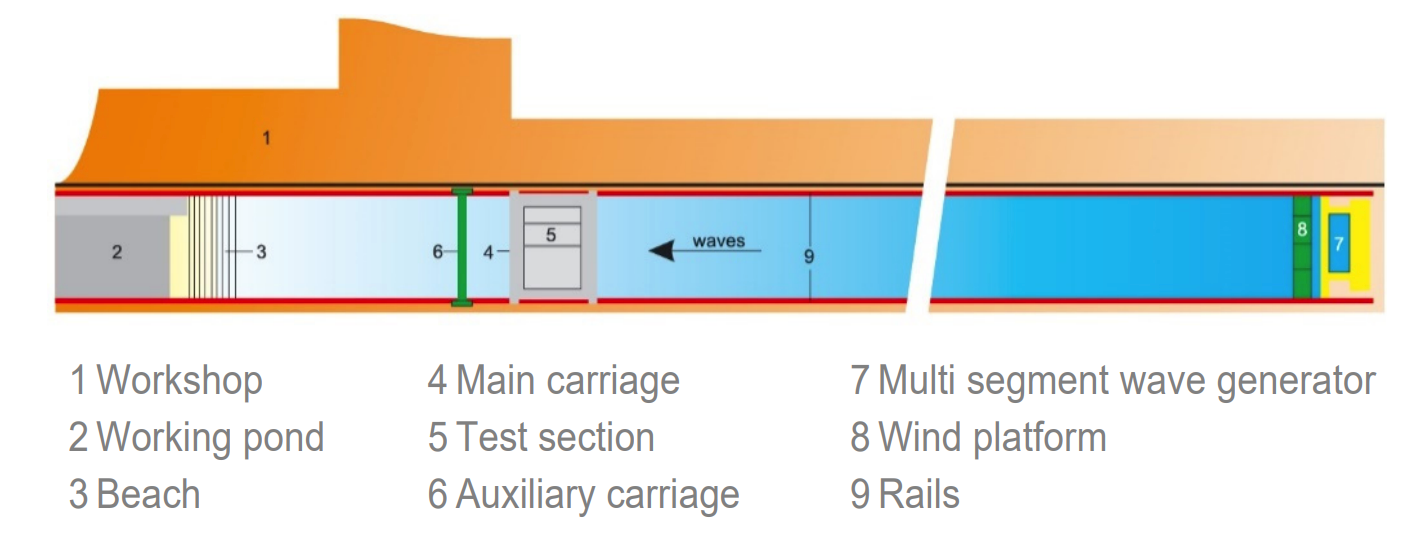 Figure 1: The MARIN's concept basin layout is explained [2].
The experimental setup includes a flexible beam which is fixed to the basin's carriage at one end while the other free end is submerged in the water. The setup is designed such that it admits the simultaneous measurements of incident waves and the beam's response. Hence, it is suitable for studying FSI problems. The details about the dimensions of the beam and arrangements of the sensors are described in the form of detailed CAD drawings which are given in CAD_fsi_beam_exp.pdf. The shared CAD drawings could be used in the future to reproduce the model. To enhance the users' understanding of the experimental setup, a 2D schematic diagram of the setup is shown in Fig. 2. (Note: The figure is taken from the above-mentioned OMAE paper which is not publically available yet.)
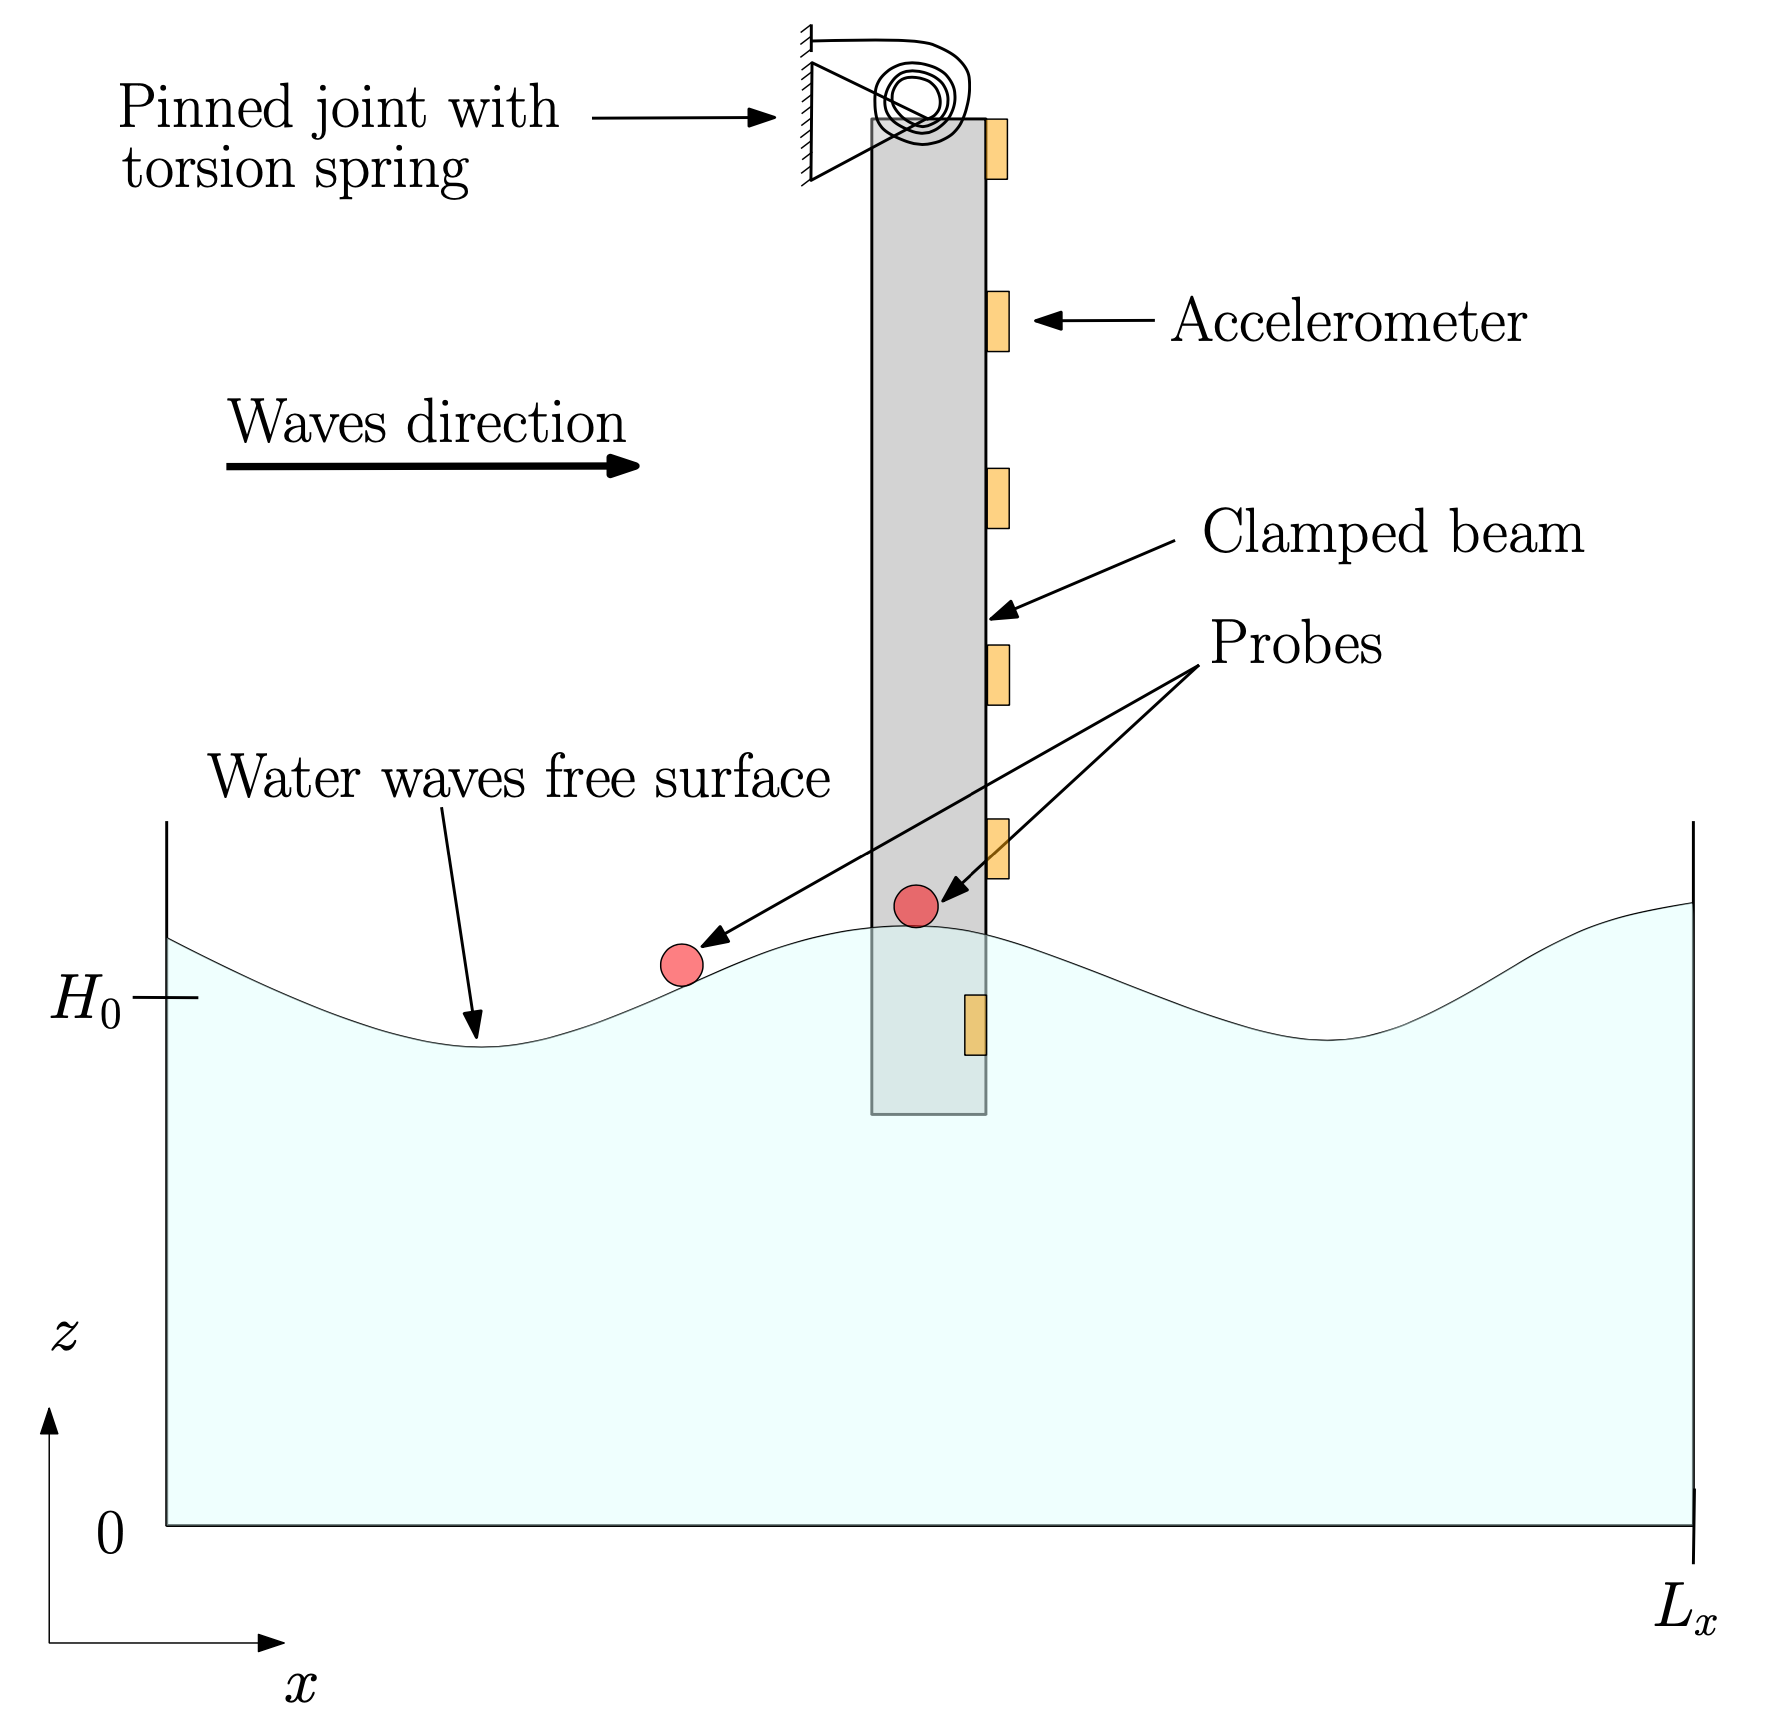 FIGURE 2: A two-dimensional schematic diagram of the experimental setup is shown. The beam is equipped with six accelerometers which are equally distributed along the beam's length. These accelerometers measure the beam response. There are two probes to measure the incident and the reflected water-wave elevation. The probe in the front of the beam measures the undisturbed incident wave and the probe parallel to the beam measures the change in the wave which is affected by the beam's motion [1].
The aim is to use these experimental data to validate FSI solvers commonly employed by the maritime industry in the design of fixed-foundation, offshore wind turbines. The study is divided into three experimental cases which are as follows (click on the case number to read more description):
Case-1 experiments: regular-water-waves interactions with the flexible beam when the carriage is at rest
- "Experimental Case 1 concerns interactions of regular waves with the flexible beam when the carriage is at rest; studying this case will facilitate the validation of linear FSI solvers in the non-resonant regime, since the non-linear dynamic response of beam is not excited by the incident-wave frequencies. This experimental case is further divided into two subcases corresponding to different submerged beam lengths. Subcases 1 and 2 respectively have 0.25m and 0.5m of the beam submerged"[1].
Case-2 experiments: regular-water-waves interactions with the flexible beam when the carriage is moving at a constant speed
- "Experimental Case 2 concerns interactions with the flexible beam when the carriage is moving at a constant speed. Moving the carriage changes the frequency of encounter between beam and waves, so that the dynamic response of the beam and its interaction with water waves, particularly at the onset of resonance, can be studied. By changing the steepness of the regular waves, both linear and nonlinear FSI solvers can be validated. This experimental case is further divided into two subcases corresponding to different submerged beam lengths. Subcases 1 and 2 respectively have 0.25m and 0.5m of the beam submerged"[1].
Case-3 experiments: irregular-water-waves interactions with the flexible beam when the carriage is at rest
- "Experimental Case 3 concerns steep, irregular-wave interactions with the flexible beam when the carriage is at rest. This is the most complex case and is designed to yield data on structural dynamics due to nonlinear wave-loading processes related to steep and breaking waves. This case will help to validate the high-fidelity FSI solvers"[1].
"All measurements are given in the form of .h5 format files, each of which has a corresponding .pan format file containing details of measurement names, units, frequency, maximum, minimum and standard deviation. The data presented is classified into different folders given as follows:"
- Folder Exp1_carriage_rest_0.25m;
- Folder Exp1_carriage_rest_0.5m;
- Folder Exp2_carriage_moving_0.25m;
- Folder Exp2_carriage_moving_0.5m;
- Folder Exp3_irreg_waves_0.25m;
- Folder Exp3_irreg_waves_0.5m; and
- Folder hammer_test.
The description of the measurement and corresponding wave parameters is given in each folder.
All the main folders have several sub-folders and each sub-folder consists of mainly two types of files, i.e. .pan and .h5m. The files with extension .pan state the general information about experimental tests and sensors in text format. These .pan have three rows and the third row is divided into several columns. The second row states the information related to the experimental test, for example, the test number (80372_XXCB_XX_XXX_XXX_XX), project name (AEGRE), submerged depth of the beam (Proeven XX), gain, facility name (CB stands for concept basin), and scale (1.000). The first column of the third row shows the abbreviated sensor names which are explained in the table below.
TABLE 1: The names and descriptions of the sensors are listed.
| Name | Description |
|---|---|
| C.SPEED | Speed of the carriage |
| WAVE.FORE | Wave elevation measured by the probe located at the front of the beam (26.25 m away from the wavemaker) |
| WAVE.SB | Wave elevation measured by the probe located parallel to the beam (30 m away from the wavemaker) |
| AX_i | Accelerations of the beam in x direction recorded by accelerometer, where i denotes the accelerometer number |
| AY_i | Accelerations of the beam in y direction recorded by accelerometer, where i denotes the accelerometer number |
| AZ_i | Accelerations of the beam in z direction recorded by accelerometer, where i denotes the accelerometer number |
| Flap 3 Pos | Position of the waveflap wavemaker |
The number with the accelerations, e.g. AX.1, AY.2, and AZ.3, denotes the position of the accelerometer along the beam. The response of the beam is dominant in the direction of wave, i.e. x-direction, therefore the .h5m files contains accelerations in x-direction for all of the accelerometers. The accelerometers are numbered from 1 to 6, where accelerometer number 1 is at the submerged free end of the beam while accelerometer number 6 is located at the fixed end of the beam. The rest of the accelerometers are numbered 2 to 5 from the free end to the fixed end. The files with extension .h5m contain the actual time-domain measurements obtained from the sensors. Each .h5m from the experimental case contains acceleration signal from all six accelerometers in the x-direction, wave elevation measured by the probe that is 26.25 m away from the wavemaker, wave elevation measured by the probe that is 30 m away from the wavemaker, carriage speed, and variation waveflap position throughout the run. These measurements can be read with the help of post-processing code. The post-processing codes based on MATLAB and Python scripts, with comments, are shared. The names of the MATLAB and Python scripts are read_model_tst.m and read_model_tst.py respectively. Each script needs the name of the .h5m file as user input. In addition to reading the .h5m file, the script plots the signals from the sensors. For demonstration, the provided MATLAB script is used to plot the comparison of the wave maker position with the wave elevation measured by the wave probe that is 26.25 m away from the wavemaker.
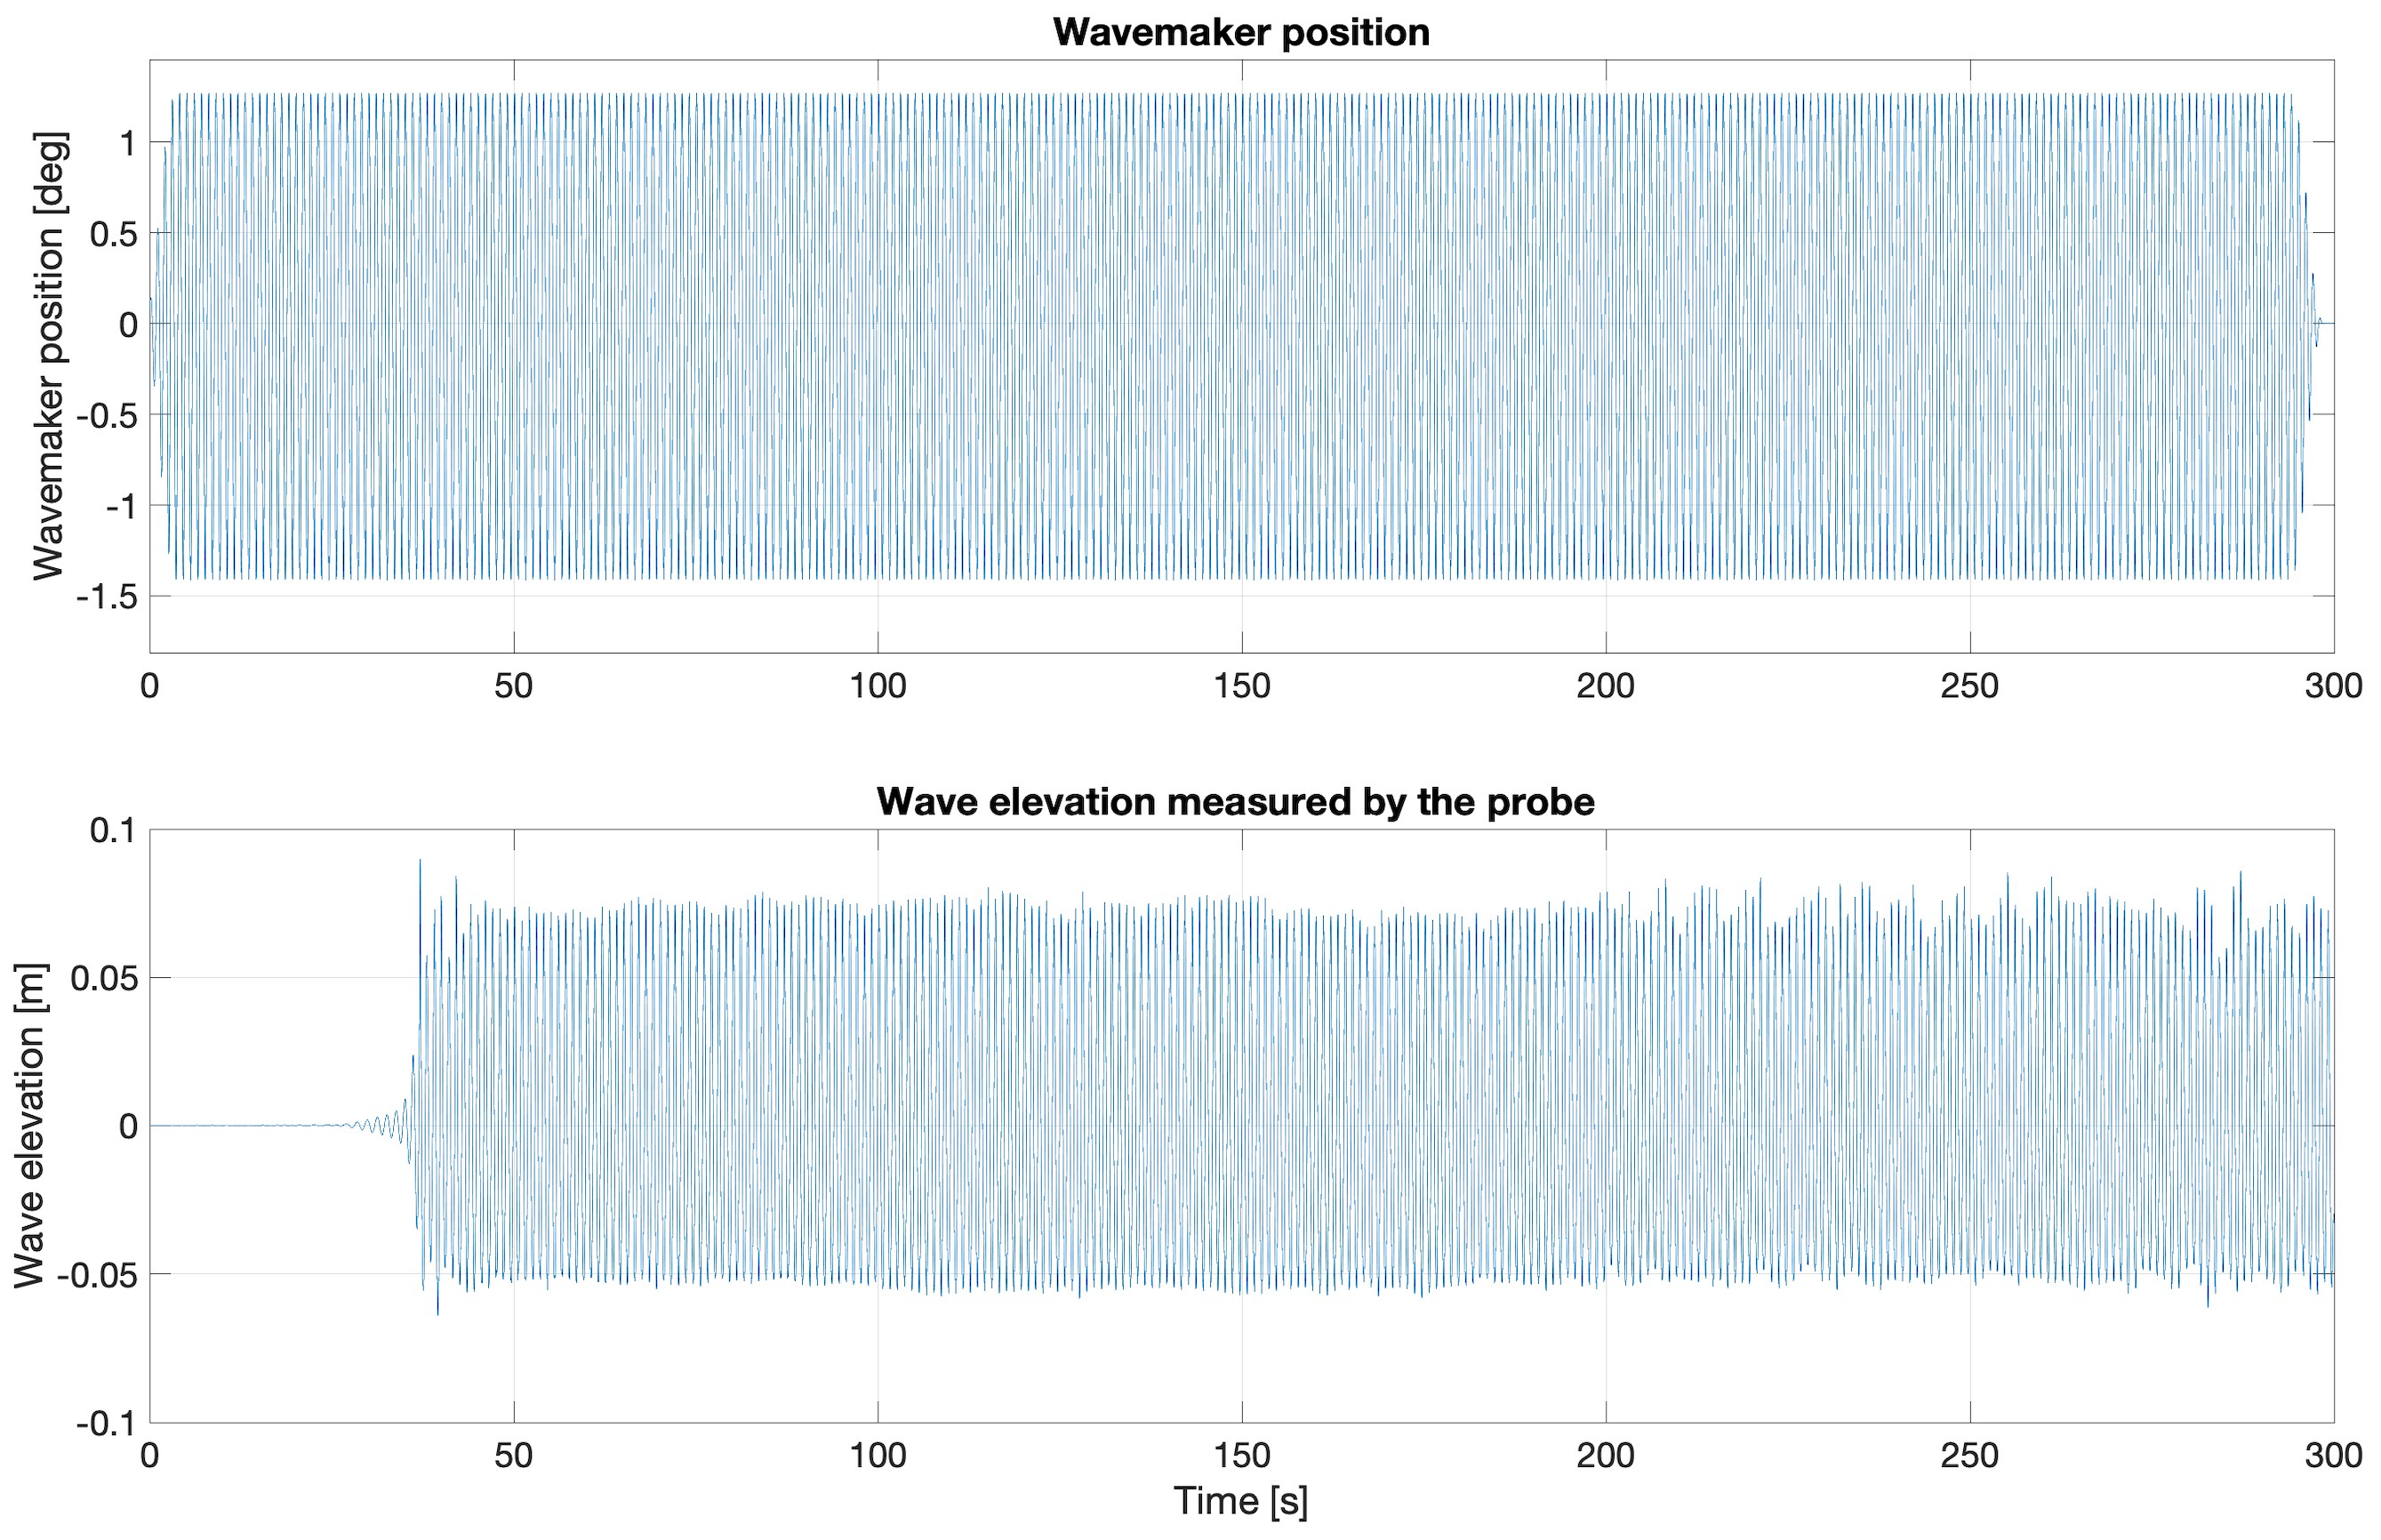 FIGURE 3: The top plot shows the variation of the position of the waveflap wavemaker (x = 0 m) as time proceeds. The bottom plot shows the signals measured by the wave probe (x = 26.25 m) which is located in front of the beam.
A visual analysis of the top plot in Fig. 3 shows that the wavemaker starts moving gradually from 0 seconds and takes approximately 4 to 5 seconds to reach its maximum position because the wavemaker motion is ramped when it is about to commence and terminate. This ramped motion helps to keep the free surface smooth. It can be noticed from the bottom plot that the wave probe starts to measure the wave elevation at approximately 26 seconds which is because the probe is located 26.25 m away from the wavemaker. Similar to the wavemaker motion, the initial wave elevation signal detected by the probe is small in amplitude which gradually increases to maximum amplitude. In this case, the wave period is 1 second and the wavelength is 1.56 m. The test is run for 300 seconds which means the probe measures the reflected waves in the last 40 seconds of the test. Although, in this case, the effect of the reflected wave on the incident wave is not significant, it is preferable to use the wave data which is not affected by the reflected waves for the code validation purpose. As a demonstration of the Python script, one of the plots that are generated by this script is shared in Fig. 4 which shows a comparison of the incident wave and the beam's response to the incident wave in the form of two sub-plots.
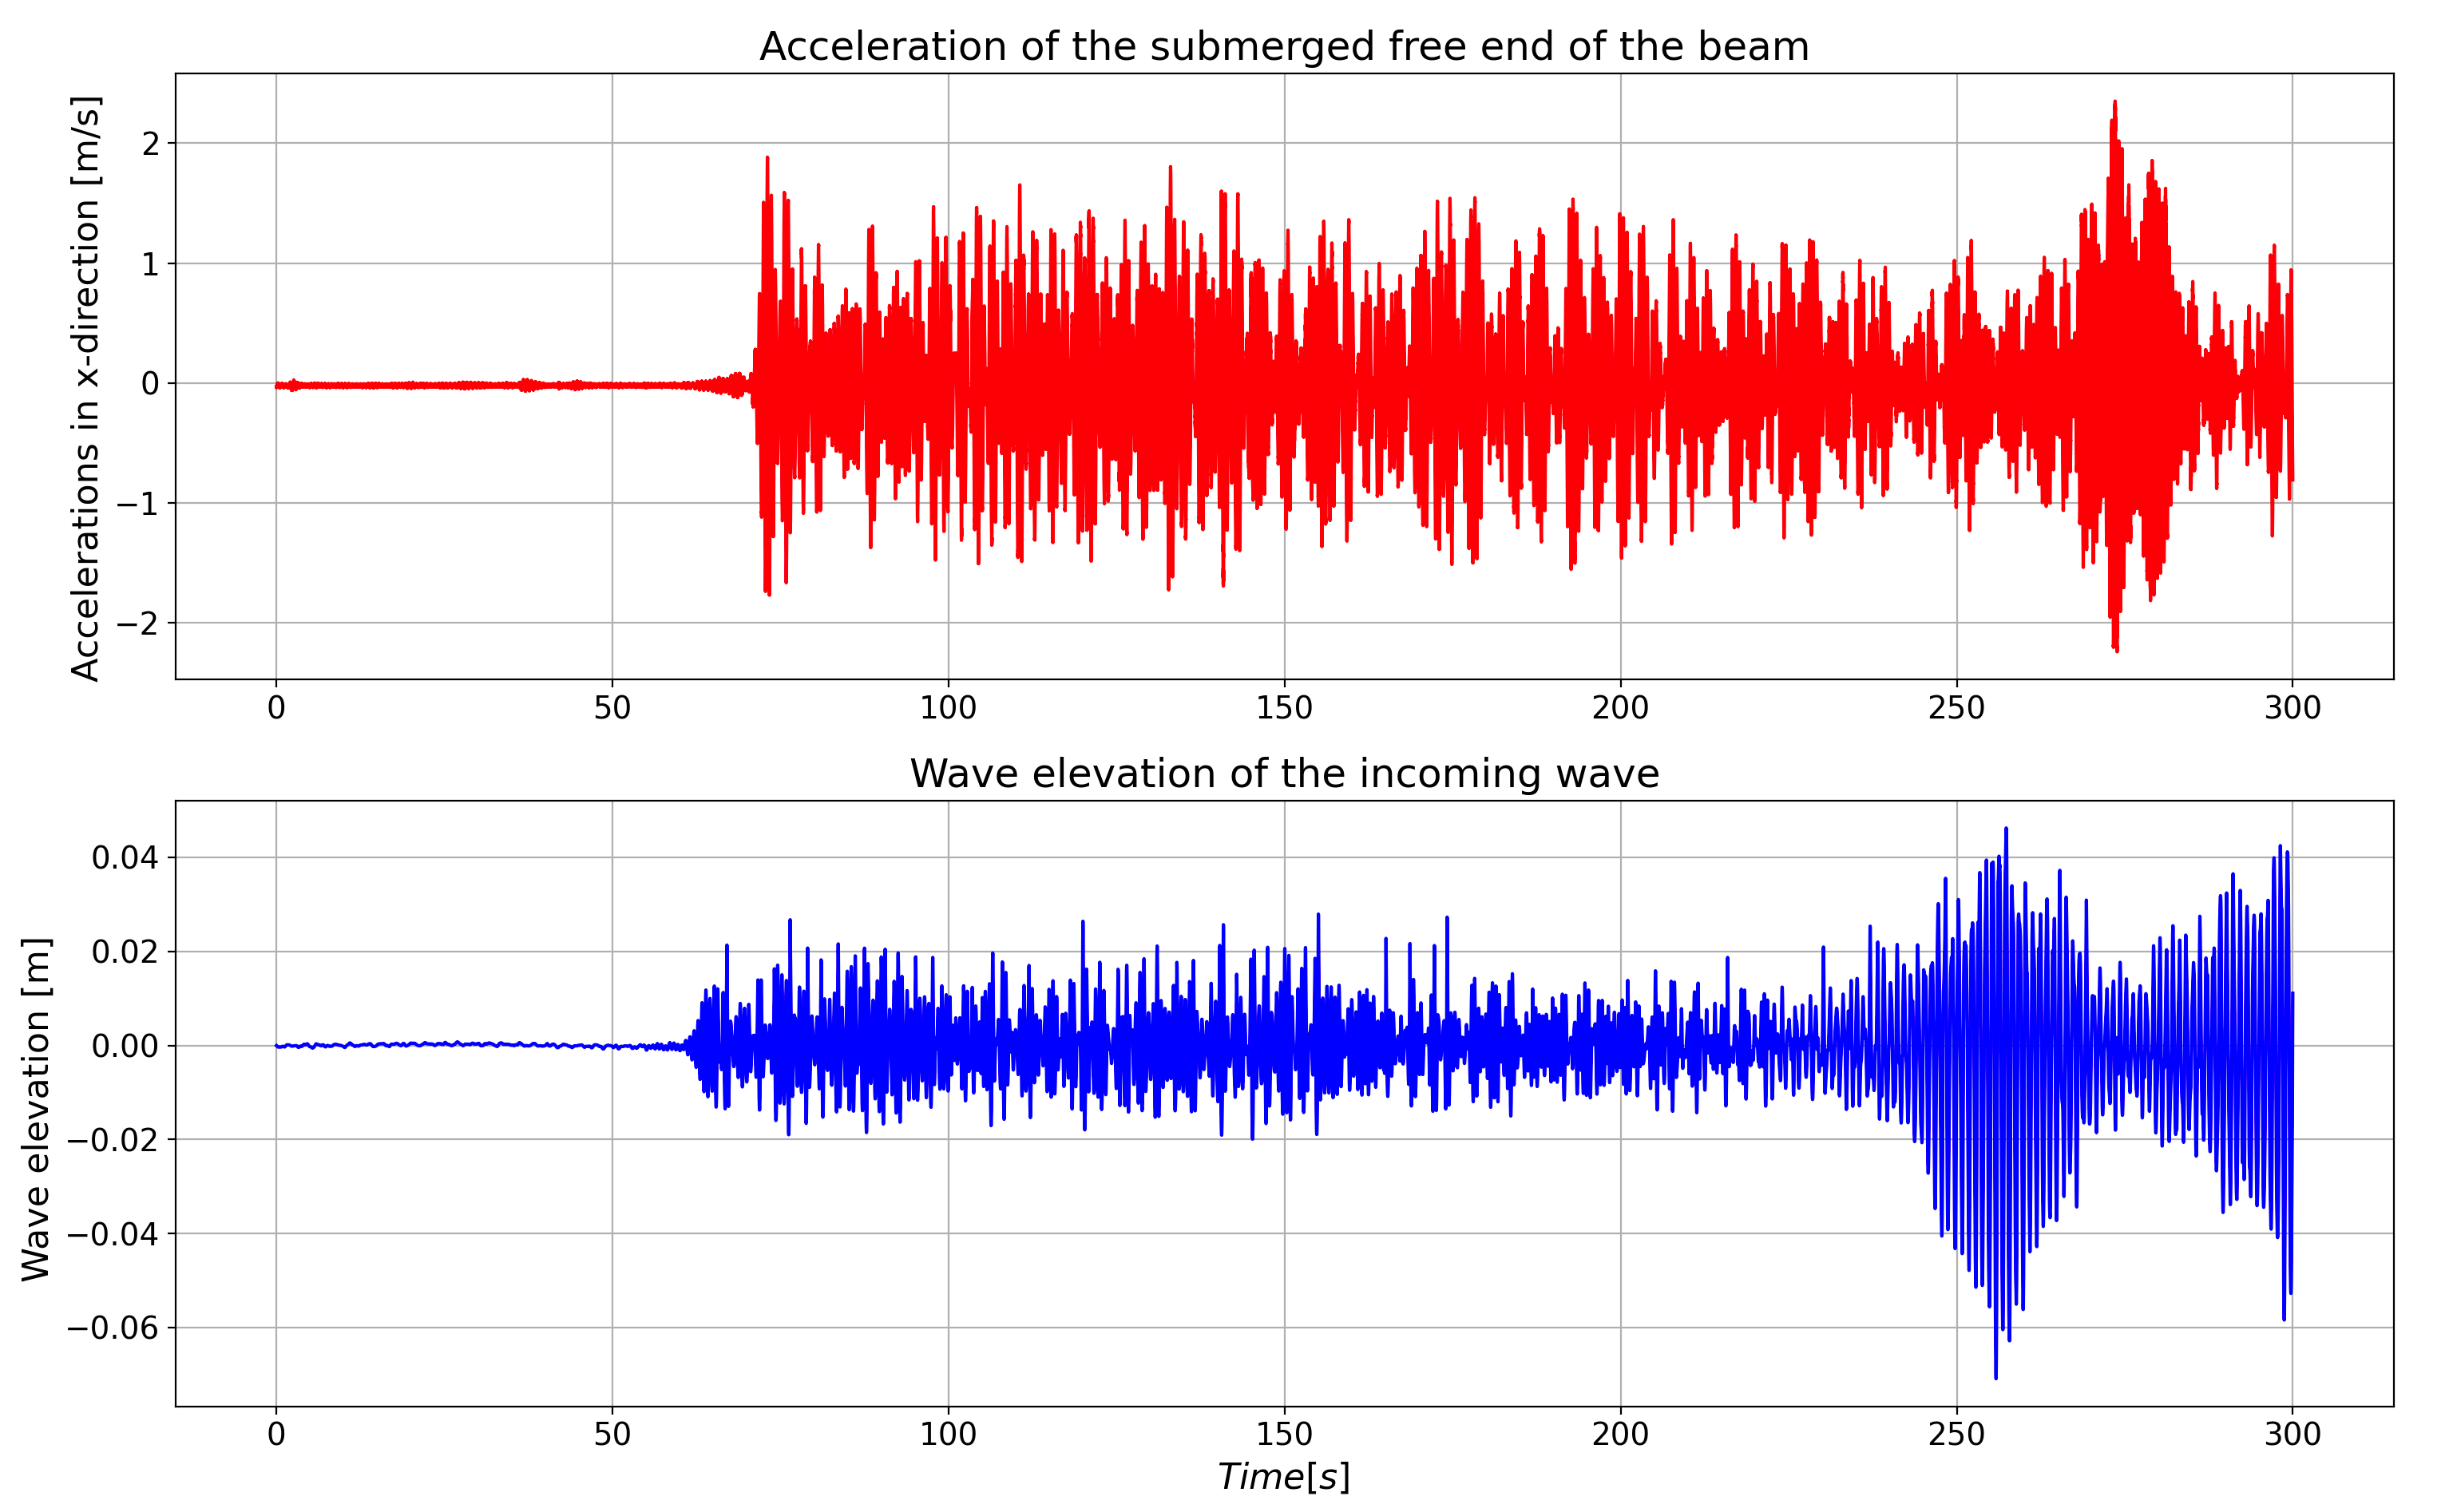 FIGURE 4: The top plot shows the accelerations obtained from the accelerometer located at the submerged free-end of the beam (x = 30 m) when the incident wave, shown in the bottom plot, interacted with the beam.
It can be noticed that the signals in the last 50 seconds of the run are affected by the reflected waves. Therefore, the user should use the part of the signal that is not affected by the reflected waves for the code validation purpose.
This section explains the procedure to numerically reproduce the wavemaker motion from the experimental study in numerical wavetanks which are presented in another OMAE 2023 paper 'A Systematic Approach of Developing a Numerical Wavetank to Simulate Driven Shallow- and Deep-Water Waves'. To numerically reproduce the same wavemaker motion as in the experimental study, the measured data is linearly interpolated which then can be assigned to a numerical function at each time step. The numerical time step is often smaller than the experimental time step due to the CFL condition; therefore we interpolate the measured data by using the first-order polynomial. The measured and interpolated wavemaker motion are plotted in Fig. 5.
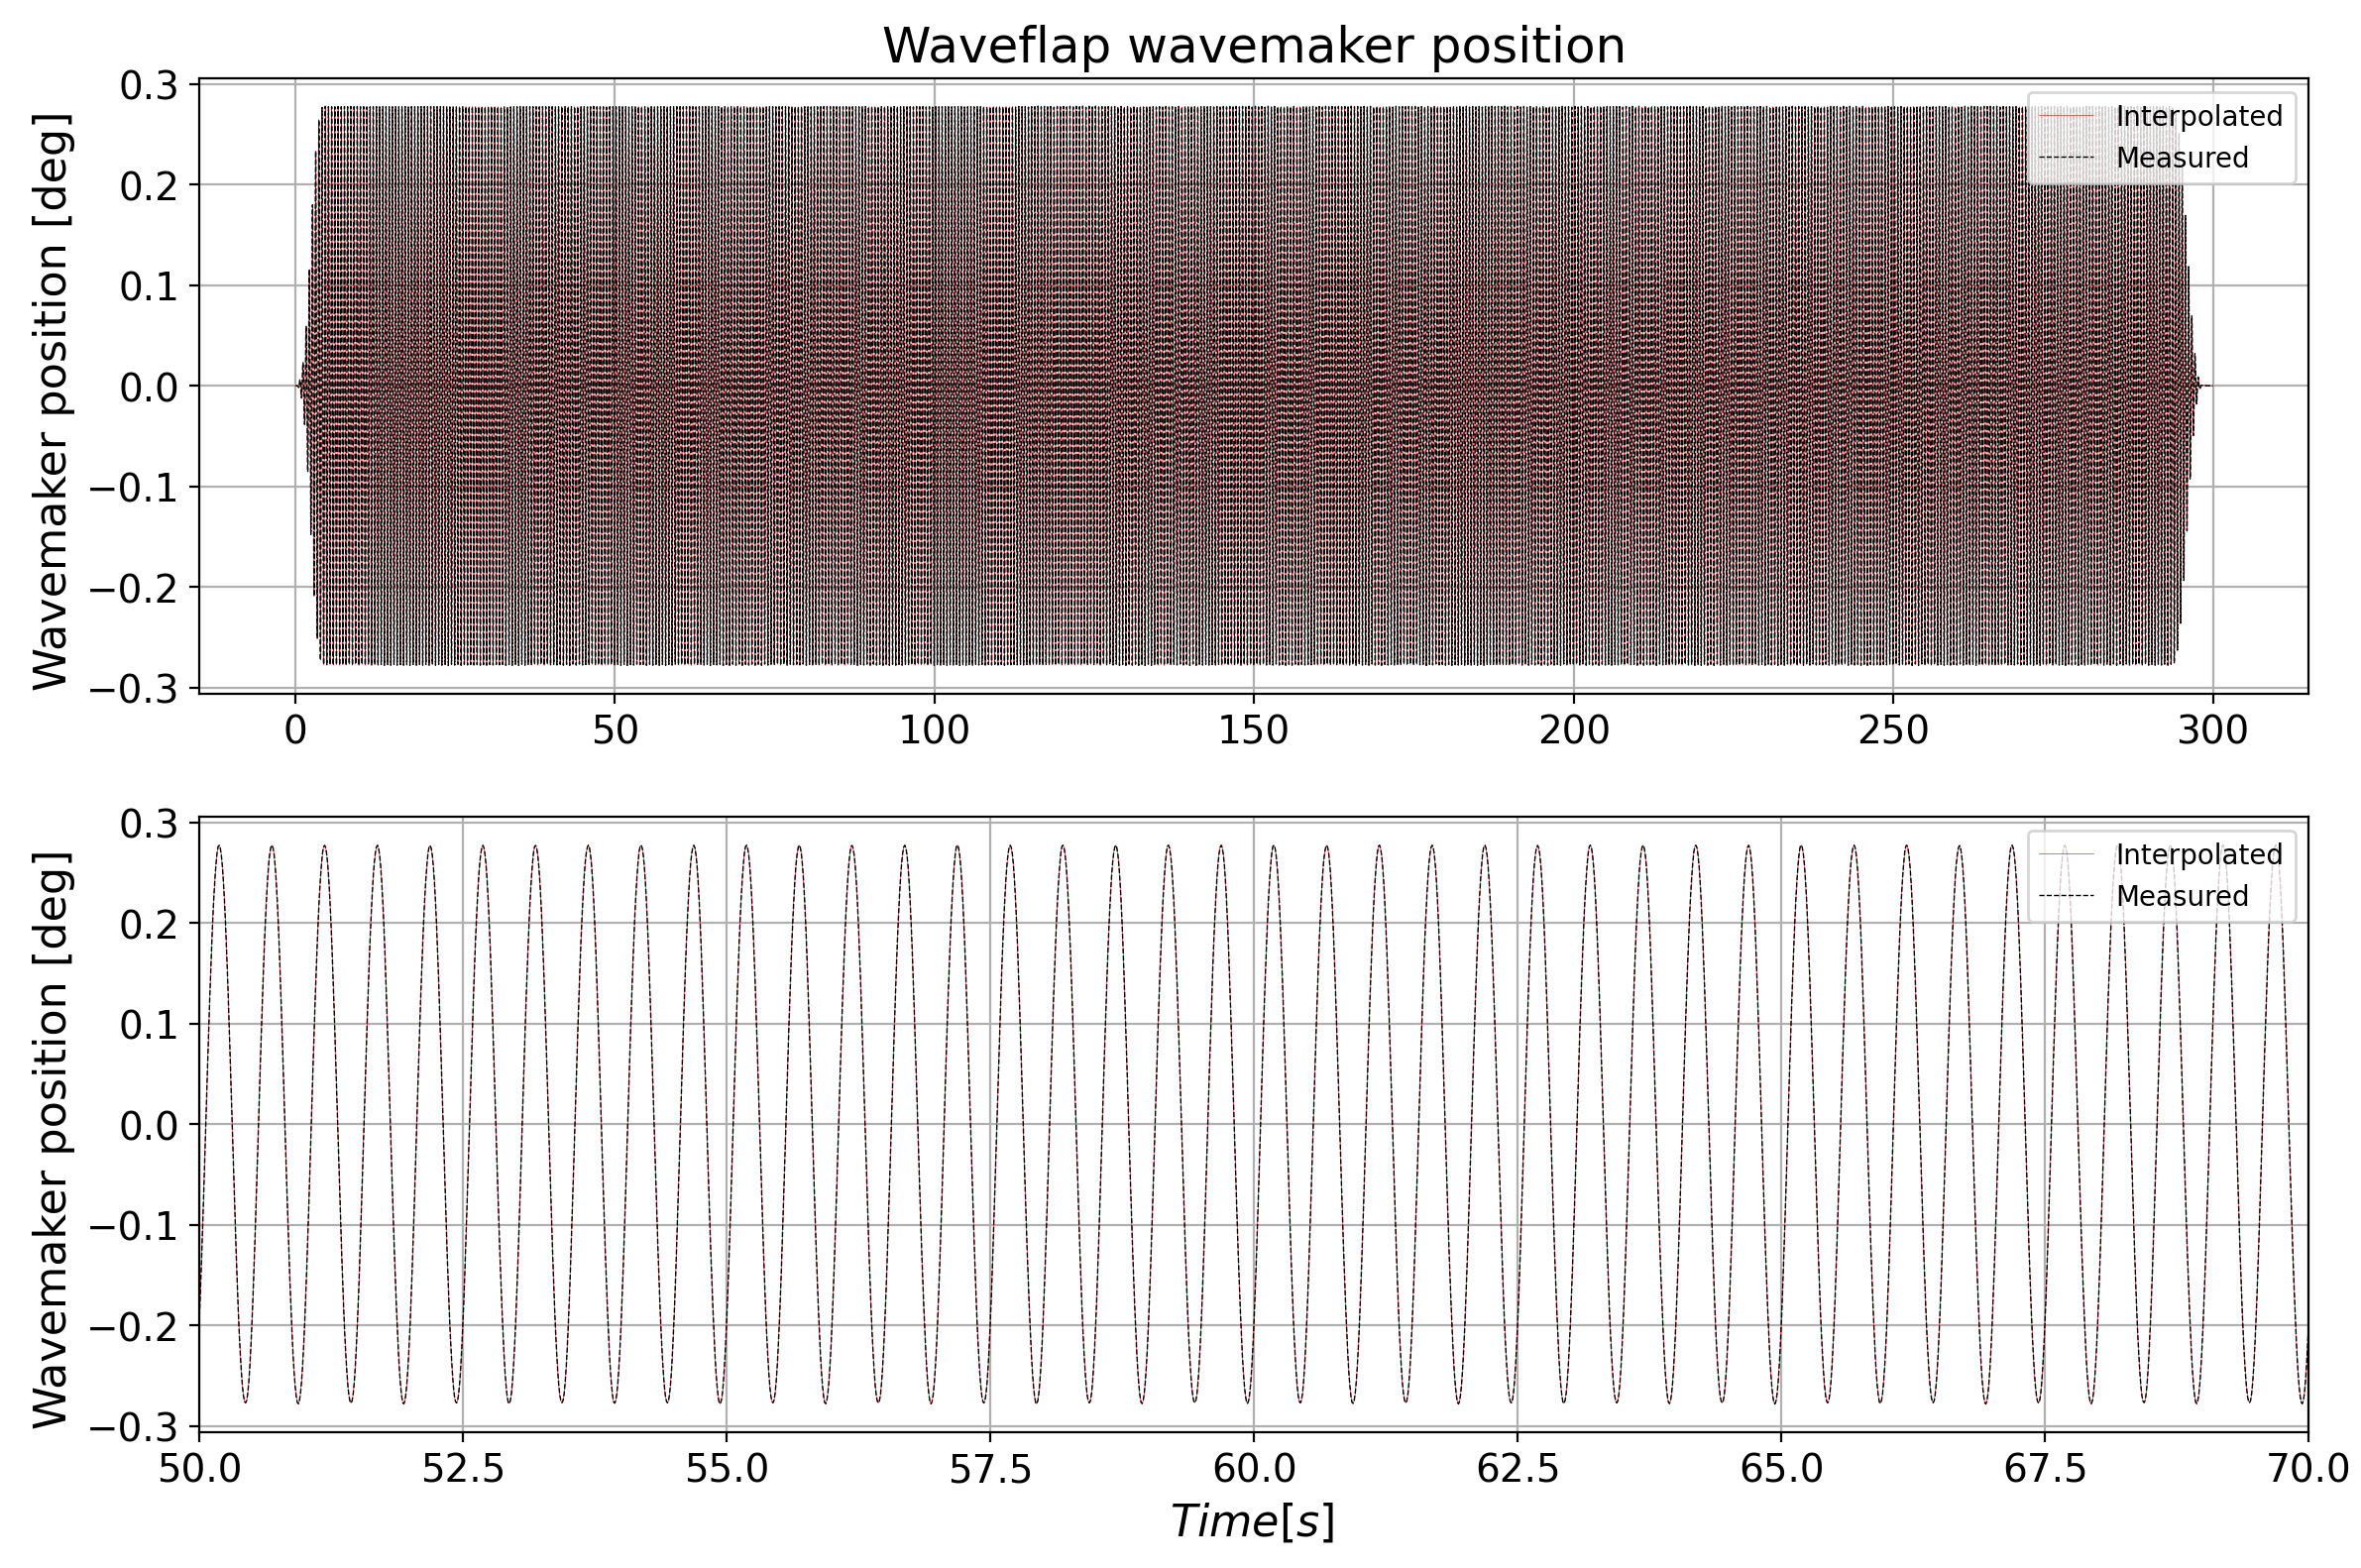 FIGURE 5: The top plot shows the comparison of the interpolated (solid red line) and measured (dotted black line) wavemaker motion during one complete test and the bottom plot shows the zoomed-in part of the comparison shown in the top plot.
The plots shown in Fig. 5 can be generated by using the shared Python script waveflap_wavemaker.py. The plot presented in Fig.5 is generated by 80372_02CB_05_051_001_01.h5m from the subfolder 1_51 of Exp1_carriage_rest_0.25m. Each experimental case has a .h5m file which contains the corresponding wavemaker motion. The user only needs to change the file name in the code. It can be noticed that the interpolated signal agrees well with the measured signal, as the plots are visually indistinguishable.
[1] Rehman, W., Bunnik, T., Bokhove, O. and Kelmanson, M. “Experimental Modeling of Water-Wave Interactions with a Flexible Beam.” Proc. ASME 2023 42nd Int. Conf. on Ocean, Offshore and Arctic Eng.: p. 10. 2023. ASME.
[2] MARIN Concept Basin.” file:///Users/mmwr/Downloads/Concept_Basin.pdf. Accessed: 19-11-2022.