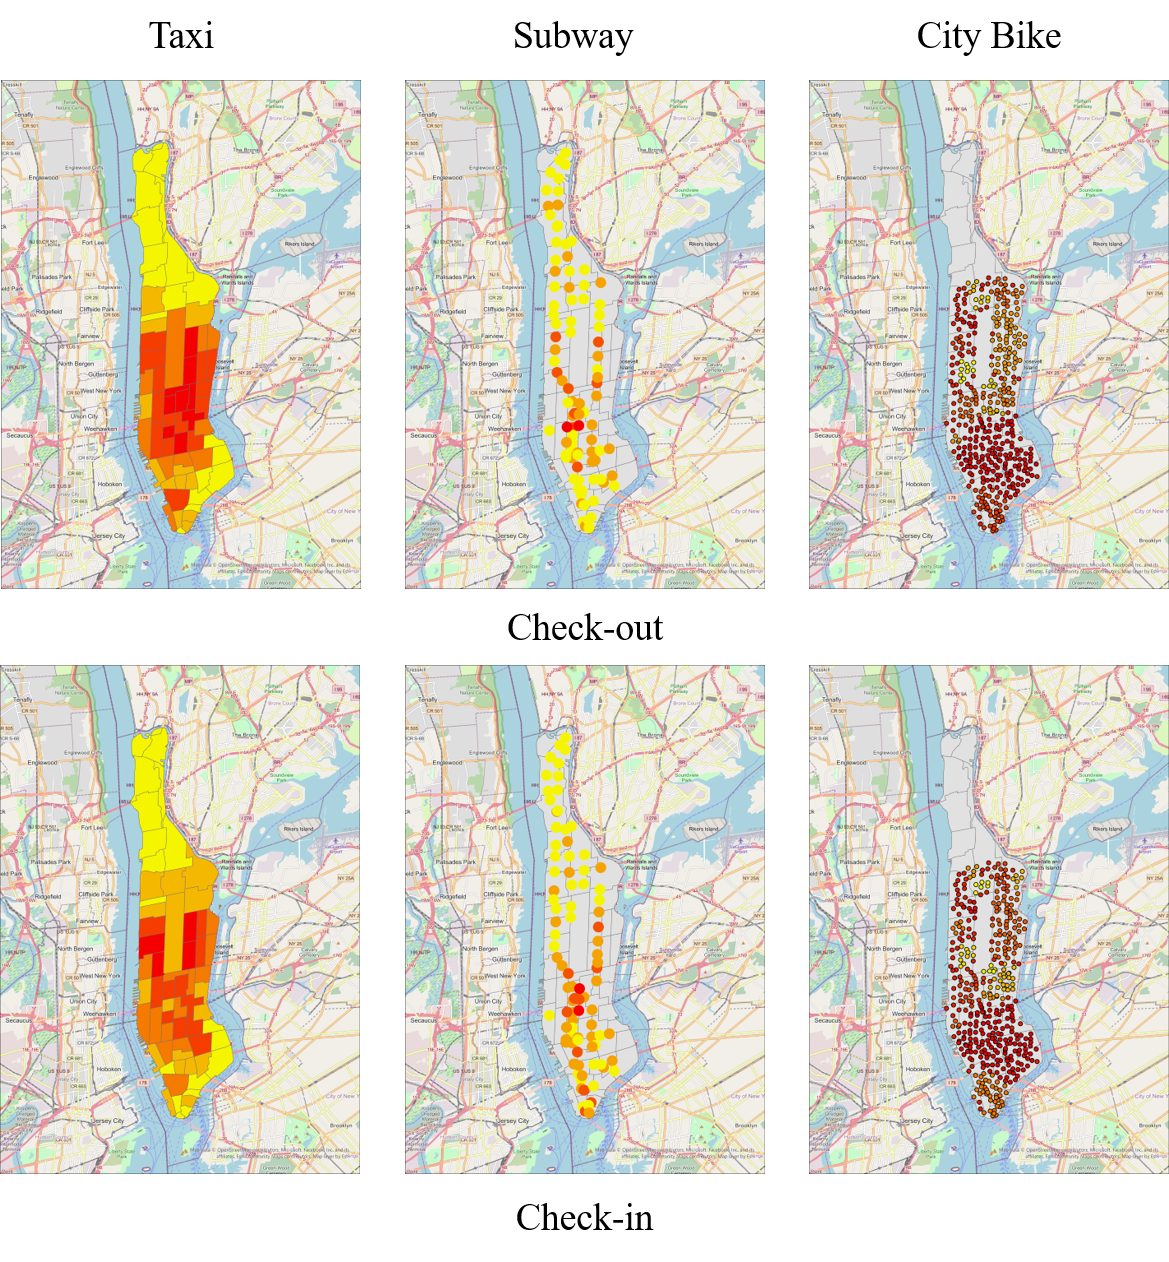
This is a data processing project that involves the three-peak multimodal transportation system in New York City's Manhattan borough, including information on yellow taxis, subways, and shared bicycles. Additionally, it also encompasses external attribute data such as Points of Interest (POI) and weather in New York.
The temporal range of the data is from 0:00 on March 1st, 2018 to 0:00 on September 1st, 2018. Due to the sampling interval of the subway data being 4 hours, the unified time interval is also set to 4 hours, resulting in a total of 1,104 data nodes for half a year. Additionally, this project is applicable to other time periods. The download link for the source data can be found below. This project provides a three-peak system for Manhattan, New York, including Yellow Taxis, Subways, and Citi Bike. Furthermore, it also includes additional external attributes such as POI and Weather data.
The data_main.py is the entry point of the program, if you want to execute this program please run
python data_main.py
in the terminal. Next, we will introduce the details of each mode of transportation separately.
Data source address:TLC Trip Record Data.
Extension:PARQUET
The difference between Yellow Taxi and Green Taxi: Yellow taxi (Yellow TAXI) can pick up passengers anywhere in the five major districts of New York (Bronx, Brooklyn, Manhattan, Queens, Staten Island). Green taxis are only allowed to pick up passengers in Upper Manhattan, the Bronx, Queens and Staten Island.
Processing: orders with unreasonable travel time and travel distance are dropped.
Description: After deleting the partitions of the islands, there are a total of 63 partitions in Manhattan, and the adjacency matrix is numbered from small to large. A total of 29.25 million travel records, with an average daily travel volume of 15.9W.
Output Format: Data is persisted as pkl.Format isOrderdict{0:[Sparse OD,TIMESTEMP]}
More details: ytaxi.py
How to run it: python data_main.py --type 0
Data source address:MTA.
Extension:txt
Station Match: The spatial data of subway stations has troubled me for a long time. There is a difference between the geographic file MTA NYC Transit Subway and the one provided by the MTA. We stitch it manually according to the station-line.
Processing: The core task is the processing of the temporal dimension, which includes 4 parts: delete duplicate data; delete records where the cumulative data of the next day is less than the cumulative data of the previous day; Delete the value with too much input and output (set to 0); since some stations are not strictly 4-hour sampling, we time-align them.
Description: A total of 93 stations were adopted after data processing.
Output Format: Data is persisted as pkl.Format is[[N,T,2],STATION INDEX]
More details: subway.py
How to run it: python data_main.py --file_path ./datasets/subway --type 2 --extenstion txt --zone_path ./datasets/subway/stations.csv --pkl_path subway.pkl
Data source address:Citi Bike.
Extension:ZIP
Station Match: After GIS screening, Manhattan contains a total of 439 stations.
Processing: 1. Delete nan data. 2. Delete orders with abnormal trip duration. 3. Delete sites with too few check-in and check-out.
Description: A total of 427 stations were adopted after data processing. The total travel records are 725w, with an average of 3.9w per day
Output Format: Data is persisted as pkl.Format is[Orderdict[0:[Sparse OD,TIMESTEMP]],[zones index]]
More details: bike.py
How to run it: python data_main.py --file_path ./datasets/bike --type 1 --extenstion zip --zone_path ./datasets/bike/station_id_mat.csv --pkl_path bike.pkl
NOTE: The demand for citi bike is extremely sparse. In order to improve the availability of data, most methods are to cluster the shared bicycle station first. You can refer to this paper
Data source address:Synoptic Data&POI.
Extension:CSV&ZIP
Processing: Meteorological data fills forward the weather conditions and wind speed data. According to the literature , the weather conditions are divided into 4 categories, snowy, rainy, foggy, and sunny. The POI data counts the number of each class in each Manhattan subdivision according to 13 types.
Description: Weather condition: If there is snow and rain in the time interval, it is considered snow; if it is rainy and foggy, it is considered foggy; if it is foggy and sunny, it is considered foggy.
Output Format: Data is persisted as pkl.Format isOrderdict[[Average temperature, average relative humidity, average wind speed, average visibility, average weather conditions],[Timestemp]]
How to run it: I'm sure you can write a beautiful piece of logical code to handle them. However, POI may be accessed by ArcGis.
All data is persisted and saved as pkl data, which follows a unified data loading format.
Visualization

Geospatial Processing Contact:591176637@qq.com
code Contact: obitowen@csu.edu.cn
At last, thank you very much for the contribution of the co-author in the article, and also thank my girlfriend for giving me the courage to pursue for a Ph.d.
MIT © YanjieWen