The goals / steps of this project are the following:
- Perform a Histogram of Oriented Gradients (HOG) feature extraction on a labeled training set of images and train a classifier Linear SVM classifier
- Optionally, you can also apply a color transform and append binned color features, as well as histograms of color, to your HOG feature vector.
- Note: for those first two steps don't forget to normalize your features and randomize a selection for training and testing.
- Implement a sliding-window technique and use your trained classifier to search for vehicles in images.
- Run your pipeline on a video stream (start with the test_video.mp4 and later implement on full project_video.mp4) and create a heat map of recurring detections frame by frame to reject outliers and follow detected vehicles.
- Estimate a bounding box for vehicles detected.
###Histogram of Oriented Gradients (HOG)
####1. Explain how (and identify where in your code) you extracted HOG features from the training images.
The code for this step is contained in the 3rd - 5th code cell of the IPython notebook.
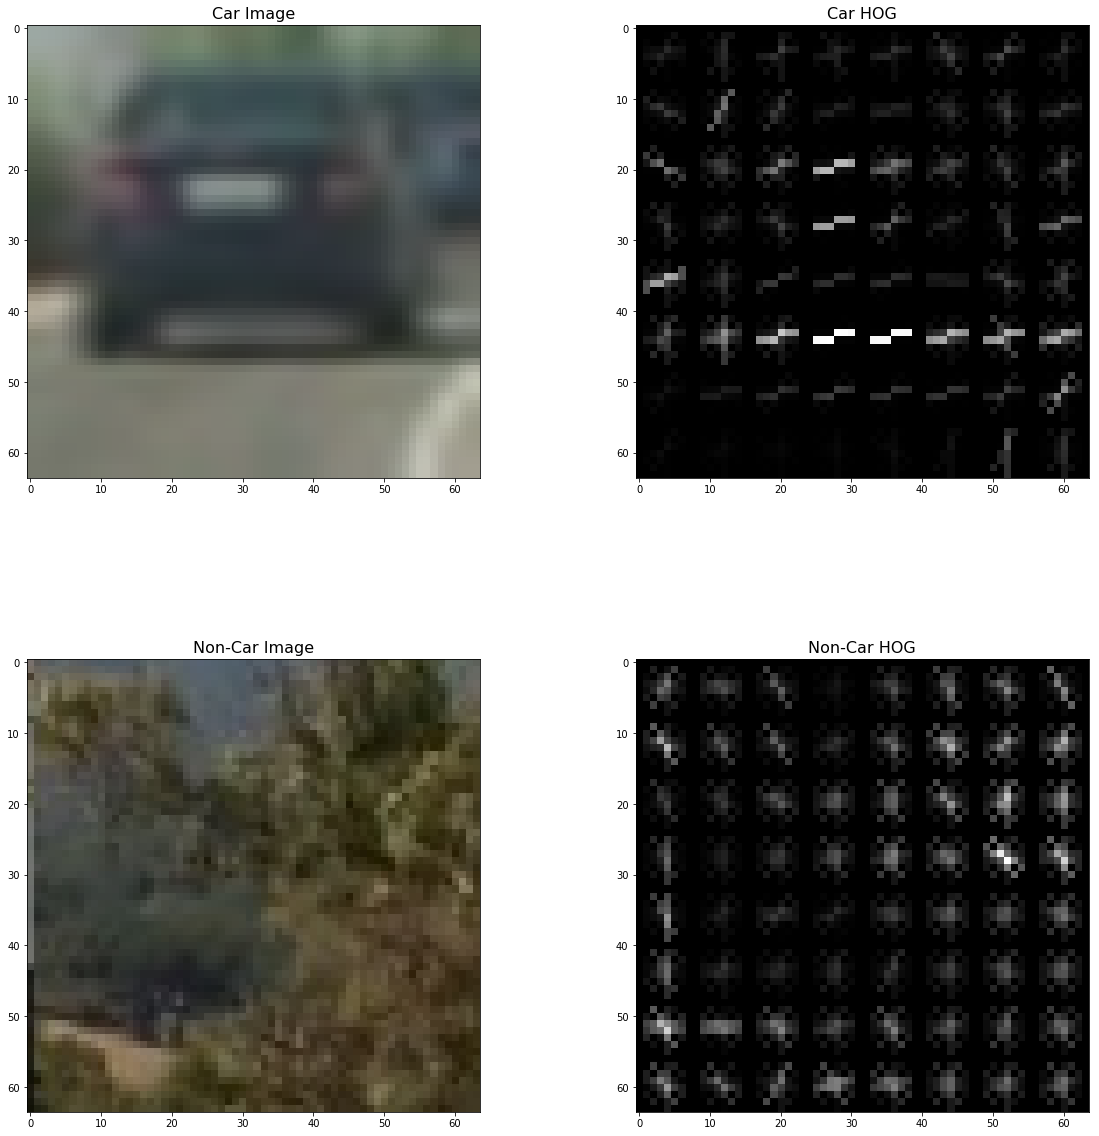
First, I visualize the HOG, as this:

I started by reading in all the vehicle and non-vehicle images. Here is an example of one of each of the vehicle and non-vehicle classes:
I then explored different color spaces and different parameters (orientations, pixels_per_cell, and cells_per_block). I grabbed random images from each of the two classes and displayed them to get a feel for what the output looks like. This is a part of my experiment with time.
| color_space | orient | pix_per_cell | cell_per_block | hog_channel | Accuracy |
|---|---|---|---|---|---|
| HLS | 12 | 12 | 3 | ALL | 0.98 |
| HLS | 12 | 16 | 2 | ALL | 0.99 |
| HLS | 12 | 16 | 3 | ALL | 0.99 |
| YCrCb | 9 | 8 | 2 | ALL | 1.00 |
| YCrCb | 9 | 8 | 3 | ALL | 0.98 |
| YCrCb | 9 | 16 | 2 | ALL | 1.00 |
####2. Explain how you settled on your final choice of HOG parameters.
I tried various combinations of parameters and calculated corresponding prediction accuracy, and choose one of the best results as the parameter.
####3. Describe how (and identify where in your code) you trained a classifier using your selected HOG features (and color features if you used them).
It's in my fifth cell of Vehicle_Detection.ipynb. I trained a linear SVM using a combination of color and hog features, with a X_scaler to transform my features to uniform scales, then I shuffled the data and split them into training and test parts. Finally, I use training data to fit the SVM classifier, and test data to test prediction accuracy.
###Sliding Window Search
####1. Describe how (and identify where in your code) you implemented a sliding window search. How did you decide what scales to search and how much to overlap windows?
It's in my 7th cell.
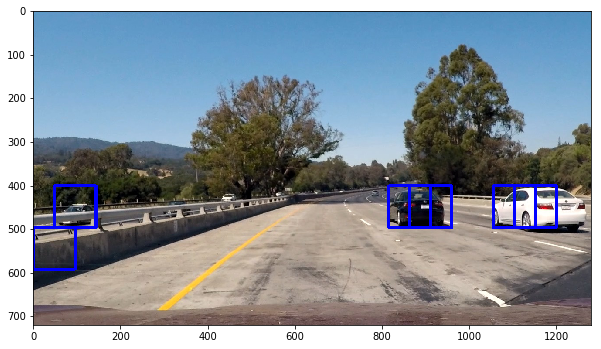
Initially, I search it use the 1.5 scale and ystart = 400, and ystop = 656 as setted in lesson. and get this result.

Then I changed the parameter, and based on my observation, the searching window can be small if the vehicle is far from the camera, and be very large when close to camera. So I take different parameters and find those can be perform well.
| ystart | ystop | scale |
|---|---|---|
| 400 | 464 | 1.0 |
| 416 | 480 | 1.0 |
| 400 | 496 | 1.5 |
| 432 | 528 | 1.5 |
| 400 | 528 | 2.0 |
| 432 | 560 | 2.0 |
| 400 | 592 | 3.0 |
| 464 | 660 | 3.0 |
Explanation: ystop - ystart = scale * window_size, and less scale should near the y=400 line.
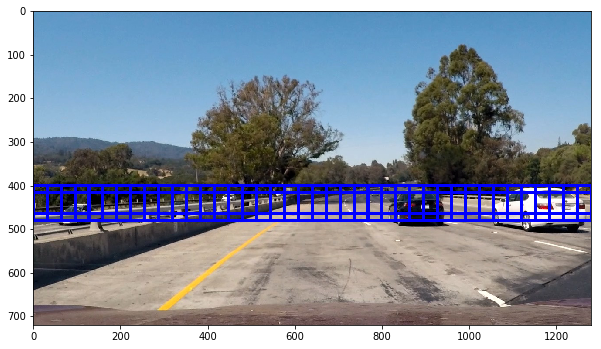
One example of scale = 1.0 is:

####2. Show some examples of test images to demonstrate how your pipeline is working. What did you do to optimize the performance of your classifier?
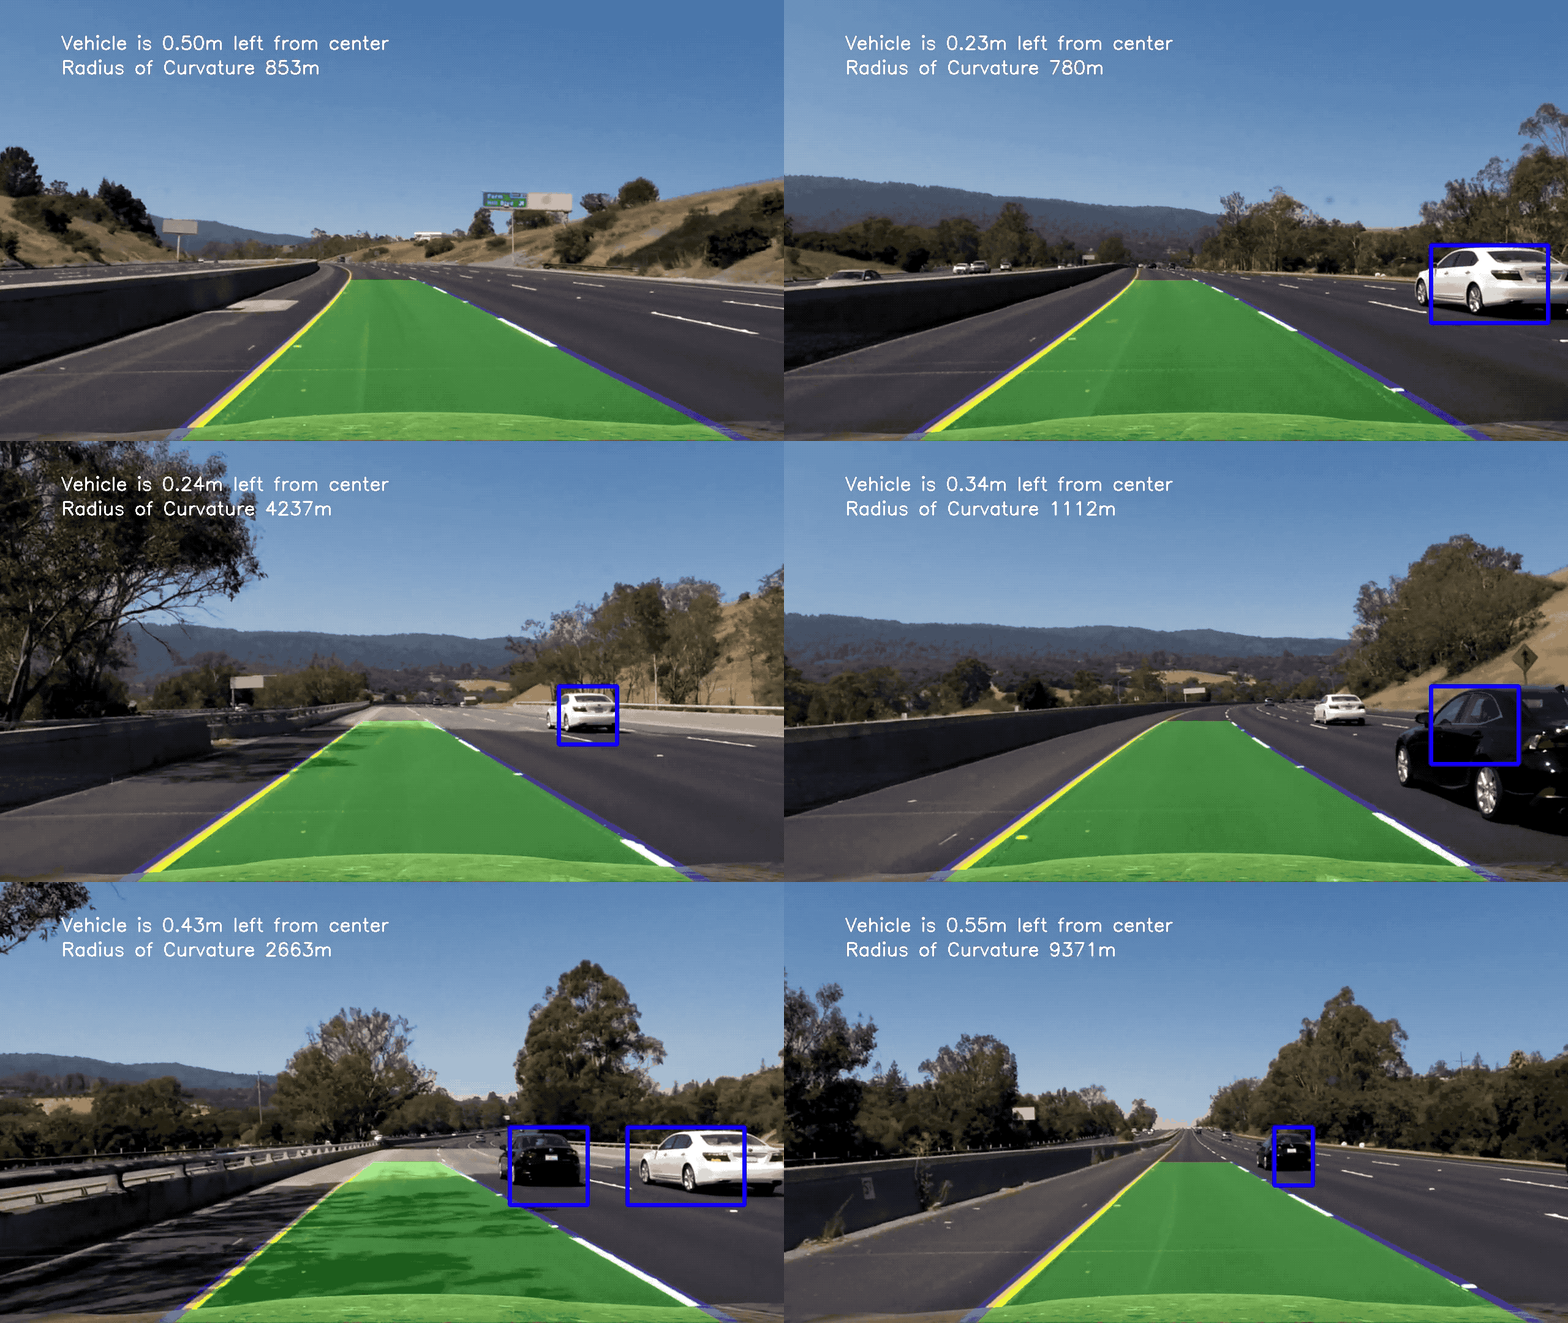
Ultimately I searched on two scales using YCrCb 3-channel HOG features plus spatially binned color and histograms of color in the feature vector, which provided a nice result. I first use combinations of different size of windows to get some rectangles, then I use heatmap to get the approximate area of vehicles and filter out some false positive windows. And finally, I use labels for my heatmap and draw rectangles on all those labels. Here are some example images:
Finally, I combined with Advanced lane lines project, and get a good result.
####1. Provide a link to your final video output. Your pipeline should perform reasonably well on the entire project video (somewhat wobbly or unstable bounding boxes are ok as long as you are identifying the vehicles most of the time with minimal false positives.) Here's a link to my video result
####2. Describe how (and identify where in your code) you implemented some kind of filter for false positives and some method for combining overlapping bounding boxes.
I recorded the positions of positive detections in each frame of the video. From the positive detections I created a heatmap and then thresholded that map to identify vehicle positions. I then used scipy.ndimage.measurements.label() to identify individual blobs in the heatmap. I then assumed each blob corresponded to a vehicle. I constructed bounding boxes to cover the area of each blob detected.
Here's an example result showing the heatmap from a series of frames of video, the result of scipy.ndimage.measurements.label() and the bounding boxes then overlaid on the last frame of video:
###Discussion
####1. Briefly discuss any problems / issues you faced in your implementation of this project. Where will your pipeline likely fail? What could you do to make it more robust?
In the video implementation, I find that the position of windows change frequently, so then I added a class to ercord last 15 frames, and calculate the box based on that. also my threshold for heatmap is always change based on how many frames I've recorded. And now, the windows become more stable, but still has some false positives. I think there is a way to remove some false positives but I've not figure it out entirely. My rudimentary idea is to calculate the overlap ratio of two windows. If there are two windows that the ratio is less than a threshold, they should be counted as two different object. And finally, one object should have a reasonable amount of windows to make it not false positive.


