Map to view COVID-19 cases on Mexico, developed with ReactJs.
📌Development Environment
Require Docker
docker network create --attachable covidnet
Creating Docker Image and running the container
docker build -t covid-api .
docker run --name covid-api --net=covidnet -it --rm -p 8000:8000 covid-api
Run over the Server Folder inside the Backend Project
Add the parameter source='Serendipia' to the CovidMX function on the file CovidView.py so the line looks like the following:
covid_dge_data = CovidMX(source='Serendipia').get_data()
Uncomment RUN echo "ALLOWED_HOSTS = ['*']" >> covid_api/settings.py
This project runs on http://localhost:8000
*For running local frontend with Hot Reloading Require NodeJs
npm install
npm run dev
Create a .env file at root level following the example file (.env-example).
PORT=9000
NODE_ENV=development
API_URL=http://localhost:8000
This project runs on http://localhost:9000 or the specified PORT on the .env file.
*For running local frontend from the container
docker build -t covid-frontend .
docker run --name covid-frontend --net=covidnet --rm -p 9000:9000 covid-frontend
*For running local proxy from the container
docker build -t covid-proxy .
docker run --name covid-proxy --net=covidnet --rm -p 5000:5000 covid-proxy
Run over the nginx Folder inside the Frontend Project
This project runs on http://localhost:5000 and shows the frontend over http://localhost:5000/app and the backend api over http://localhost:5000/api
📌Development as Production Environment
*Note: For running one of the following options you must create the docker images first (you can find the command to generate each image on the Development Environment section). The proxy image is not necessary.
Creating cluster, network and running the containers
docker-compose up
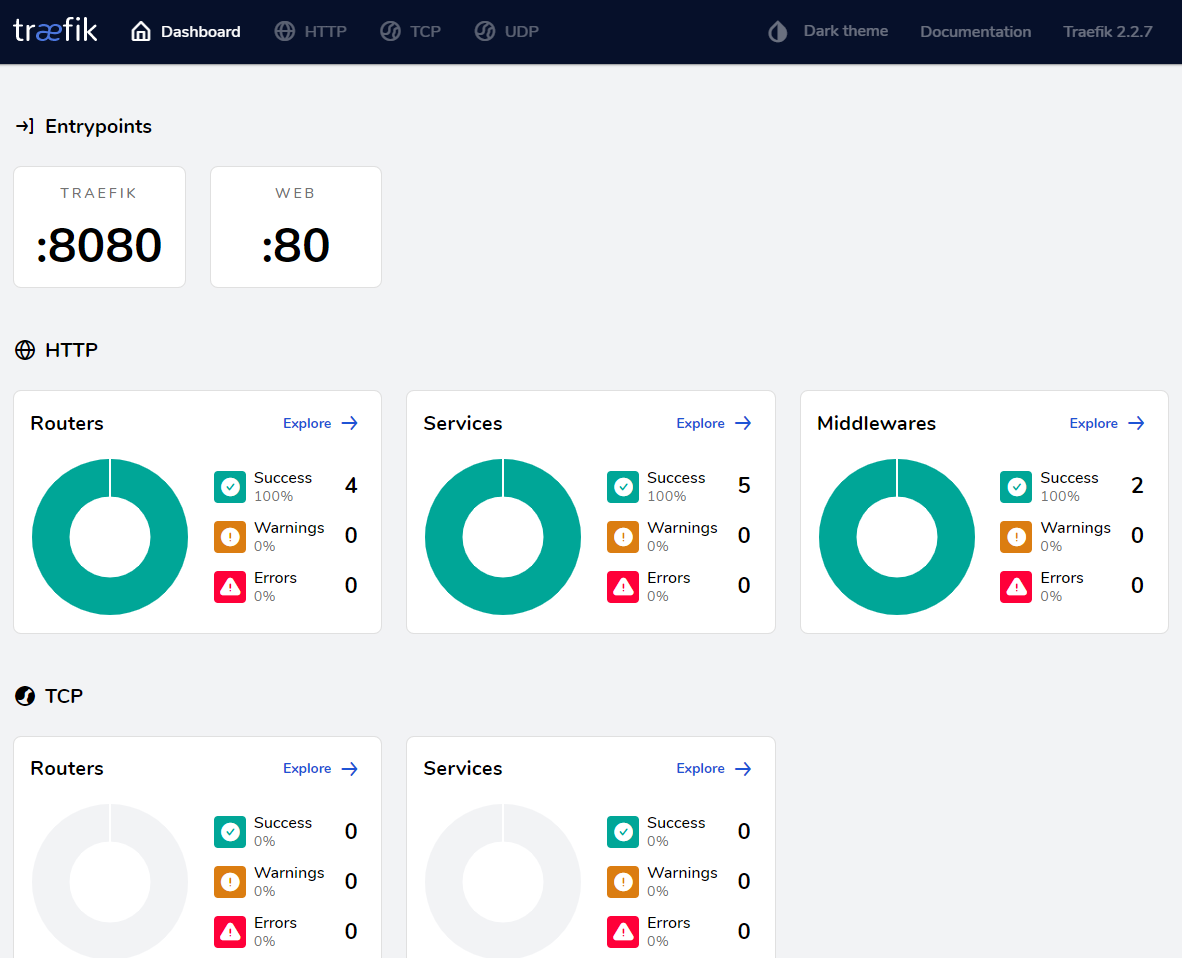
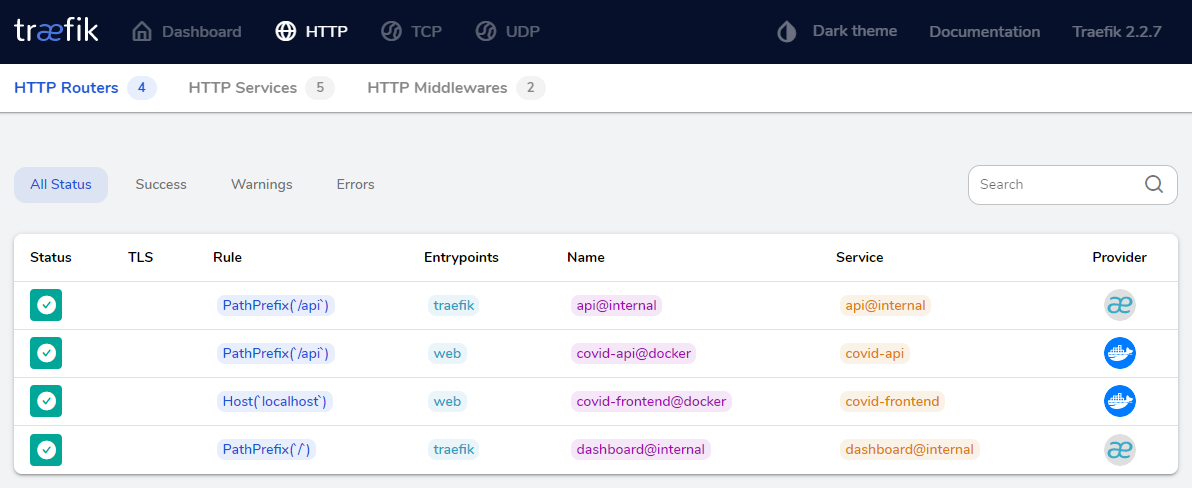
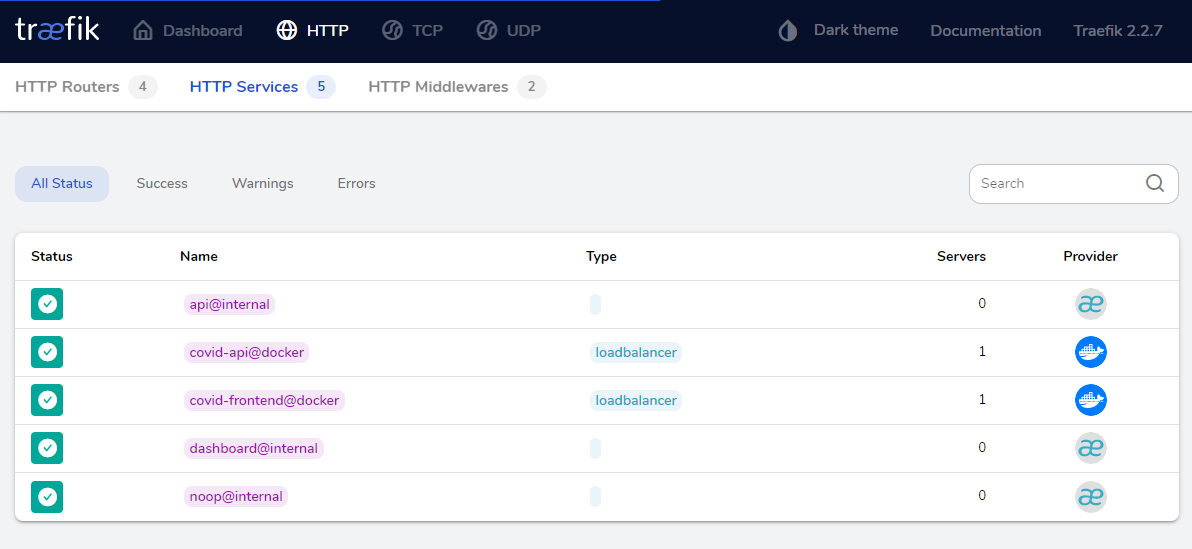
This project runs on http://localhost:8080/ to see the traefik dashboard and shows the frontend over http://localhost:5000/ and the backend api over http://localhost:5000/api
For stopping the services run:
docker-compose down
Creating cluster, network and running the containers
docker swarm init
docker network create --driver=overlay traefik-public
docker stack deploy -c docker-swarm.yml covid
This project runs on http://localhost:8080/ to see the traefik dashboard and shows the frontend over http://localhost:5000/ and the backend api over http://localhost:5000/api
For stopping the cluster run:
docker swarm leave --force
- React
- ESLint
- Webpack
- Traefik
- Docker
- Docker Swarm
- William Velazquez - WilliamVelazquez
If you want to know about the insights click here!
📷 Screenshots
This project is licensed under the terms of the MIT license.
Feel free to contribute to the project!


