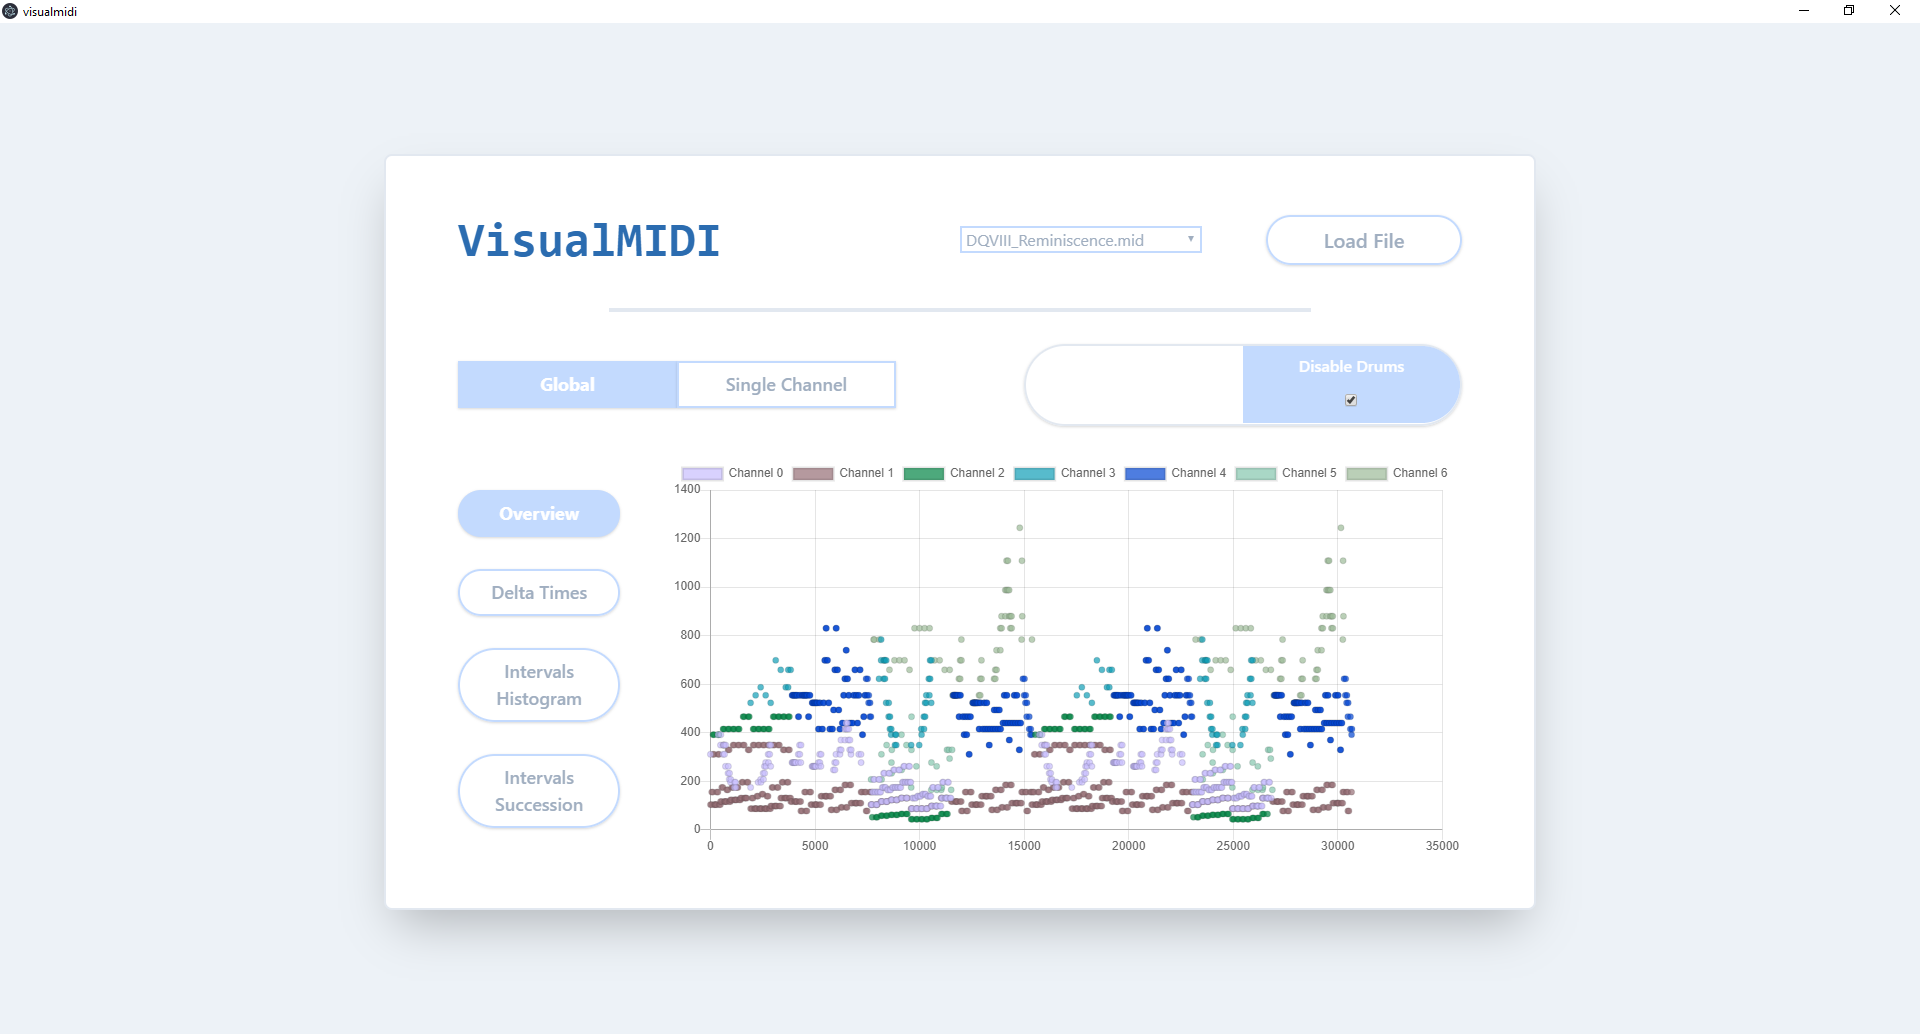
I am working on computer generated music and wanted to have a visualizer for midi files. This web app allows to easily import a midi and vizualize the following:
- Scatterplot of (Time, Frequency) of midi note_on events
- BarChart of ticks between note_on events
- BarChart of intervals between note_on events
Can also toggle to include Drums track or not
Notes: it's a WIP. Chords have been filtered out
Install python dependencies (pip for mido, git clone and pip -e for MidiStructurer) then
git clone https://github.com/Wally869/VisualMidi
cd VisualMidi
npm install

// start electron app
npm start

// Can also start in webonly mode
npm run startwebonly
Python:
- mido
- MusiStrata (my repo: https://github.com/Wally869/MusiStrata)
Javascript:
- Express
- Chart.js
- Electron
There is no set colors for the plots. Colors are chosen at random when needed by the ColorPool in jsfiles/frontside.js
If you want to specify your own color set, override the colors attribute of the ColorPool class
class ColorPool {
  constructor() {
    this.colors = [];
  }
  getColor(id) {
    while (id > this.colors.length - 1) {
      this.colors.push(randomColorString());
    }
    return this.colors[id];
  }
}- Color Palette instead of random pick
- Change plotting library, tooltip not working for heatmap, and custom recipe for heatmap has issues
- Maybe use brython instead of relying on user python install
