
o2-chart-lib is a chart library using d3.js (version 4) for Angular2 written by TypeScript2.
Demo Page, https://ohtsu.github.io/o2-chart/
Sample Program for setting config data, https://github.com/ohtsu/o2-chart/
- o2-chart-lib is a wrapper library of d3.js (version 4) for Angular2
- 12 main charts are supported
(Line,Bar,Pie,ScatterPlot,Histogram,Stack Bar, Geo Map, Geo Orthographic, Tree, Pack Layout, Choropleth,Force)
- Axis
You can include axis automatically by the configuration file.
- Legend
You can include legend automatically by the configuration file.
- Animation
You can animate such charts as Bar, Pie, Histogram, Stack Bar,Geo Orthographic and Pack Layout charts by the configuration file.
- node.js
- Typescript2
- Angular2
If you have not installed "Typings"(Type definition management tool for TypeScript) yet globally, install "Typings" at first as follows.
$ npm install -g typingsTo install this library, run:
$ npm install o2-chart-lib --saveVideo, https://youtu.be/LctP0mzZ8Tc
(caution: In this video, Angular-CLI Installation is explained as npm install -g angular-cli but install as follows)
$ npm install -g @angular/cli$ ng new sample-chart (Your project name)
$ cd sample-chart If you start local server as follows, you can get the first page in your browser by accessing http://localhost:4200.
$ ng serve- First Page
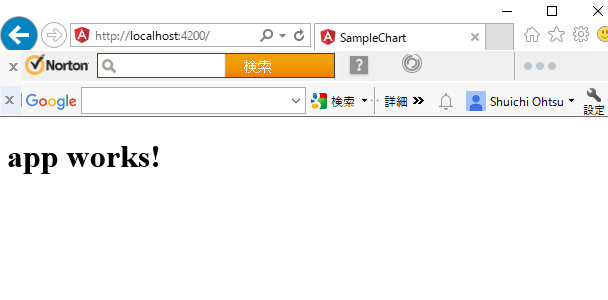
Input Ctrl+C and y+Return to stop the local server.
$ npm install o2-chart-lib --save$ cd src/appChange directory to "src/app", you will find app.module.ts. Modify this file as follows.
import { BrowserModule } from '@angular/platform-browser';
import { NgModule } from '@angular/core';
import { FormsModule } from '@angular/forms';
import { HttpModule } from '@angular/http';

import { AppComponent } from './app.component';
import { O2ChartComponent,ChartConst } from 'o2-chart-lib'; // <= Add


@NgModule({
  declarations: [
    O2ChartComponent,  // <= Add
    AppComponent
  ],
  imports: [
    BrowserModule,
    FormsModule,
    HttpModule
  ],
  providers: [],
  bootstrap: [AppComponent]
})
export class AppModule { }In the same directory, modify app.component.ts as follows. This example explains how to install Bar Chart. So graphData are only for Bar Chart. You can install other charts by changing chartType name and graphData(JsonData).
import { Component } from '@angular/core';
import { ChartConst } from 'O2-chart-lib'; // <= Add

@Component({
  selector: 'app-root',
  templateUrl: './app.component.html',
  styleUrls: ['./app.component.css']
})
export class AppComponent {
  title = 'app works!';

  // Add Start --------------------------------------------
	chartType:string;
	configData:any;
	barDataJson:any;
 	barTypeName:string;


	constructor() {
		this.barTypeName 			= ChartConst.BAR_CHART_TYPE_NAME;
		this.initilizeData();
	}

	private initilizeData(){
		this.configData ={
			"className":{
				"axis":"axis",
				"axisXBorder":"axis_x",
				"axisXText":"axis-x-text",
				"bar":"bar",
				"barValue":"bar-value",
				"line":"line",
				"multiLinePrefix":"line-",
				"grid":"grid",
				"pie":"pie",
				"pieInnerTitle": "pie-inner-title",
				"pieInnerRadius":"total",
				"histogram":"histogram",
				"histogramBar":"histogram-bar",
				"treemap":"treemap",
				"treemapLabel":"treemap-label",
				"packlayout":"packlayout",
				"packlayoutLabel":"packlayout-label",
			},
			"label": {
					"display":true,
			},
			"title": {
				"display": true,
				"name":"Title",
				"className":"chart-title",
				"height":30,
				"leftMargin":-20,
				"bottomMargin":10
			},
			"maxValue":{
				"auto":true,
				"x":100,
				"y":100,
			},
			"legend": {
				"display": true,
				"position": "right",
				"totalWidth":80,
				"initXPos":5,
				"initYPos":10,
				"rectWidth":10,
				"rectHeight":10,
				"xSpacing":2,
				"ySpacing":2
			},
			"color":{
				"auto":true, //
				"defaultColorNumber":10,
				"opacity":1.0,
				"userColors":[
					"blue",
					"red",
					"green",
					"yellow",
					"PaleGoldenrod",
					"Khaki",
					"DarkKhaki",
					"Gold",
					"Cornsilk",
					"BlanchedAlmond",
					"Bisque",
					"NavajoWhite",
					"Wheat",
					"BurlyWood",
					"Tan",
					"RosyBrown",
					"SandyBrown",
					"Goldenrod",
					"DarkGoldenrod",
					"Peru",
					"Chocolate"
				],
				"focusColor":"red",
			},
			"pie":{
				"innerRadius": {
					"percent":20,
					"title":"Total"
				},
				"value":{
					"display":true,
				},
				"percent":{
					"display":false,
				}
			},
			"line": {
				"legend":"lineEnd",
				"interpolate" :"linear",
			},
			"grid":{
				"x":{
					"display":true,
				},
				"y":{
					"display":true,
				},
			},
			"margin":{
				"top":30,
				"left":30,
				"right":10,
				"bottom":20,
				"between":5
			},
			"axis":{
				"rotation":0,
				"borderLineWidth":1,
				"xLabel":{
					"leftMargin":0,
					"bottomMargin":5
				},
				"yLabel":{
					"leftMargin":0,
					"bottomMargin":0
				},

			},
			"animation":{
				"enable":true,
				"duration":4000,
			},
		};

		this.barDataJson =
		{
			"series":[
				"English",
				"Math"
			],
			"data":[
				{
					"x": "suzuki",
					"y": [92,73],
				},
				{
					"x": "inoue",
					"y": [69,45],
				},
				{
					"x": "sato",
					"y": [70,100],
				},
				{
					"x": "tanaka",
					"y": [43,66],
				},
				{
					"x": "ida",
					"y": [60,70],
				},
				{
					"x": "kato",
					"y": [55,63],
				},
			],
		};
  }

  // Add End --------------------------------------------

}In the same directory, modify app.component.html as follows.
<h1>
  {{title}}
</h1>
<!-- Add Start -->
  <h2>Bar</h2>
  <o2-chart [chartType]="barTypeName" [configData]="configData"  [graphData]="barDataJson" [svgWidth]="'600'" [svgHeight]="'400'"></o2-chart>
<!-- Add End -->
Change to the parent directory, you will find index.html. Modify the file as follows.
$ cd ..<!doctype html>
<html>
<head>
<meta charset="utf-8">
<title>SampleChart</title>
<base href="/">
<meta name="viewport" content="width=device-width, initial-scale=1">
<link rel="icon" type="image/x-icon" href="favicon.ico">
<!-- Add Start -->
<style>
.line {fill:none; stroke:black;stroke-width: 1.5;}
.line-0 {fill:none; stroke:#1f77b4;stroke-width: 1.5;stroke-dasharray:4,10;}
.line-1 {fill:none; stroke:#ff7f0e;stroke-width: 1.5;stroke-dasharray:2,5.10;}
.line-2 {fill:none; stroke:#2ca02c;stroke-width: 1.5;}
.line-3 {fill:none; stroke:#d62728;stroke-width: 1.5;}
.line-4 {fill:none; stroke:#9467bd;stroke-width: 1.5;}
.line-5 {fill:none; stroke:#8c564b;stroke-width: 1.5;}
.line-6 {fill:none; stroke:#e377c2;stroke-width: 1.5;}
.line-7 {fill:none; stroke:#7f7f7f;stroke-width: 1.5;}
.line-8 {fill:none; stroke:#bcbd22;stroke-width: 1.5;}
.line-9 {fill:none; stroke:b#17becf;stroke-width: 1.5;}
.bar { fill:#aaa; stroke:white;stroke-width: 1;}
.bar-value { fill:black;font-size: 8pt;}
.name { font-size: 10pt;text-anchor: middle}
path {fill:white;stroke:black;stroke-width:0.5;}
.axis text {
font-family: sans-serif;
font-size: 11px;
}
.axis path,
.axis line {
fill: none;
stroke: black;
}
.axis_x line {
fill: none;
stroke: black;
}
.chart-title { fill:red;font-size: 18pt;text-anchor: middle;}
.histogram-bar{fill:blue; stroke:white;stroke-width: 1;}
.axis-x-text{ fill:blue;font-size: 12pt;}
.treemap { stroke:black;fill:#777}
.treemap-label { font-size: 10pt;text-anchor: middle}
.packlayout{ stroke:black;}
.packlayout-label{ font-size: 10pt;text-anchor: middle}
.pie-inner-title {font-size:9pt;text-anchor:middle;}
.pieNum {font-size:10pt;text-anchor:middle;}
.grid {stroke:gray;stroke-dasharray: 4,2;shape-rendering:crispEdges}
.tree-node circle {
fill: #fff;
stroke: steelblue;
stroke-width: 3px;
}
.tree-node text {
font: 12px sans-serif;
}
.tree-node-internal text {
text-shadow: 0 1px 0 #fff, 0 -1px 0 #fff, 1px 0 0 #fff, -1px 0 0 #fff;
}
.tree-node-link {
fill: none;
stroke: #ccc;
stroke-width: 2px;
}
.force-links line {
stroke: #999;
stroke-opacity: 0.6;
}
.force-nodes circle {
stroke: #fff;
stroke-width: 1.5px;
}
</style>
<!-- Add End -->
</head>
<body>
<app-root>Loading...</app-root>
</body>
</html>
Restart the local server as follows.
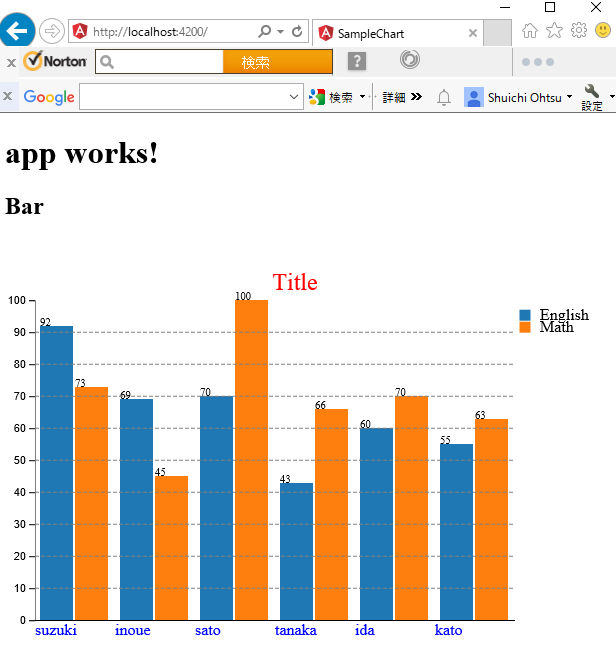
$ ng serveAnd you will get a simple Bar Chart in your browser by accessing http://localhost:4200.
- First Bar Chart
There are two types of data:configData,graphData.
- configData
This is a common setting data of all charts. In this file, you can set info as follows.
-Class name defined by "html" file
-Title Name
-Legend (display or not, position, size)
-Color (Auto color number: 10 or 20, Opacity)
-Line (interpolate)
-Grid (display or not, position, size)
-Animation (enable or not, duration)
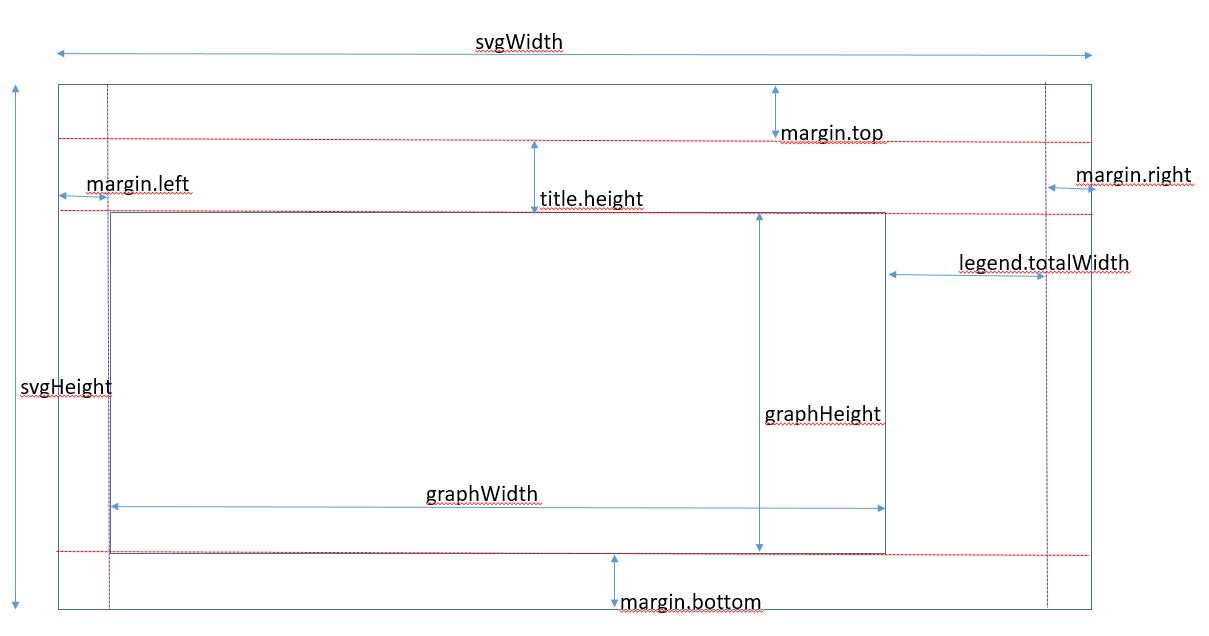
-Margin (top, left, right,bottom,between)
-Axis (left margin, bottom mergin)
- Sample configData
		configData ={
			"className":{
				"axis":"axis",
				"axisXBorder":"axis_x",
				"axisXText":"axis-x-text",
				"bar":"bar",
				"barValue":"bar-value",
				"line":"line",
				"multiLinePrefix":"line-",
				"grid":"grid",
				"pie":"pie",
				"pieInnerTitle": "pie-inner-title",
				"pieInnerRadius":"total",
				"histogram":"histogram",
				"histogramBar":"histogram-bar",
				"treemap":"treemap",
				"treemapLabel":"treemap-label",
				"packlayout":"packlayout",
				"packlayoutLabel":"packlayout-label",
			},
			"label": {
					"display":true,
			},
			"title": {
				"display": true,
				"name":"Title",
				"className":"chart-title",
				"height":30,
				"leftMargin":-20,
				"bottomMargin":10
			},
			"maxValue":{
				"auto":true,
				"x":100,
				"y":100,
			},
			"legend": {
				"display": true,
				"position": "right",
				"totalWidth":80,
				"initXPos":5,
				"initYPos":10,
				"rectWidth":10,
				"rectHeight":10,
				"xSpacing":2,
				"ySpacing":2
			},
			"color":{
				"auto":true, //
				"defaultColorNumber":10,
				"opacity":1.0,
				"userColors":[
					"blue",
					"red",
					"green",
					"yellow",
					"PaleGoldenrod",
					"Khaki",
					"DarkKhaki",
					"Gold",
					"Cornsilk",
					"BlanchedAlmond",
					"Bisque",
					"NavajoWhite",
					"Wheat",
					"BurlyWood",
					"Tan",
					"RosyBrown",
					"SandyBrown",
					"Goldenrod",
					"DarkGoldenrod",
					"Peru",
					"Chocolate"
				],
				"focusColor":"red",
			},
			"pie":{
				"innerRadius": {
					"percent":20,
					"title":"Total"
				},
				"value":{
					"display":true,
				},
				"percent":{
					"display":false,
				}
			},
			"line": {
				"legend":"lineEnd",
				"interpolate" :"linear",
			},
			"grid":{
				"x":{
					"display":true,
				},
				"y":{
					"display":true,
				},
			},
			"margin":{
				"top":30,
				"left":30,
				"right":10,
				"bottom":20,
				"between":5
			},
			"axis":{
				"rotation":0,
				"borderLineWidth":1,
				"xLabel":{
					"leftMargin":0,
					"bottomMargin":5
				},
				"yLabel":{
					"leftMargin":0,
					"bottomMargin":0
				},

			},
			"animation":{
				"enable":true,
				"duration":4000,
			},
};- graphData
Each chart needs its own data in Json format.
- Sample GraphData for Line
		lineDataJson =
		{
			"series":[
				"year",
				"sell",
			],
			"data":[
				{
					"name": "software",
					"value":[
						{
							"x":"2010",
							"y":18
						},
						{
							"x":"2011",
							"y":22
						},
						{
							"x":"2012",
							"y":30
						},
						{
							"x":"2013",
							"y":31
						},
					]
				},
				{
					"name": "hardware",
					"value":[
						{
							"x":"2010",
							"y":15
						},
						{
							"x":"2011",
							"y":16
						},
						{
							"x":"2012",
							"y":10
						},
						{
							"x":"2013",
							"y":21
						},
					]
				},
				{
					"name": "device",
					"value":[
						{
							"x":"2010",
							"y":25
						},
						{
							"x":"2011",
							"y":26
						},
						{
							"x":"2012",
							"y":30
						},
						{
							"x":"2013",
							"y":31
						},
					]
				},
				{
					"name": "others",
					"value":[
						{
							"x":"2010",
							"y":100
						},
						{
							"x":"2011",
							"y":16
						},
						{
							"x":"2012",
							"y":20
						},
						{
							"x":"2013",
							"y":41
						},
					]
				},
			],
		};
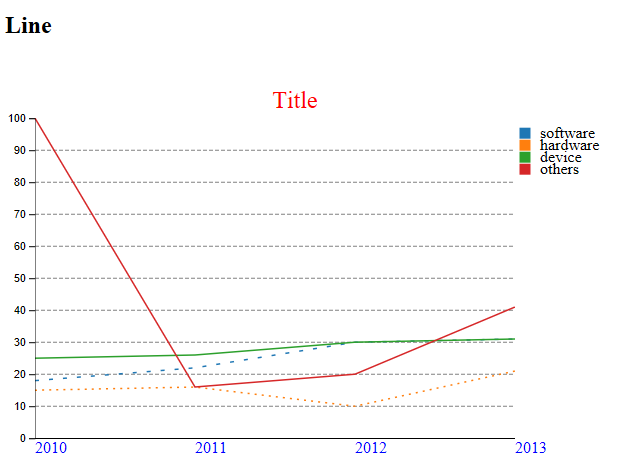
- Visual for Line
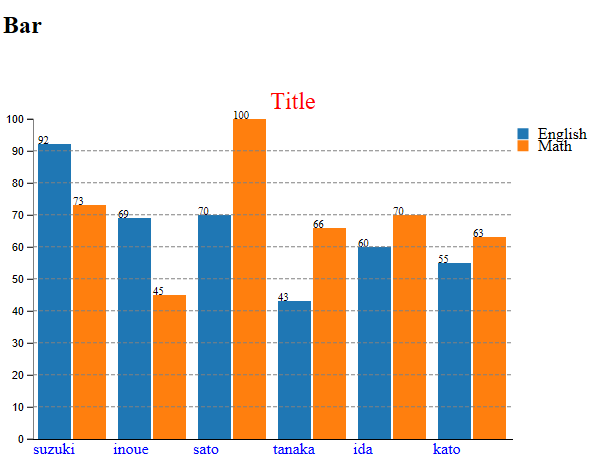
- Sample GraphData for Bar
		barDataJson =
		{
			"series":[
				"English",
				"Math"
			],
			"data":[
				{
					"x": "suzuki",
					"y": [92,73],
				},
				{
					"x": "inoue",
					"y": [69,45],
				},
				{
					"x": "sato",
					"y": [70,100],
				},
				{
					"x": "tanaka",
					"y": [43,66],
				},
				{
					"x": "ida",
					"y": [60,70],
				},
				{
					"x": "kato",
					"y": [55,63],
				},
			],
		};
- Visual for Bar
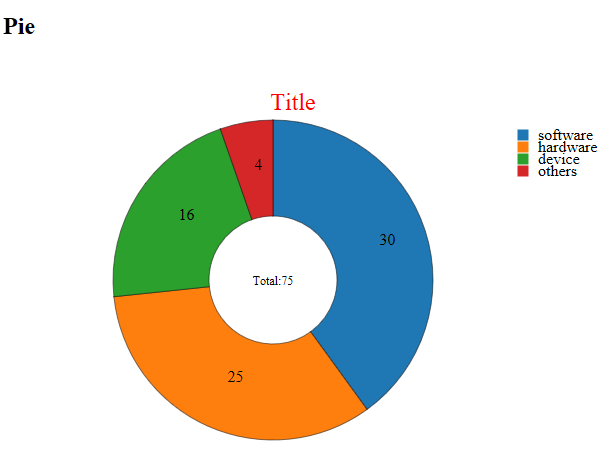
- Sample GraphData for Pie
		pieDataJson =
		{
			"data":[
				{
					"name": "software",
					"value":30,
				},
				{
					"name": "hardware",
					"value":25
				},
				{
					"name": "device",
					"value":16
				},
				{
					"name": "others",
					"value":4
				},
			],
		};
- Visual for Pie
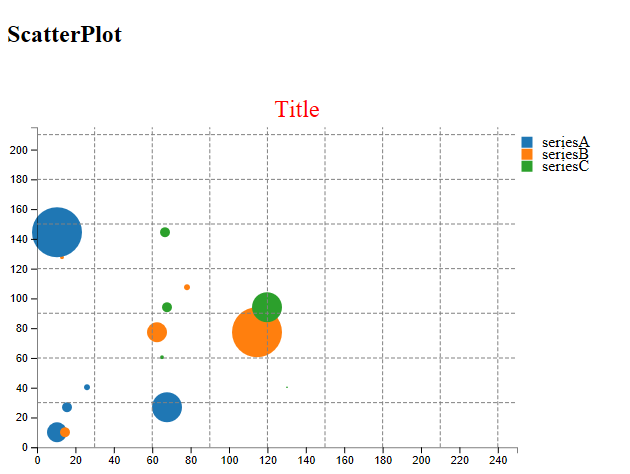
- Sample GraphData for ScatterPlot
		scatterPlotDataJson =
		{
			"series":[
				"seriesA",
				"seriesB",
				"seriesC"
			],
			"data":[
				{
					"name": "suzuki",
					"value":[
						{"x":30,"y":40,"r":5},
						{"x":120,"y":115,"r":10},
						{"x":125,"y":90,"r":2},
						{"x":150,"y":160,"r":1},
						{"x":150,"y":160,"r":3},
						{"x":128,"y":215,"r":5},
						{"x":130,"y":40,"r":15},
						{"x":220,"y":115,"r":25},
					]
				},
				{
					"name": "inoue",
					"value":[
						{"x":130,"y":140,"r":5},
						{"x":20,"y":15,"r":10},
						{"x":25,"y":190,"r":2},
						{"x":250,"y":60,"r":1},
						{"x":50,"y":60,"r":3},
						{"x":28,"y":15,"r":5},
						{"x":230,"y":140,"r":15},
						{"x":20,"y":215,"r":25},
					]
				},
			],
		};
- Visual for ScatterPlot
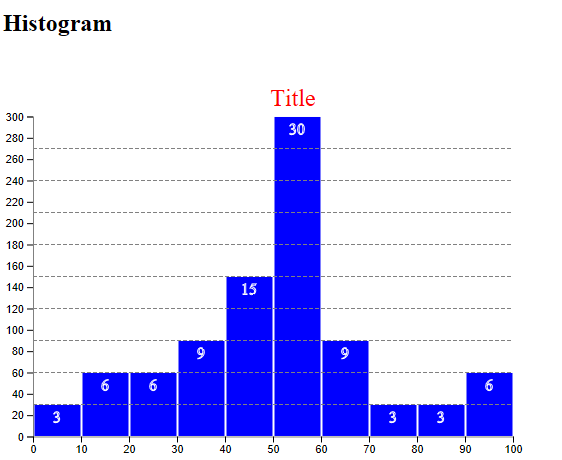
- Sample GraphData for Histogram
		histogramDataJson =
		{
			"range":[0,100],
			"bins": [0,10,20,30,40,50,60,70,80,90,100],
			"data":[
				50,95,60,44,60,50,35,20,10,8,
				56,70,65,42,22,33,40,53,52,89,
				90,55,50,55,65,72,45,35,15,45,
				50,95,60,44,60,50,35,20,10,8,
				56,70,65,42,22,33,40,53,52,89,
				90,55,50,55,65,72,45,35,15,45,
				50,95,60,44,60,50,35,20,10,8,
				56,70,65,42,22,33,40,53,52,89,
				90,55,50,55,65,72,45,35,15,45,
			],
		};
- Visual for Histogram
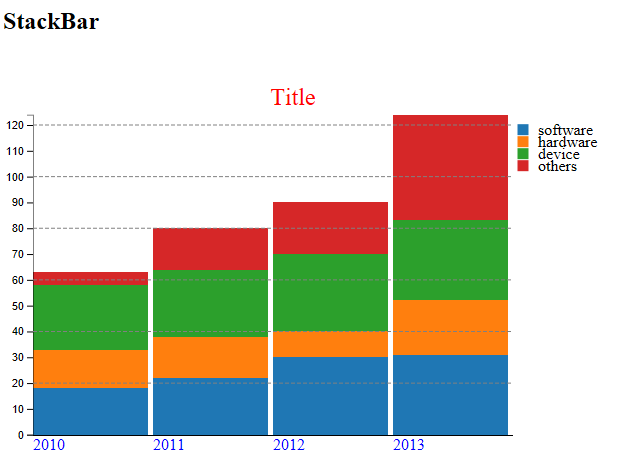
- Sample GraphData for StackBar
		stackBarDataJson =
		{
			"config":{
				"timeFormat":"%Y",
			},
			"series":[
				"year",
				"sell",
			],
			"data":[
				{
					"name": "software",
					"value":[
						{
							"x":"2010",
							"y":18
						},
						{
							"x":"2011",
							"y":22
						},
						{
							"x":"2012",
							"y":30
						},
						{
							"x":"2013",
							"y":31
						},
					]
				},
				{
					"name": "hardware",
					"value":[
						{
							"x":"2010",
							"y":15
						},
						{
							"x":"2011",
							"y":16
						},
						{
							"x":"2012",
							"y":10
						},
						{
							"x":"2013",
							"y":21
						},
					]
				},
				{
					"name": "device",
					"value":[
						{
							"x":"2010",
							"y":25
						},
						{
							"x":"2011",
							"y":26
						},
						{
							"x":"2012",
							"y":30
						},
						{
							"x":"2013",
							"y":31
						},
					]
				},
				{
					"name": "others",
					"value":[
						{
							"x":"2010",
							"y":5
						},
						{
							"x":"2011",
							"y":16
						},
						{
							"x":"2012",
							"y":20
						},
						{
							"x":"2013",
							"y":41
						},
					]
				},
			],
		};
- Visual for StackBar
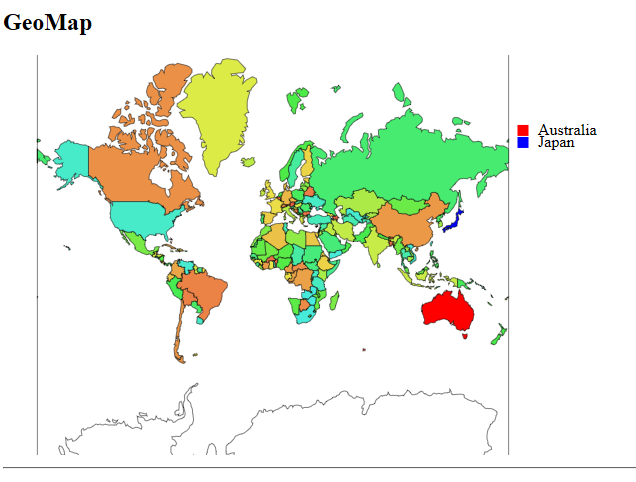
- Sample GraphData for GeoMap
		geoMapDataJson =
		{
			"map":{
					"baseGeoDataUrl":"https://raw.githubusercontent.com/Ohtsu/data/master/o2-chart/world.geojson",
					"scale":75,
					"keyDataName":"features",
					"targetPropertyName":"properties.name",
			},
			"data":[
				{
					"name":"Australia",
					"color":"red"
				},
				{
					"name":"Antarctica",
					"color":"white"
				},
				{
					"name":"Japan",
					"color":"blue"
				},
			],
		};
- Visual for GeoMap
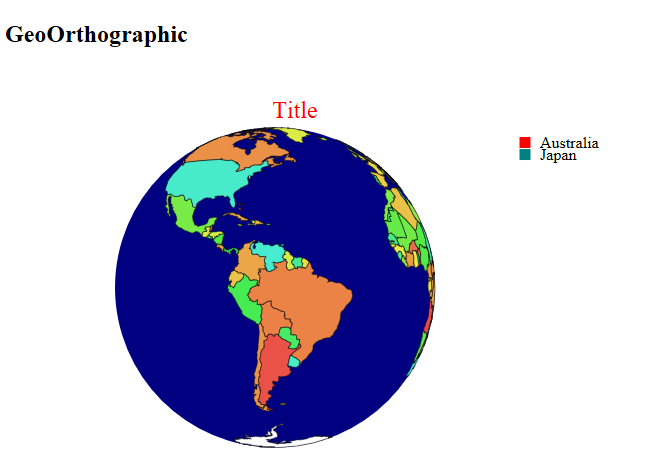
- Sample GraphData for GeoOrthographic
		geoOrthographicDataJson =
		{
			"map":{
					"baseGeoDataUrl":"https://raw.githubusercontent.com/Ohtsu/data/master/o2-chart/world.geojson",
					"keyDataName":"features",
					"targetPropertyName":"properties.name",
					"scale":160,
					"colorNumber":10,
					"rotate":{
						"horizontal":210,
						"vertical":5
					},
					"clipAngle":90,
					"oceanColor":"navy",
					"antarcticaColor":"white",
			},
			"data":[
				{
					"name":"Australia",
					"color":"red"
				},
				{
					"name":"Antarctica",
					"color":"white"
				},
				{
					"name":"Japan",
					"color":"teal"
				},
			]
		}
- Visual for GeoOrthographic
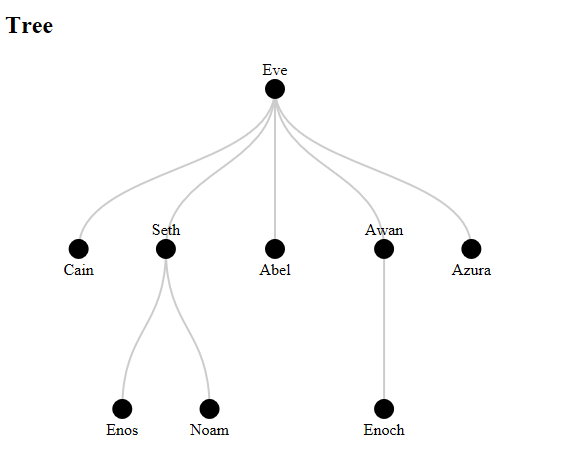
- Sample GraphData for Tree
        treeDataJson =
        {
            "name": "Eve",
            "children": [
                { "name": "Cain"
                },
                {
                    "name": "Seth",
                    "children": [
                        { "name": "Enos" },
                        { "name": "Noam" }
                    ]
                },
                { "name": "Abel"
                },
                {
                    "name": "Awan",
                    "children": [
                        { "name": "Enoch" }
                    ]
                },
                { "name": "Azura"
                },
            ]
        };
- Visual for Tree
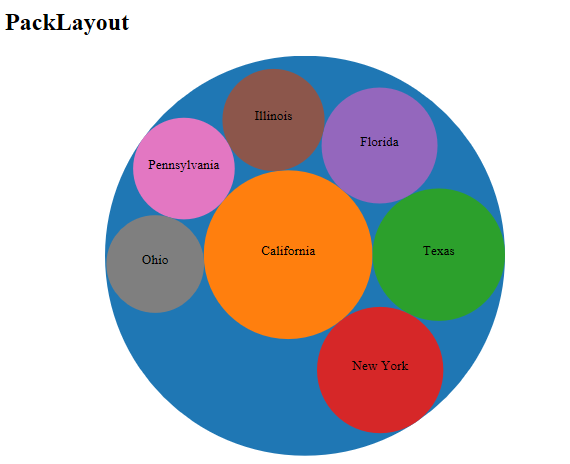
- Sample GraphData for PackLayout
		packLayoutDataJson = {
			"name":"United States", "value" :281421906,
			"children" : [
				{"name":"California", "value" :33871648},
				{"name":"Texas", "value" :20851820},
				{"name":"New York", "value" :18976457},
				{"name":"Florida", "value" :15982378},
				{"name":"Illinois", "value" :12419293},
				{"name":"Pennsylvania", "value" :12281054},
				{"name":"Ohio", "value" :11353140},
				]
		}
- Visual for PackLayout
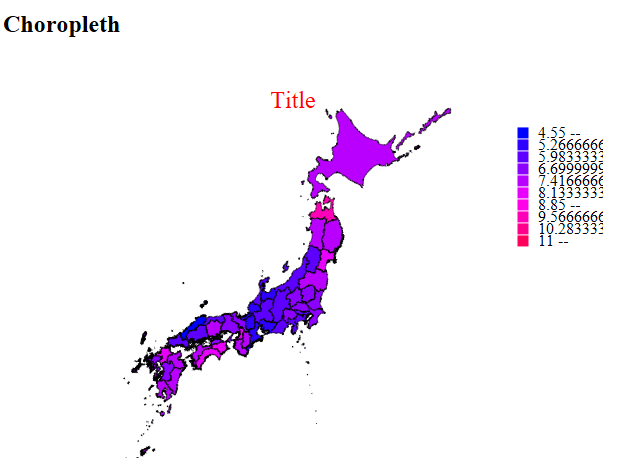
- Sample GraphData for Choropleth
		choroplethDataJson = {
			"map":{
				"baseGeoDataUrl":"https://raw.githubusercontent.com/Ohtsu/data/master/o2-chart/japan.geojson",
				"scale":900,
				"center":[137.571,37.500],
				"startColor":"blue",
				"endColor":"red",
				"colorNumber":10,
				"keyDataName":"features",
				"targetPropertyName":"properties.id"
			},

			"data":
			[
				{
					"id":1,
					"value":7.12
				},
				{
					"id":2,
					"value":8.97
				},
				{
					"id":3,
					"value":7.07
				},
				{
					"id":4,
					"value":7.78
				},
				{
					"id":5,
					"value":6.97
				},
				{
					"id":6,
					"value":5.79
				},
				{
					"id":7,
					"value":7.14
				},
				{
					"id":8,
					"value":6.68
				},
				{
					"id":9,
					"value":6.28
				},
				{
					"id":10,
					"value":6.32
				},
				{
					"id":11,
					"value":6.29
				},
				{
					"id":12,
					"value":6.14
				},
				{
					"id":13,
					"value":5.87
				},
				{
					"id":14,
					"value":5.75
				},
				{
					"id":15,
					"value":5.50
				},
				{
					"id":16,
					"value":5.21
				},
				{
					"id":17,
					"value":5.37
				},
				{
					"id":18,
					"value":5.23
				},
				{
					"id":19,
					"value":6.18
				},
				{
					"id":20,
					"value":5.44
				},
				{
					"id":21,
					"value":5.57
				},
				{
					"id":22,
					"value":5.81
				},
				{
					"id":23,
					"value":5.09
				},
				{
					"id":24,
					"value":5.08
				},
				{
					"id":25,
					"value":5.07
				},
				{
					"id":26,
					"value":6.21
				},
				{
					"id":27,
					"value":7.97
				},
				{
					"id":28,
					"value":6.54
				},
				{
					"id":29,
					"value":7.41
				},
				{
					"id":30,
					"value":6.74
				},
				{
					"id":31,
					"value":5.90
				},
				{
					"id":32,
					"value":4.55
				},
				{
					"id":33,
					"value":7.24
				},
				{
					"id":34,
					"value":5.35
				},
				{
					"id":35,
					"value":5.93
				},
				{
					"id":36,
					"value":7.62
				},
				{
					"id":37,
					"value":6.25
				},
				{
					"id":38,
					"value":7.26
				},
				{
					"id":39,
					"value":7.70
				},
				{
					"id":40,
					"value":7.84
				},
				{
					"id":41,
					"value":6.32
				},
				{
					"id":42,
					"value":6.64
				},
				{
					"id":43,
					"value":6.67
				},
				{
					"id":44,
					"value":7.07
				},
				{
					"id":45,
					"value":7.01
				},
				{
					"id":46,
					"value":6.84
				},
				{
					"id":47,
					"value":11.0
				}
			]
		};
- Visual for Choropleth
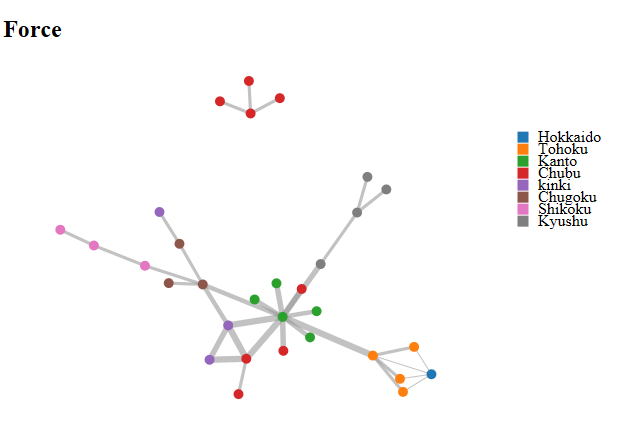
- Sample GraphData for Force
    forceDataJson =
		{
			"groups": [
				{"id": 1, "name": "Hokkaido"},
				{"id": 2, "name": "Tohoku"},
				{"id": 3, "name": "Kanto"},
				{"id": 4, "name": "Chubu"},
				{"id": 5, "name": "kinki"},
				{"id": 6, "name": "Chugoku"},
				{"id": 7, "name": "Shikoku"},
				{"id": 8, "name": "Kyushu"},
			],
			"nodes": [
				{"id": "Sapporo", "group": 1},
				{"id": "Sendai", "group": 2},
				{"id": "Morioka", "group": 2},
				{"id": "Akita", "group": 2},
				{"id": "Fukushima", "group": 2},
				{"id": "Mito", "group": 3},
				{"id": "Utsunomiya", "group": 3},
				{"id": "Saitama", "group": 3},
				{"id": "Chiba", "group": 3},
				{"id": "Tokyo", "group": 3},
				{"id": "Kofu", "group": 4},
				{"id": "Nagano", "group": 4},
				{"id": "Niigata", "group": 4},
				{"id": "Toyama", "group": 4},
				{"id": "Kanazawa", "group": 4},
				{"id": "Fukui", "group": 4},
				{"id": "Shizuoka", "group": 4},
				{"id": "Nagoya", "group": 4},
				{"id": "Gifu", "group": 4},
				{"id": "Otsu", "group": 5},
				{"id": "Kyoto", "group": 5},
				{"id": "Osaka", "group": 5},
				{"id": "Kobe", "group": 5},
				{"id": "Nara", "group": 5},
				{"id": "Kyoto", "group": 5},
				{"id": "Tottori", "group": 6},
				{"id": "Hiroshima", "group": 6},
				{"id": "Matsue", "group": 6},
				{"id": "Matsuyama", "group": 7},
				{"id": "Tokushima", "group": 7},
				{"id": "Kochi", "group": 7},
				{"id": "Fukuoka", "group": 8},
				{"id": "Nagasaki", "group": 8},
				{"id": "Kumamoto", "group": 8},
				{"id": "Naha", "group": 8},
			],
			"links": [
            {"source": "Sendai", "target": "Sapporo", "value": 1},
            {"source": "Morioka", "target": "Sapporo", "value": 1},
            {"source": "Akita", "target": "Sapporo", "value": 1},
            {"source": "Fukushima", "target": "Sapporo", "value": 1},
            {"source": "Morioka", "target": "Sendai", "value": 10},
            {"source": "Akita", "target": "Sendai", "value": 10},
            {"source": "Fukushima", "target": "Sendai", "value": 10},
            {"source": "Chiba", "target": "Tokyo", "value": 20},
            {"source": "Utsunomiya", "target": "Tokyo", "value": 20},
            {"source": "Mito", "target": "Tokyo", "value": 20},
            {"source": "Saitama", "target": "Tokyo", "value": 30},
            {"source": "Kofu", "target": "Tokyo", "value": 30},
            {"source": "Nagano", "target": "Tokyo", "value": 30},
            {"source": "Naha", "target": "Tokyo", "value": 30},
            {"source": "Osaka", "target": "Tokyo", "value": 40},
            {"source": "Sendai", "target": "Tokyo", "value": 40},
            {"source": "Hiroshima", "target": "Tokyo", "value": 20},
            {"source": "Shizuoka", "target": "Nagoya", "value": 10},
            {"source": "Tokyo", "target": "Nagoya", "value": 40},
            {"source": "Osaka", "target": "Nagoya", "value": 40},
            {"source": "Kyoto", "target": "Nagoya", "value": 40},
            {"source": "Kyoto", "target": "Osaka", "value": 30},
            {"source": "Hiroshima", "target": "Osaka", "value": 20},
            {"source": "Toyama", "target": "Kanazawa", "value": 10},
            {"source": "Fukui", "target": "Kanazawa", "value": 10},
            {"source": "Niigata", "target": "Kanazawa", "value": 10},
            {"source": "Tottori", "target": "Kobe", "value": 10},
            {"source": "Tottori", "target": "Hiroshima", "value": 10},
            {"source": "Matsue", "target": "Hiroshima", "value": 10},
            {"source": "Matsuyama", "target": "Hiroshima", "value": 10},
            {"source": "Tokushima", "target": "Kochi", "value": 10},
            {"source": "Matsuyama", "target": "Kochi", "value": 10},
            {"source": "Nagasaki", "target": "Fukuoka", "value": 10},
            {"source": "Kumamoto", "target": "Fukuoka", "value": 10},
            {"source": "Naha", "target": "Fukuoka", "value": 10},
               ]
        };
- Visual for Force
- Sample Style Sheet for index.html
	<style>
		.line {fill:none; stroke:black;stroke-width: 1.5;}
		.line-0 {fill:none; stroke:#1f77b4;stroke-width: 1.5;stroke-dasharray:4,10;}
		.line-1 {fill:none; stroke:#ff7f0e;stroke-width: 1.5;stroke-dasharray:2,5.10;}
		.line-2 {fill:none; stroke:#2ca02c;stroke-width: 1.5;}
		.line-3 {fill:none; stroke:#d62728;stroke-width: 1.5;}
		.line-4 {fill:none; stroke:#9467bd;stroke-width: 1.5;}
		.line-5 {fill:none; stroke:#8c564b;stroke-width: 1.5;}
		.line-6 {fill:none; stroke:#e377c2;stroke-width: 1.5;}
		.line-7 {fill:none; stroke:#7f7f7f;stroke-width: 1.5;}
		.line-8 {fill:none; stroke:#bcbd22;stroke-width: 1.5;}
		.line-9 {fill:none; stroke:b#17becf;stroke-width: 1.5;}

		.bar { fill:#aaa; stroke:white;stroke-width: 1;}
		.bar-value { fill:black;font-size: 8pt;}
		.name { font-size: 10pt;text-anchor: middle}
		path {fill:white;stroke:black;stroke-width:0.5;}
		.axis text {
			font-family: sans-serif;
			font-size: 11px;
		}
		.axis path,
		.axis line {
			fill: none;
			stroke: black;
		}
		.axis_x line {
			fill: none;
			stroke: black;
		}
		.chart-title { fill:red;font-size: 18pt;text-anchor: middle;}
		.histogram-bar{fill:blue; stroke:white;stroke-width: 1;}
		.axis-x-text{ fill:blue;font-size: 12pt;}
		.treemap { stroke:black;fill:#777}
		.treemap-label { font-size: 10pt;text-anchor: middle}
		.packlayout{ stroke:black;}
		.packlayout-label{ font-size: 10pt;text-anchor: middle}
		.pie-inner-title {font-size:9pt;text-anchor:middle;}
		.pieNum {font-size:10pt;text-anchor:middle;}
		.grid {stroke:gray;stroke-dasharray: 4,2;shape-rendering:crispEdges}

		.tree-node circle {
			fill: #fff;
			stroke: steelblue;
			stroke-width: 3px;
		}
		.tree-node text {
			font: 12px sans-serif;
		}
		.tree-node-internal text {
			text-shadow: 0 1px 0 #fff, 0 -1px 0 #fff, 1px 0 0 #fff, -1px 0 0 #fff;
		}
		.tree-node-link {
			fill: none;
			stroke: #ccc;
			stroke-width: 2px;
		}
		.force-links line {
		stroke: #999;
		stroke-opacity: 0.6;
		}

		.force-nodes circle {
		stroke: #fff;
		stroke-width: 1.5px;
		}


</style>- o2-chart-lib : 0.1
- Angular2 : 2.0.0
- TypeScript : 2.0.2
- d3.js : 4.4.0
-
"データビジュアライゼーションのためのD3.js徹底入門 Webで魅せるグラフ&チャートの作り方",2014/6/6,by 古籏 一浩, http://www.amazon.co.jp/s/ref=nb_sb_noss?__mk_ja_JP=%E3%82%AB%E3%82%BF%E3%82%AB%E3%83%8A&url=search-alias%3Daps&field-keywords=ISBN978-4-7973-6886-4&rh=i%3Aaps%2Ck%3AISBN978-4-7973-6886-4
-
"D3.js by Example",2015/12/29,by Michael Heydt http://www.amazon.co.jp/s/ref=nb_sb_noss?__mk_ja_JP=%E3%82%AB%E3%82%BF%E3%82%AB%E3%83%8A&url=search-alias%3Daps&field-keywords=ISBN978-1-78528-008-5&rh=i%3Aaps%2Ck%3AISBN978-1-78528-008-5
-
"Mastering D3.js",2014/8/25,by Pablo Navarro, http://www.amazon.co.jp/s/ref=nb_sb_noss?__mk_ja_JP=%E3%82%AB%E3%82%BF%E3%82%AB%E3%83%8A&url=search-alias%3Daps&field-keywords=ISBN978-1-78328-627-0&rh=i%3Aaps%2Ck%3AISBN978-1-78328-627-0
-
"Data Visualization With D3 and Angularjs",2015/4/27,by Christoph Korner, http://www.amazon.co.jp/s/ref=nb_sb_noss?__mk_ja_JP=%E3%82%AB%E3%82%BF%E3%82%AB%E3%83%8A&url=search-alias%3Daps&field-keywords=ISBN978-1-78439-848-4&rh=i%3Aaps%2Ck%3AISBN978-1-78439-848-4
-
"Mastering TypeScript",2015/4/23,by Nathan Rozentals, http://www.amazon.co.jp/s/ref=nb_sb_noss?__mk_ja_JP=%E3%82%AB%E3%82%BF%E3%82%AB%E3%83%8A&url=search-alias%3Daps&field-keywords=ISBN978-1-78439-966-5&rh=i%3Aaps%2Ck%3AISBN978-1-78439-966-5
-
"D3 Tips and Tricks v4.x",by Malcolm Maclean,Leanpub, https://leanpub.com/d3-t-and-t-v4/read
-
"Angular5 Custom Library: The definitive, step-by-step guide", https://www.udemy.com/draft/1461368/learn/v4/content
- 2016.12.5 version 0.1 uploaded
copyright 2016 by Shuichi Ohtsu (DigiPub Japan)
MIT © Shuichi Ohtsu