The partial dependence plot (short PDP or PD plot) shows the marginal effect one or two features have on the predicted outcome of a machine learning model. A partial dependence plot can show whether the relationship between the target and a feature is linear, monotonic or more complex. For example, when applied to a linear regression model, partial dependence plots always show a linear relationship.
In this repo we use a PDP graph used to gauge how the variation of a single parameter Ceteris paribus affects the output of a ML Model.
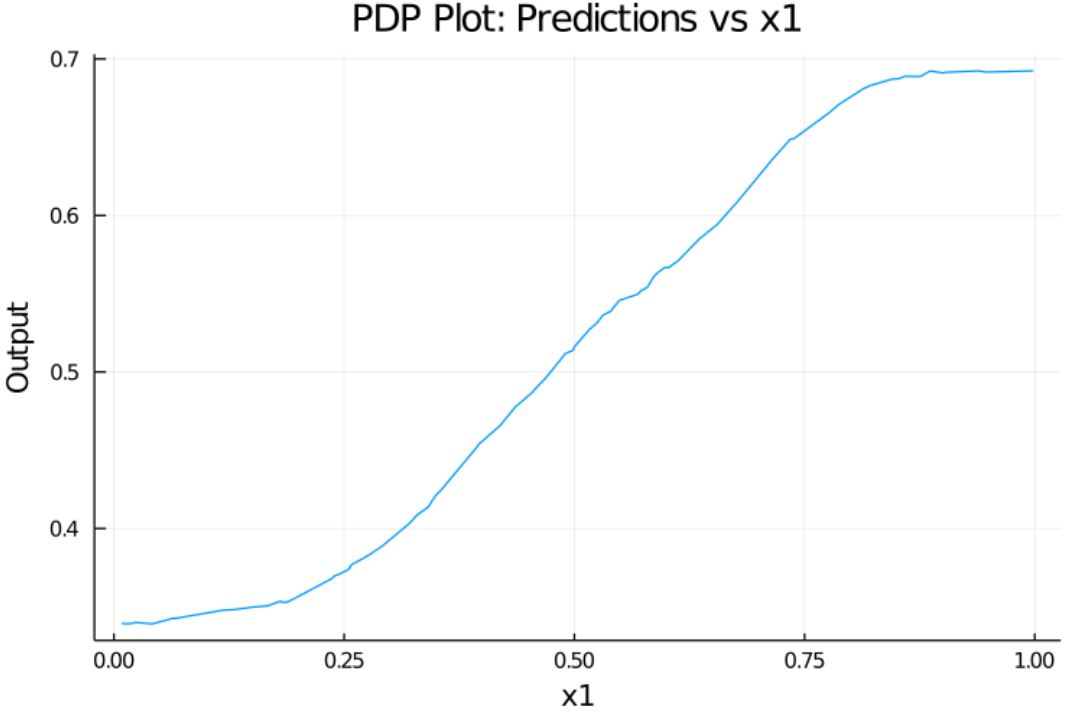
Here we use a synthetic data and a KNN model trained on that data and see how the variation of one parameter ("x1") varies the prediction of the model. Model Used, along with the synthetic data and RNG seed
| legend | |
|---|---|
| X_Axis | x1 |
| Y_Axis | The prediction of the KNNRegressor |
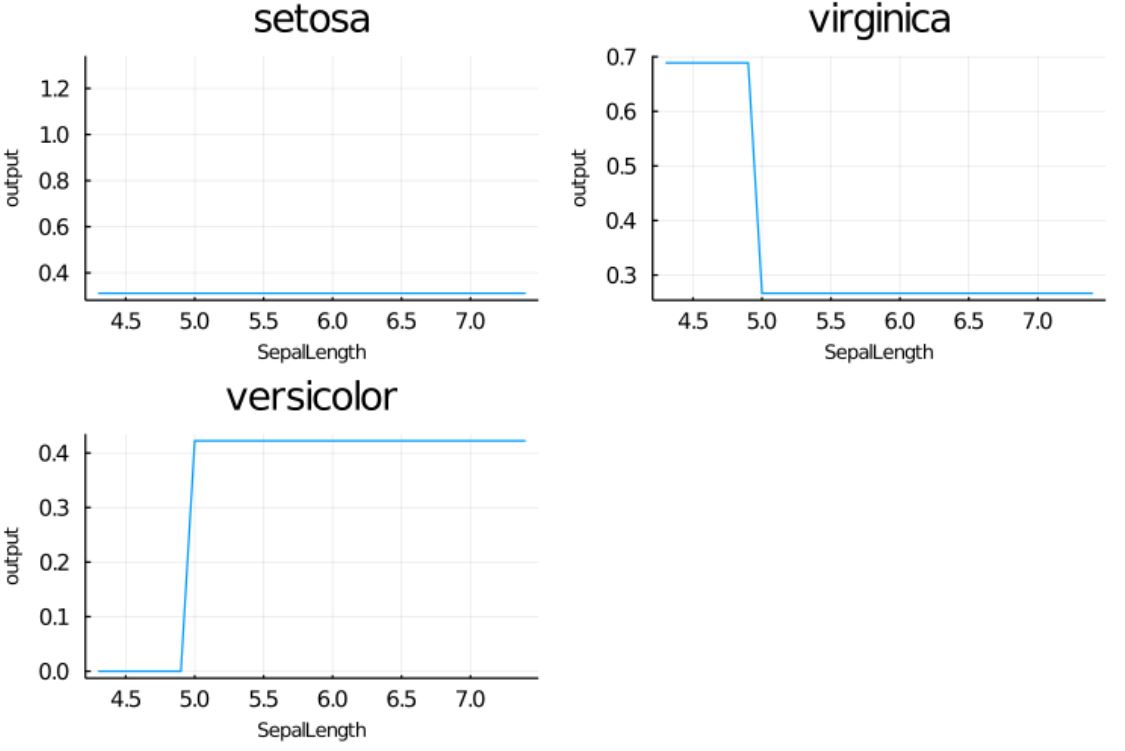
Here we use the iris dataset to train a simple DecisionTreeClassifier and see how the variation of one parameter (Sepal Length) Changes the output ( species prediction ).
Model Used
| legend | |
|---|---|
| X_Axis | Sepal Length |
| Y_Axis | Mean probability of classification (type is the title of the subplots) |
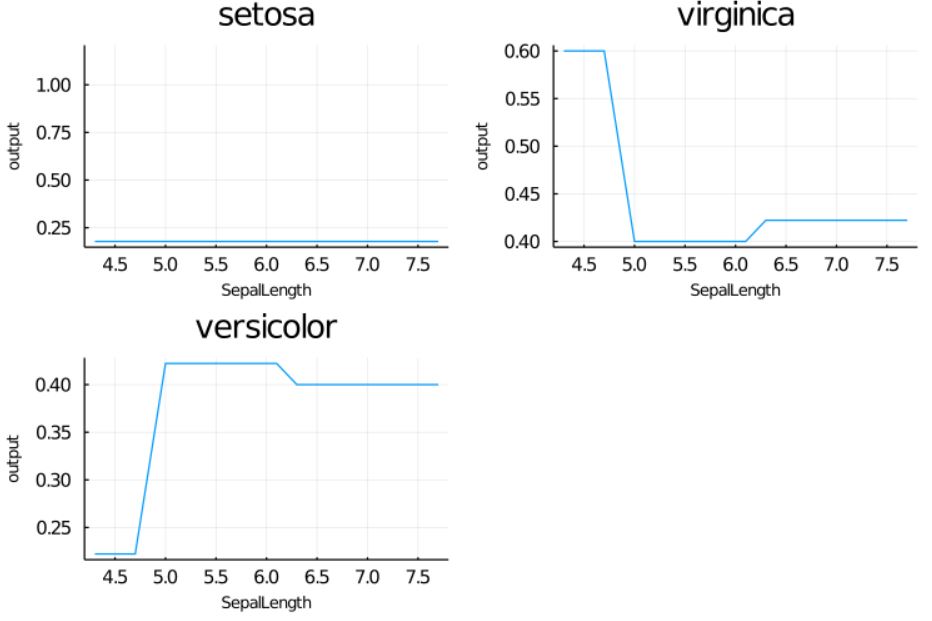
After setting the max depth of the trees to 4
tree = Tree(max_depth = 4)
These plots show the isolated effect of just the Sepal Length on the classification done by the model.
PDP tutorial
Model Used, along with the synthetic data and RNG seed for Sample 1
Model Used for Sample 2


