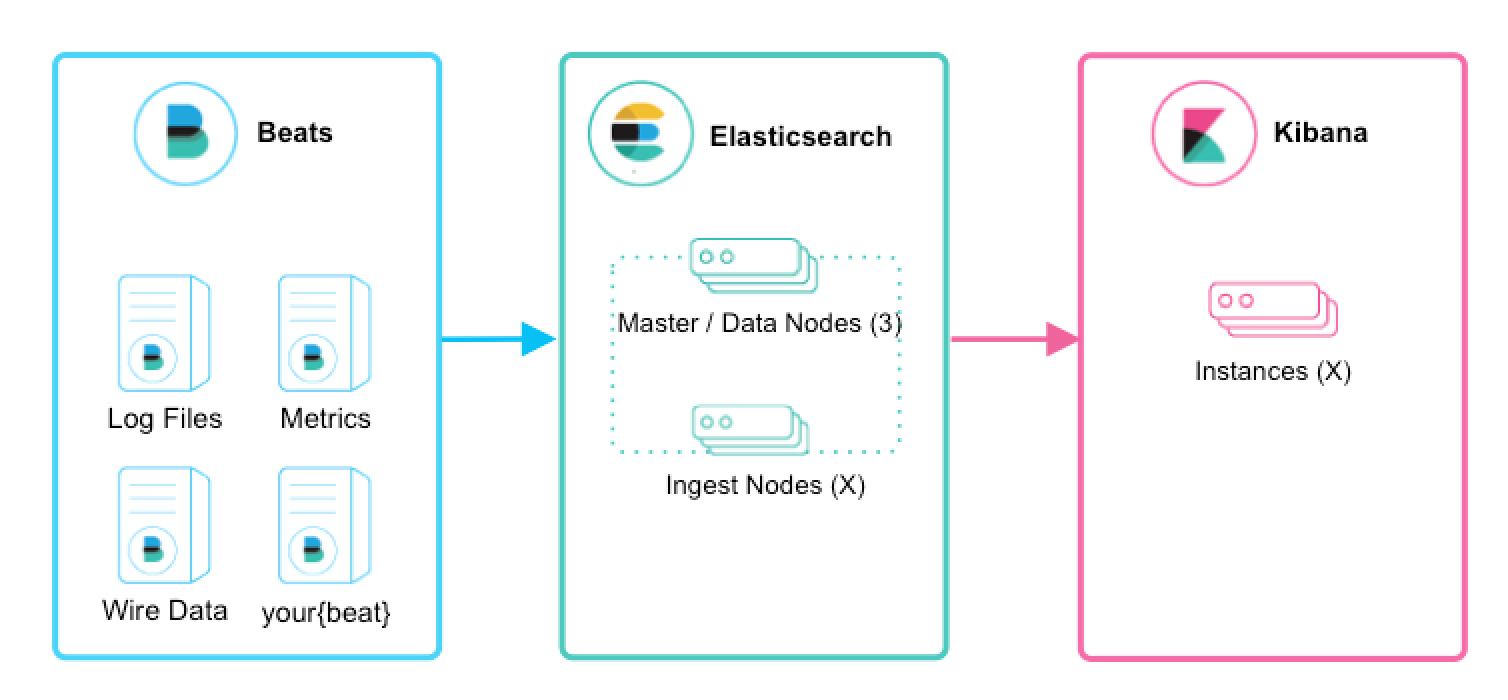
As a DevOps team member, I want to install Elastic Stack so that all application and system logs are collected centrally for searching, visualizing, analyzing and reporting purpose
- Infrastructre is setup in Docker swarm mode
- All containerized custom applications are designed to start with GELF log driver in order to send logs to Elastic Stack
The architecture used is shown in the table below
- A docker swarm mode cluster allocated to running Elastic Stack must have at least two nodes; 1x master and 1x worker
- A docekr swarm mode cluster allocated to running containerized custom applications must have at least on node; 1x master
- On each Elasticsearch cluster node, maximum map count check should be set to as follows: (required to run Elasticsearch)
sudo sysctl -w vm.max_map_count=262144sudo echo 'vm.max_map_count=262144' >> /etc/sysctl.conf(to persist reboots)
SSH in to the master node of the Docker Swarm cluster allocated to running Elastic Stack. Clone this repo and change directory by following these commands:
-
alias git='docker run -it --rm --name git -v $PWD:/git -w /git indiehosters/git git' -
git version -
git clone https://github.com/shazChaudhry/docker-elastic.git -
sudo chown -R $USER:$USER docker-elastic -
cd docker-elastic -
Deploy Elastic stack by running the following commands:
export ELASTIC_VERSION=6.2.4docker network create --driver overlay elasticdocker stack deploy --compose-file docker-compose.yml elastic(This will deploy a reverse proxy, logstash, Kibana and 2x Elasticsearch instances in Master / data nodes configuration. Please note that Elasticsearch is configured to start as a global service which means data nodes will be scalled out automatically as soon as new nodes are added to the docker swarm cluster. Here is an explaination on various Elasticsearch cluster nodes: https://discuss.elastic.co/t/node-types-in-an-elasticsearch-cluster/25488)
-
Check status of the stack services by running the following commands:
docker stack services elasticdocker stack ps --no-trunc elastic(address any error reported at this point)curl -XGET -u elastic:changeme '127.0.0.1:9200/_cat/health?v&pretty'(Inspect cluster helth status which sould be green. It should also show 2x nodes in todal)
-
If in case beats are also desired to be installed in this very docker swarm cluster, then use the instructions provided in the next section
SSH in to the master node of the Docker Swarm cluster allocated to running containerized custom applicatins and beats. Clone this repo and change directory as per the instructions in the previous section
Execute the following commands to deploy filebeat and metricbeat:
export ELASTIC_VERSION=6.2.4docker network create --driver overlay elastic- Edit "filebeat-docker-compose.yml" file. Change environment variables for Kibana and Elasticseaerch hosts
docker stack deploy --compose-file filebeat-docker-compose.yml filebeat(Filebeat starts as a global service on all docker swarm nodes. It is only configured to picks up container logs for all services at '/var/lib/docker/containers/*/*.log' (container stdout and stderr logs) and forward thtem to Elasticsearch. These logs will then be available under filebeat index in Kibana. You will need to add additional configurations for other log locations. You may wish to read Docker Reference Architecture: Docker Logging Design and Best Practices)- Running the following command should print elasticsearch index and one of the rows should have filebeat-*
curl -XGET -u elastic:changeme '[ELASTICSEARCH_HOMST]:9200/_cat/indices?v&pretty'
- Edit "metricbeat-docker-compose.yml" file. Change environment variables for Kibana and Elasticseaerch hosts
docker stack deploy --compose-file metricbeat-docker-compose.yml metricbeat(Metricbeat starts as a global service on all docker swarm nodes. It sends system and docker stats from each node to Elasticsearch. These stats will then be available under metricbeat index in Kibana)- Running the following command should print elasticsearch index and one of the rows should have metricbeat-*
curl -XGET -u elastic:changeme '[ELASTICSEARCH_HOMST]:9200/_cat/indices?v&pretty'
docker stack deploy --compose-file packetbeat-docker-compose.yml packetbeat(Packetbeat starts as a global service on all docker swarm nodes)
NOTE: Packetbeat does not appear to work in docker swarm mode. See https://discuss.elastic.co/t/run-packetbeat-in-docker-swarm-mode/129937
Wait until all stacks above are started and are up and running and then run jenkins container where filebeat is running:
docker run -d --rm --name jenkins -p 8080:8080 jenkinsci/blueocean- Login at
http://[KIBANA_HOST]:5601which should show Management tab- username =
elastic - password =
changeme
- username =
- On the Kibana Management tab, configure an index pattern
- Index name or pattern =
filebeat-* - Time-field name =
@timestamp
- Index name or pattern =
- Click on Kibana Discover tab to view containers' console logs (including Jenkins) under filebeat-* index. Here is a screenshot showing Jenkins container logs:
Logstash pipeline is configured to accept messages with gelf log driver. Gelf is one of the plugin mentioned in Docker Reference Architecture: Docker Logging Design and Best Practices. Start an application which sends messages with gelf. An example could be as follows:
- Stop the Jenkins container started earlier:
docker container stop jenkins - Start Jenkins container again but with gelf log driver this time:
docker container run -d --rm --name jenkins -p 8080:8080 --log-driver=gelf --log-opt gelf-address=udp://[LOGSTASH_HOST]:12201 jenkinsci/blueocean- Note that
--log-driver=gelf --log-opt gelf-address=udp://[LOGSTASH_HOST]:12201sends container console logs to Elastic stack
- Note that
- On the Kibana Management tab, configure an index pattern
- Index name or pattern =
logstash-* - Time-field name =
@timestamp
- Index name or pattern =
- Click on Discover tab and select logstash-* index in order to see logs sent to Elasticsearch via Logstash. Here is a screenshot showing Jenkins container logs:
Here is another example:
docker container run --rm -it --log-driver=gelf --log-opt gelf-address=udp://[LOGSTASH_HOST]:12201 alpine ping 8.8.8.8- Login to Kibana and you should see traffic coming into Elasticsearch under
logstash-*index - You can use syslog as well as TLS if you wish to add in your own certs
- Elastic Examples
- Unifying APM, Logs, and Metrics for Deeper Operational Visibility
- Machine Learning in the Elastic Stack - YouTube
- Monitoring Modern Banking API Architectures with the Elastic Stack, Part II
- Security and Threat Detection with the Elastic Stack
- Machine Learning and Elasticsearch for Security Analytics

