Visualization coding practices primarily using D3.
Force-directed Graph
-
Description
Model the graph as a physical system — nodes are particles that repel each other, and links are springs that pull related nodes together — to determines the node positions. Based on strong theoretical foundations, such layout is usually simple, aesthetic, interactive and of good quality.
-
without D3
-
implementation
-
Generate nodes and links randomly
-
Calculate Repulsion and Attraction
based on the Coulomb's law
$F_r=k_r\frac{q_1q_2}{r^2}$ and Hooke's law$F_s=k_s(x-x_0)$ , we assume both$q_1$ and$q_2$ is equal to$1$ , and adjust the constant coefficients to produce a pleasing effect. -
Update coordinates
-
Go to step2 and iterate enough times
-
Illustrate the graph
-
-
results
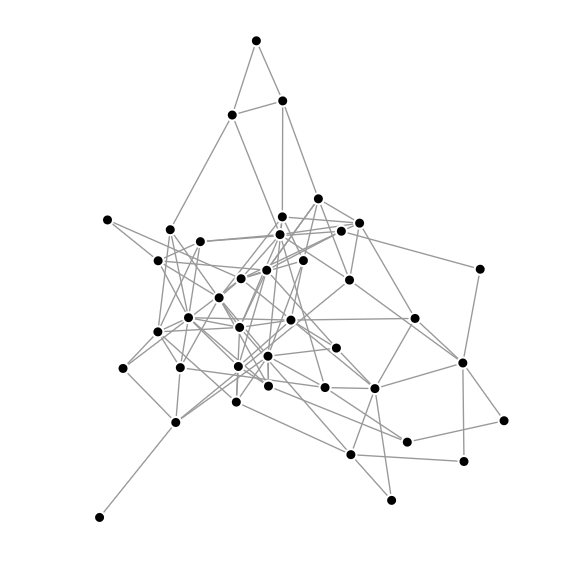
Figure 1a. 30 nodes iterating 1000 times
-
-
With D3
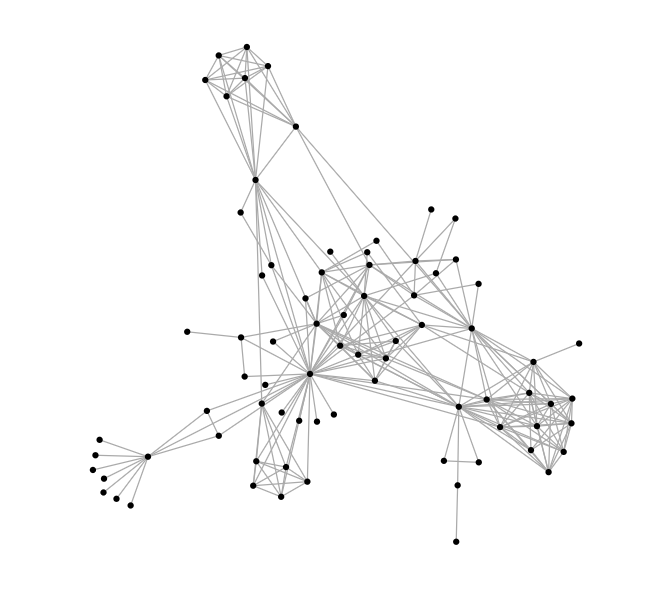
Figure 1b. network of character co-occurence in Les Misérables illustrating with D3


Word Cloud

Figure 2 word cloud of "The Zen of Python, by Tim Peters"
Stacked Graph

Figure 3 stacked(or stream) graph of randomly generalized data of 20 layers